
- About Us
- Information
-

The Author ensures that the research has been conducted responsibly and ethically with adherence to all relevant regulations. read more..
- For Authors
- For Reviewer
- Manuscript Guidelines
- Membership
- Publication Ethics
-
- Journals
- Reprints
- e-Books
- Videos
- Policies
- Contact Us
 COVID-19
- Submissions


Full Text
Cohesive Journal of Microbiology & Infectious Disease
Development of Disease Scoring System for Severity Analysis of Late Blight of Potato based on Image Processing Approach
Satyendra Nath Mandal1*, Kunal Roy1, Sanket Dan1, Subhranil Mustafi1, Subrata Dutta2, Ashis Roy Barman2 and Ashis Chakraborty2
1Information Technology, India
2Plant Pathology, India
*Corresponding author: Satyendra Nath Mandal, Information Technology, India
Submission: January 1, 2021; Published: March 04, 2021

ISSN 2578-0190 Volume5 issues1
Abstract
The severity for late blight disease of potato is quantified based on standard disease grading scale mainly by measure with the eye, which is greatly influenced by subjective factors and results in obvious error using Henfling disease estimation scale. The plant pathologists generally graded the late blight disease severity based on eye estimation for percent infected area according to the disease grading scale of Henfling. The disease scoring system is primarily the eye estimation methods and scores are varied among different pathologists. In this paper, an attempt has been made to develop image processingbased disease estimation for late blight of potato. The late blight affected portions of leaflets, leaves and whole plants have been evaluated using image analysis system. The percentages of affected areas have been calculated and scores have been assigned based on proposed scale. The assigned scores have also been verified from several plant pathologists based on Henfling’s disease scale. The gap of disease intensity variation between pathologist’s evaluation and image processing system has been fine-tuned by modification of the scale and finally the accuracy of scores estimation based on proposed image analysis system is 85% and could be effectively exploited for late blight of potato disease estimation.
Keywords: Late blight of potato; Henfling Disease estimation scale for late blight; Image based disease estimation scale; Image analysis; Plant pathology
Introduction
Late blight, (Phytophthora infestans) is most devastating disease of potato worldwide with
several instances of catastrophic extent with huge economic and humanitarian loss. Under
cool night and warm day and extended wet condition, this pathogen sporulate profusely so
that entire potato field can be destroyed in less than ten days. The average annual losses due
to late blight was to 15% of total production in the country. Late blight results in global annual
losses of potatoes that would be sufficient to feed anywhere from 80 to many hundreds of
millions of people [1-10]. Global tuber yield losses were reported to be €12 billion [5]. The
reasons for such losses are the manual observation of the disease in the potato field when
the pathogen spread very fast so that the management become ineffective. Thus, quick and
early detection of disease is an important landmark for successful management. Traditionally,
plant disease severity is scored with visual inspection of plant tissue by trained experts. The
inconsistent results on measurement of plant disease based on eye estimation hinders the
decision support system of fungicidal management schedule of late blight of potato.
One alternative method is automatic prediction of disease intensity through image-based
analysis so that farmers may be able to spray effective fungicides in proper time. With the
population of digital cameras and the advances in computer vision, the automated disease
diagnosis models are highly demanded by precision agriculture, high-throughput plant
phenotype, smart green house, and so forth. In recent years, spectral image-based disease
severity scoring has gained new height, however, number of research works in this direction
is meagre. Noticeably, deep learning convolutional neural networks, random forests and
multilayer perceptron using band differences has been used to predict the level of infection of
Phytophthora infestans on potato crops in Colombia [8-10]. Further, high-resolution portable
spectral sensor was utilized to investigate the feasibility of detecting multi-diseased tomato
leaves in different stages of crop growth, including early or asymptomatic stages [11-13].
The standard late blight disease scoring scale was developed
by Henfling (1979). However, human eye estimation accuracy is
variable. To incorporate the Henfling modified disease scoring
system in image analysis-based system which will help in disease
estimation without skilled personnel, it is necessary to standardize
and humanize the scoring system so that the resulting disease
severity will support the plant pathologist’s and agriculturist’s
scoring. Moreover, computerized errors in image analysis, such
as presence of colour variegation, dart, yellow halo etc. may also
be considered and standardized in image analysis system so that
the ultimate result will become reasonably accurate. Thus, aim of
this research work has been finalized towards visual estimation of
the disease symptoms by numerous subjects, standardization of
the scoring scale and developed an image-based disease severity
assessment scale for late blight of potato.
Materials and Methods
Collection of healthy and late blight affected potato plant image
The experiment was conducted District Seeds Farm “C” Unit of at Bidhan Chandra Viswasvidyalaya situated at Kalyani, Nadia, West Bengal, India images of symptomatic leaves were captured at different day light using DSLR camera. To remove the influence of soil colour, which is difficult to differentiate from dry potato leaves, one white A4 paper was placed under leaflet, leaf to cover the soil under tree before capturing pictures. Many pictures were captured for single leaflet, leaf, and whole plant from top and two sides keeping almost equal distances, placing on A4 white paper beneath (Figure 1), and pictures with shadow, improper lighting (blurred images) and with unwanted leaflets and excessive noise were discarded.
Figure 1: Field view of the experiment conducted in District Seeds Farm “C” Unit of at Bidhan Chandra Viswasvidyalaya (A-C), representative pictures of the leaflet (D), whole leaf (E) and potato plant (F-I).

Segmentation of late blight affected area at leaflet
Disease rating scale and affected leaflets: Disease rating scale plays important role to measure the disease intensity. Generally, the healthy leaves are assigned scale as ‘0’ and dry leaves or plant are assigned by the maximum number with ‘9’. The scores between 0 and 9 are divided into either 1,3,5,7 or 1,2,3,4,5,6,7,8 scales. The score is assigned by the plant pathologist based on their eye estimation. The percentage of the affected area and their scores based on the plant pathologist eye estimation has shown in the Figure 2.
Figure 2: Percentage of affected potato leaflets and disease rating scores

K-means clustering: k-means clustering is one of the classical approach to solve the clustering problem. Main objective of the algorithm is to choose k-number of cluster centroid in such a way that each data point belonging to a given image data set and associate it to the nearest center [12-15]. This evaluation has made by Euclidean distance metric. The algorithm aims at minimizing an objective function know as squared error function given by equation 1.
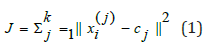
‘||xi - vj||’ is the Euclidean distance between xi and vj.
‘ci’ is the number of data points in ith cluster.
‘c’ is the number of cluster centers.
Late blight affected image processing and score assignment: An algorithm has been developed to identify the actual disease affected area of the potato leaflet images. The algorithm has been taken the RGB potato images with white background. The actual affected area has been segmented using k-means clustering. Finally, percentage of affected area has been calculated from each leaflet, leaf or plant. Based on this percentage value, a disease score has been assigned consulting with disease rating scale. Details steps has been described using flowchart in Figure 3. In individual leaflet, the leaflet image with white background has been preprocessed. In pre-processing, the all-leaflet pictures have been resized into 1000×1280 pixel for making all pictures in same size. The unwanted portion i.e., outside of white A4 paper has been removed to keep whole background white. The leaflet has been segmented from white background and the affected portion of leaflet due to late blight has been segmented in each leaflet using k-mean clustering method [6-10]. The percentage of affected portion has been calculated with respect to whole leaflet and score has been generated using Henfling modified disease estimation scale for late blight of potato. The steps of segmentation are shown in Figure 4.
Figure 3: Flowchart of the processing affected images and score assignment

Figure 4: Segmentation of late blight affected area of leaflet.

Calculation of image-based scoring of late blight
Table 1:Henfling modified disease estimation scale for late blight of potato.

The actual affected area on leaflets, leaves and plants have been calculated in percentages. The scores have been assigned based on Henfling modified disease estimation scale for late blight. The same pictures were provided to eight plant pathologists who are working at different posts associated with Plant Pathology for visual scoring. The 68 pictures were assigned score as 0,1,3,5,7 and 9 where 0 means no visual symptom expression and 9 means >60% leaf area infected, according to Henfling scale (Table 1) and the modal scale has been estimated. Percentage of matching has been calculated between image-based scoring system and eye estimation-based scoring system in each score and modal matching score. The average percentages of matching have been calculated from the matching scores. Correlation was performed using SPSS package version 23. The Henfling modified scale has been modified by changing the upper and lower limit of each score boundaries for increasing of matching percentage between image based and experts’-based scoring system.
Proposed image-based disease scoring scale for late blight of potato
The disease intensity of late blight of potato is estimated by plant pathologists based on their expertise. They have estimated scores based on Henfling modified disease estimation scale for late blight of potato. The resultant disease scores were varied among various subjects based on their experience. Moreover, image-based disease estimation system based on Henfling modified scale also varied from eye-based disease estimation score for late blight of potato. To bridge this gap, one modified scale for image-based scoring of late blight of potato has been proposed (Table 2).
Table 2:Modified image-based scoring scale for late blight of potato.

Result and Discussion
After capturing, the late blight affected pictures have been selected for late blight disease estimation of potatoes based on various criteria of image processing. The affected portion has been segmented and affected pixels have been calculated. The percentages of affected area have been calculated based on total pixels in leaflet, leaves and potato plants and affected area on them is given in Table 3. The same pictures were also scored visually by Plant Pathologists’ based on their experiences using Henfling modified scoring estimation scale for late blight of potato (Table 4) and the modal value of visual scoring has been estimated. The correlations among image based and visual disease scoring along with modal values have been calculated. The percentage of similarity between image-based scoring and pathologists-based scoring for each scoring have been calculated (Table 5). The overall matching score between image-based estimation and eye-based estimation was 69%. To increase the percentage of matching score, a new disease scoring scale for late blight of potato has been proposed in Table 2 and the percentages of matching has been calculated is 85% (Table 6). It was observed in the current experiment that the concurrent disease scores in the image based and eye estimated scoring system are differed significantly. Therefore, the percentage of matching between the two systems is not high (Table 5). However, the imagebased disease estimation scores are constant in all times and it is not dependent on expertise of evaluators. In order to simulate the eye estimated expert scoring to layman, it is therefore necessary to modulate the existing Henfling modified scale to our need. The existing Henfling modified disease scoring scale is thus modified so that image-based disease estimation scoring for late blight of potato will work like Henfling modified scale.
Table 3: Image analysis-based assignment of disease scores to late blight infected potato leaves based on percentage of leaf area infected after Henfling (1979).

Table 4: Relationship between late blight disease scoring through visual scoring of subjects and image-based scoring system.

Table 5: Relationship of Plant Pathologists’ scoring with image-based scoring system following the scale of Henfling (1979).

Table 6:Matching between image-based disease score scoring with eye estimation score using modified scale.

Conclusion
In this research work, image-based disease estimation scoring for late blight of potato has been standardized to emulate the scoring according to Henfling (1979) by visual estimation in such a way that the image analysis-based scoring will generate tangible outcome towards visual estimation. It is observed that the matching scores based on proposed scale is given 85% accuracy which is a very good disease estimator. The disease scale is proposed based on the analysis of the captured images of leaflets, leaves and plants as a whole, affected by late blight, with white background. The uniform background of leaflets leaves, and plants have been made using white A4 paper below it. This modified scale will further need to be verified and standardized with larger set of images and with natural background in future. It may be emphasized from the above finding that this modified scale will be of great use to breeders, farmers and layman for late blight disease scoring in the absence of a qualified Plant Pathology expert or where there is no provision of the same. An inbuilt or cloud computation-based Android app developed using this app enriched with management aspects will generate valuable information to users for the identification of this disease, knowing the extent of infection and time and duration of management of this disease. This computational knowledge may further be extended for the identification of other foliar diseases of various crops including potato which could be a great support for the farming as well as scientific community [13-18].
Acknowledgement
The authors would like to thank to Department of Higher Education, Science & Technology and Biotechnology, Government of West Bengal (Memo No-33/(Sanc.)/ST/P/S&T/6G-41/2017 dated 12/06/2018) for funding this research work.
References
- Peerzada SH, Najar AG, Ahmad M, Dar GH, Bhat KA (2013) Studies on status of late blight disease (Phytophthora infestans (Mont) de Bary) of Potato in Kashmir Valley. Int J Curr Microbiol App Sci 2(10): 7-15.
- Biswal G, Dhal NK (2013) Survey on natural occurrence of diseases in potato at various ocations of Odisha. International Journal of Plant Rotection 6(1): 188-191.
- Baker KM, Kirk WW, Andresen J, Stein JM (2002) A problem case study: influence of climatic trends on late blight epidemiology in potatoes. International Society for Horticultural Science 638(3): 37-42.
- Ahmed N, Khan MA, Khan NA, Ali MA (2015) Prediction of potato late blight disease based upon environmental factors in Faisalabad. Pakistan J Plant Pathol Microbiol.
- Chaudhary P, Chaudhari AK, Cheeran AN, Godara S (2012) Color transform-based approach for disease spot detection on plant leaf. International Journal of Computer Science and Telecommunications 3(6): 65-70.
- Al Bashish D, Braik M, Bani AS (2011) Detection and classification of leaf diseases using K-means-based segmentation. Information Technology Journal 10(2): 267-275.
- Prajapati HB, Shah JP, Dabhi VK (2017) Detection and classification of rice plant diseases. Intelligent Decision Technologies 11(3): 357-373.
- Mainkar PM, Ghorpade S, Adawadkar M (2015) Plant leaf disease detection and classification using image processing techniques. International Journal of Innovative and Emerging Research in Engineering 2(4): 139-144.
- Sidqi, Kakbra (2014) Image classification using k-mean algorithm. International Journal of Emerging Trends & Technology in Computer Science 3(1): 38-41.
- Fisher MC, Henk DA, Briggs CJ, Brownstein JS, Madoff LC, et al. (2012) Emerging fungal threats to animal, plant and ecosystem health. Nature 484(7393): 186-194.
- Haverkort AJ, Struik PC, Visser RGF, Jacobsen EJPR (2009) Applied biotechnology to combat late blight in potato caused by Phytophthora infestans. Potato Research 52(3): 249-264.
- Duarte C, Alzate DF, Ramirez AA, Santa S, Fajardo R, et al. (2018) Evaluating late blight severity in potato crops using unmanned aerial vehicles and machine learning algorithms. Remote Sensing 10(10): 1513.
- Lu J, Ehsani R, Shi Y, Castro AI, Wang S (2018) Detection of multi-tomato leaf diseases (late blight, target, and bacterial spots) in different stages by using a spectral-based sensor. Scientific Reports 8(1): 1-11.
- Henfling JW (1987) Late blight of potato. International Potato Center, USA.
- Singh A, Yadav A, Rana A (2013) K-means with three different Distance Metrics. International Journal of Computer Applications 67(10).
- Chen K (2009) On coresets for k-median and k-means clustering in metric and Euclidean spaces and their applications. SIAM 39(3): 923-947.
- MacQueen J (1967) Some methods for classification and analysis of multivariate observations. Cite Seer 1(14): 281-297.
- Hartigan JA, Wong MA (1979) Algorithm AS 136: A k-means clustering algorithm. Journal of the Royal Statistical Society 28(1): 100-108.
© 2021 Satyendra Nath Mandal. This is an open access article distributed under the terms of the Creative Commons Attribution License , which permits unrestricted use, distribution, and build upon your work non-commercially.
Editor In Chief


.jpg)


Signup for Newsletter

Quick Links
 Editorial Board Registrations
 Submit your Article
 Refer a Friend
 Advertise With Us
Our Recent Edition

.jpg)


Top Editors


.jpg)


.bmp)
.jpg)
.png)
.jpg)


.jpg)


.png)

.png)


.png)


Financial Support

Sponsors

Latest e-Books

Latest Video

 a Creative Commons Attribution 4.0 International License. Based on a work at www.crimsonpublishers.com.
Best viewed in
a Creative Commons Attribution 4.0 International License. Based on a work at www.crimsonpublishers.com.
Best viewed in