- Submissions

Full Text
Cohesive Journal of Microbiology & Infectious Disease
Comparison of Ultrabio HIV DNA PCR and Gag Real-Time PCR Assays for Total Hiv-1 DNA Quantification
Cong Yu1, Can Yuan2*, Jiankun W1, Shengxin Li2 and Tuofu Zhu1*
1Department of Laboratory Medicine, USA
2Ultrabio Technologies, USA
*Corresponding author: Can Yuan, Department of Laboratory Medicine, USA Tuofu Zhu, Department of Laboratory Medicine, USA
Submission: February 29, 2020; Published: March 10, 2020

ISSN 2578-0190 Volume3 issues4
Abstract
Total HIV-1 DNA has been shown to reflect reservoir size in HIV-1 infected individuals and correlate with viral rebound time after therapy interruption. Quantification of total HIV-1 DNA level may be used to study and evaluate reservoir elimination therapies. There is currently no FDA approved HIV- 1 DNA quantification assay available. The performance of a research uses only kit, Ultrabio HIV DNA quantification kit, was compared to a commonly used laboratory qPCR method targeting the gag region (GAG PCR). The limit of detection (LOD) and precision was evaluated with serially diluted 8E5/LAV DNA. LOD of Ultrabio Kit and GAG PCR was determined to be 4 and 25 copies/reaction, respectively. The Ultrabio Kit showed less variation when HIV-1 DNA concentration was lower than 20 copies/reaction. Twentysix HIV-1 infected patients’ PBMCs samples were quantified by both methods and the Ultrabio kit showed higher sensitivity. GAG PCR was unable to detect 2 of the samples while Ultrabio Kit was able to detect all. Both 2 samples had undetectable viral load. The quantified HIV DNA copies/million cells of the 24 detected samples by both methods showed good correlation, r=0.91. The difference was within one log.
Keywords: HIV-1 total DNA; real-time PCR; HIV-1 DNA reservoir; GAG real-time PCR; Quantification
Introduction
Antiretroviral therapy (ART) has greatly decreased the morbidity and mortality of HIV-1 infection. Despite the effectiveness of ART, immediate rebound is often observed after therapy cessation even in long-term suppressed patients [1,2]. The eradication or functional cure of HIV infection is hindered by the persistence of HIV in cellular reservoirs [3,4]. The current ART is not able to directly target the existing HIV DNA reservoir. Many new therapeutic strategies are being pursued to eradicate or reduce HIV reservoirs [5-10]. During ART, total HIV DNA declines but remains quantifiable [11], and is widely used to estimate reservoir size. The frequency of latently infected cells is estimated to be 1-100 cells per one million resting CD4+ T cells [12]. Although the majority of HIV DNA is defectiv [13], total HIV-1 DNA has been shown to be more predictive of disease progression than plasma viral load and could predict time to plasma virus rebound [14,15]. HIV DNA also correlates with biomarkers of inflammation and immune activation during ART [16]. Lately, peripheral blood lymphocyte HIV DNA levels have been shown to correlate with HIV associated neurocognitive disorders independent of plasma HIV RNA [17]. Total and integrated HIV DNA have been shown to be correlated with the quantitative viral outgrowth assay (QVOA) and may predict the size of the replication-competent virus in ART suppressed patients [18]. Recent studies showed that total HIV DNA, instead of intact DNA, was able to differentiate post-treatment controllers from non-controllers. Compared to culture-based assays or reporter-cell-based assay [19], real-time PCR assays are more advantageous in less sample and time consumption, increased reproducibility and higher throughput [20]. Considering the low frequency of HIV DNA reservoir, a sensitive, accurate, and precise method to quantify HIV DNA is essential for evaluating curing strategies. We compared the analytical performance and total HIV-1 DNA quantification in patient PBMCs between a newly developed Ultrabio HIV-1 DNA PCR (Ultrabio Techenologies, Inc, Seattle, USA) and a well-adapted real-time PCR method targeting gag region, GAG PCR [21].
Materials and Methods
8E5/LAV and U1 cell controls from Virology Quality Assurance (VQA, Rush University) were used as standard materials in the evaluation of analytical performance. Each 8E5/LAV and U1 cell contains 1 and 2 copies of provirus, respectively.
DNA extraction
Genomic DNA was extracted from cells by QIAamp Blood Mini Kit (QIAGEN) and eluted in 50μL low EDTA TE buffer.
HIV DNA quantificationThe Ultrabio HIV-1 DNA PCR is a multiplex real-time PCR method that quantifies HIV-1 DNA copies and cell number simultaneously in one reaction using quantitative standards. The kit provided quantification standards were used for plotting standard curve. The cellular DNA quantification serves as an internal control for both DNA extraction and PCR amplification. The GAG PCR was used as an in-house assay in VQA proficiency tests for HIV-1 RNA quantification and in Seattle Primary Infection Program for quantification of HIV-1 RNA and DNA [21-25]. The standard curve of GAG PCR was prepared by serially diluting DNA from 8E5/LAV cells in low EDTA TE buffer (Affymetrix). To calculate HIV-1 DNA per million cells in GAG PCR, cell number per reaction was calculated from the DNA concentration (1μg = 150, 000 cells) [26,27] measured by Nanodrop One spectrometer (Thermo Fisher Scientific). The real-time PCR was performed in Quant-Studio 5 Real-Time PCR System (Thermo Fisher Scientific).
Results
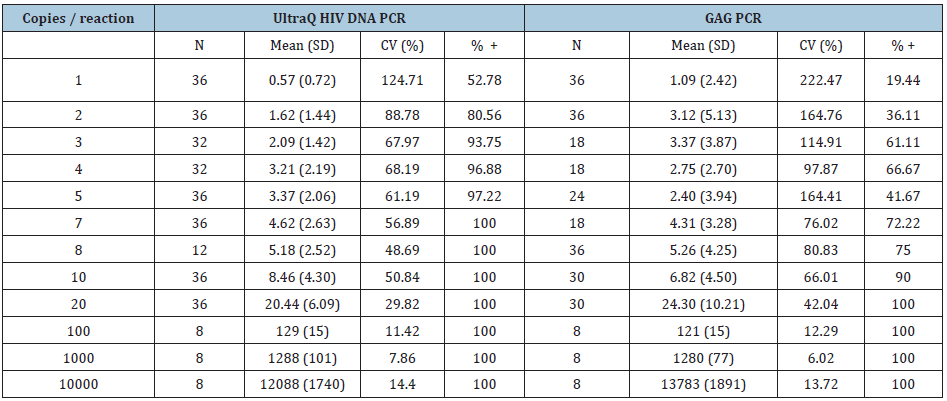
To study the limit of detection (LOD) and precision, DNA extracted from 8E5/LAV cells were diluted to 1,2,3,4,5,8,10,20,100,1000 and 10000 copies per PCR reaction in low EDTA TE buffer and quantified with both assays. Concentrations lower than 100 copies/reaction were analyzed in 12-36 replicates while 100-10000 copies/ reaction were analyzed in 8 replicates. The detection rate of each copy number was calculated by dividing the positive reactions by the total reactions (Table 1). LOD was defined as the concentration at which detection rate ≥95%. Probit analysis showed the LOD for the Ultrabio HIV DNA and the GAG PCR was 4.17 copies/reaction and 24.81 copies/reaction, respectively. Studies in post-treatment controllers showed that 100 copies/million PBMCs might be the threshold of successful maintenance of viral suppression after cessation of ART [28,29]. The lower LOD of the Ultrabio HIV DNA PCR potentially allowed it to detect HIV-1 DNA level lower than 100 copies/million PBMCs using less DNA input, which might induce less inhibition to PCR amplification. For the Ultrabio HIV DNA PCR, the detection rate for 2 copies HIV-1 DNA/reaction is 65.66% and for 5 copies/reaction is 95.92% (Table 1). The sensitivity meets the VQA 8E5 HIV DNA assay sensitivity criteria, which is 50% and 95% detection rate for 2 copies and 5 copies, respectively. The observed concentration of both methods was plotted with the nominal 8E5/ LAV DNA copies/reaction (Figure 1) and the linear regression analysis showed high goodness of fit (both R Square=1). The coefficient of variation (CV%) was calculated from all replicates of each dilution (Table 1) and the undetected reactions were accounted for as zero copies. For low copy numbers (≤20 copies/ reaction), CV% was lower in Ultrabio HIV DNA compared to the GAG PCR, while for high copy number (≥100 copies/reaction), CV% was similar for both methods, indicating Ultrabio HIV DNA is more precise when quantifying low copy HIV-1 DNA. The lower limit of quantification (LLOQ) of the Ultrabio HIV DNA PCR corresponding to CV% ≤ 35% was around 10 copies/reaction. The LLOQ of the GAG PCR was between 20 to 100 copies/reaction. Standard realtime PCR assays are high in variation and noise when DNA copy number is below 100 copies/reaction [28,29] thus are not reliable in quantification of low level of HIV-1 DNA in patients. Compared to the in-house GAG PCR method, the Ultrabio HIV DNA showed higher sensitivity and precision in detection and quantification of HIV-1 DNA.
Table 1:Quantification of 8E5/LAV cell-associated DNA by UltraQ HIV DNA PCR and GAG PCR.

Figure 1: Quantification of different HIV-1 DNA copy numbers.

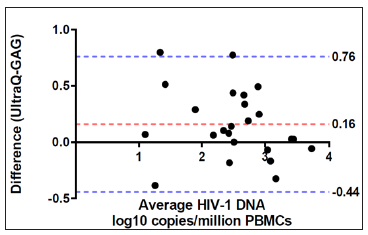
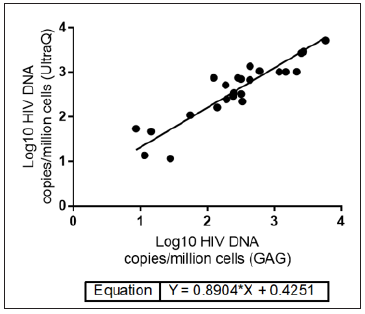
The quantification accuracy of the Ultrabio HIV DNA PCR was further studied by quantifying DNA extracted from the VQA U1 controls. The U1 controls were received from VQA as cell pellets containing one million PBMCs spiked with 30,90,270,810,2430 or 7290 U1 cells, which were equivalent to 60,180,540,1620,4860 or 14580 copies of HIV-1 DNA per million cells, respectively. HIV-1 DNA per million cells values quantified by the Ultrabio HIV DNA were highly correlated with the nominal values (R2=0.99, Figure 2), which indicated the high accuracy of the Ultrabio HIV DNA. Twentysix PBMCs samples from HIV-1 infected patients were analyzed with both assays to compare the quantification results. Out of the 26 clinical PBMCs samples, 21 had undetectable viral load (HIV-1 RNA <50 copies/mL) and 5 had HIV-1 RNA over 50 copies/mL plasma. In each reaction, 1.5×10⁵ or 2.5×10⁵ cells (1 or 1.67μg DNA) were added. Higher DNA input was used for samples having undetectable viral load. The Ultrabio HIV DNA was able to detect HIV-1 DNA in all samples while the GAG PCR detected 24 out of the 26 samples. The two undetected samples by the GAG PCR were quantified by the Ultrabio HIV DNA PCR as 10 and 7 HIV-1 DNA copies/million PBMCs and 2 HIV-1 DNA copies/reaction. As shown in the study of LOD (Table 1), the GAG PCR had lower detection rate for low level of HIV-1 DNA (≤10 copies/reaction). The difference of quantification results (Log10 copies/million PBMCs) between Ultrabio HIV DNA and GAG PCR of the 22 detected samples were evaluated by Bland- Altman assay (Figure 3). All the samples had difference within one log. Ultrabio HIV DNA PCR quantified total HIV-1 DNA slightly higher than the GAG PCR, showing a bias of 0.19±0.30. The Pearson correlation (r) between the two methods was 0.9134 (P<0.0001). The equation of Deming regression was y=0.89x+0.43 (Figure 4). The results of the two methods were highly correlated in the quantifiable samples. Two samples from the same patient showed lower HIV-1 DNA level in GAG PCR compared to Ultrabio HIV DNA PCR. Sequencing of the GAG region in the HIV-1 DNA genomes of the two samples (sequence deposited at Viroverse, https://viroverse. washington.edu) showed two nucleotides mismatch to the GAG PCR forward primer, which might lead to underestimation of HIV-1 DNA. The primers and probes in the Ultrabio HIV DNA PCR targeted a more conservative region, LTR, in the HIV-1 genome to achieve better coverage of different variants and specificity towards HIV-1 group M.
Figure 2: Quantification of U1 controls from VQA by UltraQ HIV DNA PCR. The U1 cells were received from VQA as cell pellets containing one million PBMCs spiked with 30, 90, 270, 810, 2430 or 7290 U1 cells and each U1 cell contained two proviral DNA.

Figure 3: Bland-Altman analysis of the quantification results (log10 HIV-1 DNA copies/ million PBMCs) from UltraQ HIV DNA PCR and GAG PCR. Cell-associated DNA extracted from twenty-four clinical PBMCs samples were analyzed by both methods.

Figure 4: Deming regression of HIV DNA levels in 24 patient PBMCs samples quantified by GAG PCR and UltraQ kit.

In a 50uL reaction, GAG PCR can only take 5μL of DNA template while Ultrabio HIV DNA PCR may take up to 20μL of DNA template, which is useful for samples with low cell availability or highly diluted DNA samples. Unlike viral load, there is currently no FDA approved assays for HIV-1 DNA quantification. The lack of a standardized and validated HIV-1 DNA quantification assay leads to discrepancy when comparing data generated from different site using different in-house methods. Increasing evidence has shown the clinical importance of total HIV-1 DNA in clinical management of people living with HIV-1. Compared to the commonly used GAG PCR, Ultrabio kit showed higher sensitivity and precision, which may potentially allow the Ultrabio HIV DNA PCR to provide reliable quantification of HIV-1 DNA for studies on future therapies.
Acknowledgement
The viral load and sequence information was obtained from Viroverse, https://viroverse.washington.edu.
Funding Sources
We thank the financial support from National Institutes of Health National Institute of Allergy and Infectious Diseases (AI55336).
Declaration of Interest
The authors, Can Yuan and Shengxin Li are employees of Ultrabio Technologies, Inc; the corresponding author, Dr. Tuofu Zhu holds shares of Ultrabio Technologies, Inc.
References
- Espy M, Uhl J, Sloan L, Buckwalter S, Jones M, et al. (2006) Real-time PCR in clinical microbiology: applications for routine laboratory testing. Clinical Microbiology Reviews 19(1): 165-256.
- Siliciano JD, Kajdas J, Finzi D, Quinn TC, Chadwick K, et al. (2003) Long-term follow-up studies confirm the stability of the latent reservoir for HIV-1 in resting CD4+ T cells. Nature Medicine 9(6): 727-728.
- Chun TW, Stuyver L, Mizell SB, Ehler LA, Mican JAM, et al. (1997) Presence of an inducible HIV-1 latent reservoir during highly active antiretroviral therapy. Proceedings of the National Academy of Sciences 94(24): 13193-13197.
- Darcis G, Van DB, Van Lint C (2017) HIV latency: should we shock or lock? Trends Immunol 38(3): 217-228.
- Hütter G (2016) Stem cell transplantation in strategies for curing HIV/AIDS. AIDS Research and Therapy 13(1): 31.
- Margolis DM, Garcia JV, Hazuda DJ, Haynes BF (2016) Latency reversal and viral clearance to cure HIV-1. Science 353(6297):
- Pankrac J, Klein K, Mann JF (2017) Eradication of HIV-1 latent reservoirs through therapeutic vaccination. AIDS Research and Therapy 14(1): 45.
- Perreau M, Banga R, Pantaleo G (2017) Targeted immune interventions for an HIV-1 cure. Trends in Molecular Medicine 23(10): 945-961.
- Pinkevych M, Cromer D, Tolstrup M, Grimm AJ, Cooper DA, et al. (2015) HIV reactivation from latency after treatment interruption occurs on average every 5-8 days-implications for HIV remission. PLoS Pathog 11(7): e1005000.
- Spragg C, Feelixge HDS, Jerome KR (2016) Cell and gene therapy strategies to eradicate HIV reservoirs. Current Opinion in HIV and AIDS 11(4): 442-449.
- Besson GJ, Lalama CM, Bosch RJ, Gandhi RT, Bedison MA, et al. (2014) HIV-1 DNA decay dynamics in blood during more than a decade of suppressive antiretroviral therapy. Clinical Infectious Diseases 59(9): 1312-1321.
- Hodel F, Patxot M, Snäkä T, Ciuffi A (2016) HIV-1 latent reservoir: size matters. Future Virology 11(12): 785-794.
- Bruner KM, Murray AJ, Pollack RA, Soliman MG, Laskey SB, et al. (2016) Defective proviruses rapidly accumulate during acute HIV-1 infection. Nature Medicine 22(9): 1043-1049.
- Avettand F, Hocqueloux V, Ghosn L, Cheret J, Frange A, et al. (2016) Total HIV-1 DNA, a marker of viral reservoir dynamics with clinical implications. Clinical Microbiology Reviews 29(4): 859-880.
- Williams JP, Hurst J, Stöhr W, Robinson N, Brown H, et al. (2014) HIV-1 DNA predicts disease progression and post-treatment virological control. Elife 3: e03821.
- Cockerham LR, Siliciano JD, Sinclair E, O'Doherty U, Palmer S, et al. (2014) CD4+ and CD8+ T cell activation are associated with HIV DNA in resting CD4+ T cells. PloS One 9(10): e110731.
- Jumare J, Sunshine S, Ahmed H, Kamary SS, Magder L, et al. (2017) Peripheral blood lymphocyte HIV DNA levels correlate with HIV associated neurocognitive disorders in Nigeria. Journal of Neurovirology 23(3): 474-482.
- Kiselinova M, Spiegelaere W, Buzon MJ, Malatinkova E, Lichterfeld M, et al. (2016) Integrated and total HIV-1 DNA predict ex vivo viral outgrowth. PLoS Pathogens 12: e1005472.
- Sanyal A, Mailliard RB, Rinaldo CR, Ratner D, Ding M, et al. (2017) Novel assay reveals a large, inducible, replication-competent HIV-1 reservoir in resting CD4+ T cells. Nat Med 23(7): 885-889.
- Rouzioux C, Avettand FV (2018) Total HIV DNA: A global marker of HIV persistence. Retrovirology 15: 30.
- Li CC, Seidel KD, Coombs RW, Frenkel LM (2005) Detection and quantification of human immunodeficiency virus type 1 p24 antigen in dried whole blood and plasma on filter paper stored under various conditions. Journal of Clinical Microbiology 43(8): 3901-3905.
- Gandhi RT, Coombs RW, Chan ES, Bosch RJ, Zheng L, et al. (2012) No effect of raltegravir intensification on viral replication markers in the blood of HIV-1-infected patients receiving antiretroviral therapy. Journal of Acquired Immune Deficiency Syndromes 59(3): 229-235.
- Stekler J, Sycks BJ, Holte S, Maenza J, Stevens CE, et al. (2008) HIV dynamics in seminal plasma during primary HIV infection. AIDS Research and Human Retroviruses 24(10): 1269-1274.
- Zuckerman RA, Lucchetti A, Whittington WL, Sánchez J, Coombs RW, et al. (2009) HSV suppression reduces seminal HIV-1 levels in HIV-1/HSV-2 coinfected men who have sex with men (MSM). AIDS 23(4): 479-483.
- Zuckerman RA, Lucchetti A, Whittington WL, Sánchez J, Coombs RW, et al. (2007) Herpes simplex virus (HSV) suppression with valacyclovir reduces rectal and blood plasma HIV-1 levels in HIV-1/HSV-2-seropositive men: a randomized, double-blind, placebo-controlled crossover trial. The Journal of Infectious Diseases 196: 1500-1508.
- Bosman KJ, Nijhuis M, Van Ham PM, Wensing AM, Vervisch K, et al. (2015) Comparison of digital PCR platforms and semi-nested qPCR as a tool to determine the size of the HIV reservoir. Scientific Reports 5: 13811.
- Véronique AF, Marie L, Stéphane C, Marianne B, Corinne B, et al. (2009) LTR real‐time PCR for HIV‐1 DNA quantitation in blood cells for early diagnosis in infants born to seropositive mothers treated in HAART area (ANRS CO 01). Journal of Medical Virology 81: 217-223.
- Sáez C, Bacchus A, Hocqueloux C, Avettand FL, Girault V, et al. (2013) Post-treatment HIV-1 controllers with a long-term virological remission after the interruption of early initiated antiretroviral therapy ANRS VISCONTI Study. PLoS Pathog 9(3): e1003211.
- Strain MC, Richman DD (2013) New assays for monitoring residual HIV burden in effectively treated individuals. Current Opinion in HIV and AIDS 8(2): 106-110.
© 2020 Can Yuan. This is an open access article distributed under the terms of the Creative Commons Attribution License , which permits unrestricted use, distribution, and build upon your work non-commercially.
 a Creative Commons Attribution 4.0 International License. Based on a work at www.crimsonpublishers.com.
Best viewed in


.jpg)


 Editorial Board Registrations
 Submit your Article
 Refer a Friend
 Advertise With Us
.jpg)


.jpg)


.bmp)
.jpg)
.png)
.jpg)


.jpg)


.png)

.png)


.png)


