
- About Us
- Information
-

The Author ensures that the research has been conducted responsibly and ethically with adherence to all relevant regulations. read more..
- For Authors
- For Reviewer
- Manuscript Guidelines
- Membership
- Publication Ethics
-
- Journals
- Reprints
- e-Books
- Videos
- Policies
- Contact Us
 COVID-19
- Submissions


Full Text
Cohesive Journal of Microbiology & Infectious Disease
Modeling with Hyperbolic Restrictions: The Nigerian Population Dynamics
Oyamakin SO* and Osanyintupin OD
Department of Statistics, West Africa
*Corresponding author:Oyamakin SO, Department of Statistics, Faculty of Science, University of Ibadan, Nigeria
Submission: February 08, 2019; Published: August 29, 2019

ISSN 2578-0190 Volume3 issues1
Abstract
Intercensal estimate is an estimate of population between official census dates with both census counts being known. This was observed for three cases using three growth models to determine the effectiveness of models in predicting correctly the census figure. Case 1 was the use of the 1963 population census result as the base year and 1991 population census result as the launch year. Case 2 was the use of the 1991 population census result as the base year and 2006 population census result as the launch year and case 3 was the use of the 1963 population census result as the base year and 2006 population census result as the launch year. The Nigeria population census figure for the year 1963, 1991 and 2006 were used for intercensal prediction while nonlinear estimation was applied on the data sourced online from 1955-2016 for model validation. A modified Hyperbolic Exponential Growth Model (HEGM) was used along with Exponential Growth Model (EGM) in predicting population figures and Mean Square Error (MSE), Akaike Information Criteria (AIC) and Bayesian Information Criteria (BIC) were used to assess the suitability of the model on population prediction. Different values of shape parameter in the hyperbolic model were assumed to be small, moderate and high with ±0.1, ±0.5 and ±0.9 for Case 1, 2, and 3. HEGM gave the best intercensal estimate for the three cases and was preferred based on the AIC, BIC and MSE results with theta stabilized at ±0.1.
Keywords: Intercensal; Growth models; Hyperbolic growth model; Nigeria population
Abbreviations: HEGM: Hyperbolic Exponential Growth Model, EGM: Exponential Growth Model, MSE: Mean Square Error, AIC: Akaike Information Criteria, BIC: Bayesian Information Criteria
Introduction
In demographics, an intercensal estimate is an estimate of population between official census dates with both census counts being known. Some nations produce regular intercensal estimates while others do not. Intercensal estimates can be less or more informative than official census figures, depending on methodology, completeness, accuracy (as they can have significant undercounts or overestimates) and date of data, and can be released by nations, subnational entities, or other organizations including those not affiliated with governments. Being able to forecast population and even being able to answer some interesting questions about population in the past, depends on developing accurate mathematical models of population growth. Analysis and projection of population are based on population figure as it informs an objective distribution of social amenities by government. Hence, knowledge about past, current and future population are fundamental in every aspect of decision making. In view of this, current projection of this population figures is of great necessity. Ofori et al. [1] applied exponential and logistic growth models to model the population growth of Ghana using data from 1960 to 2011. Dean Hathout [2] modelled population growth using exponential and hyperbolic models. Oyamakin et.al [3,4] compare exponential and hyperbolic growth models in height and diameter increment of Pine (Pinus caribaea).The aim of this study is to investigate the property of Exponential Growth Model (EGM) and Hyperbolic Exponential Growth Model (HEGM) in modeling Nigeria population data and to determine the intercensal estimate, and compare the predictive performance of the two models.
Materials and Methods
Data description
The Nigeria population census figure for the year 1963, 1991 and 2006 were used for intercensal prediction and nonlinear estimation was applied on the data sourced online [5] from 1955-2016 for model validation. Intercensal estimation was observed for three cases using three growth models. Cases 1 was the use of the 1963 population census result as the base year and 1991 population census result as the launch year, case 2 was the use of the 1991 population census result as the base year and 2006 population census result as the launch year and case 3 was the use of the 1963 population census result as the base year and 2006 population census result as the launch year.
Methodology
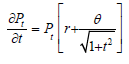
Exponential Growth Model (EGM)Suppose that Pt is the total number of individuals in the population at time (t) such that;
 (1)
(1)
Separating variables, we have that;
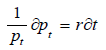 (2)
(2)
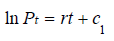
Integrating both sides we have;
 (3)
(3)
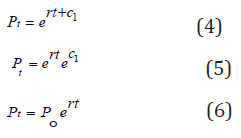
Taking the exponential of both sides we have;
The growth rate will be
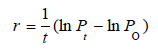 (7)
(7)
Equation (6) is the Exponential Growth Model
Hyperbolic Exponential Growth Model (HEGM) Studies have shown that majority of the growth models emanated from the Malthusian Growth Equation (MGE), which is limited to growing without bounds. This study was designed to develop alternative growth models flexible to enhance internal prediction of population figures based on hyperbolic sine function with bound. Suppose that Pt is the total number of individuals in the population at time (t) such that;
 (8)
(8)
Separating variables, we have that;
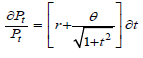 (9)
(9)
Integrating both sides we have;
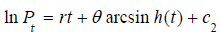 (10)
(10)
Taking the exponential of both sides we have;
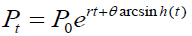 (11)
(11)
The growth rate will be
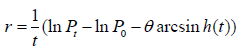 (12)
(12)
Equation (11) is the Hyperbolic Exponential Growth Model
Where P0 is the population value for the base year, Pt is the population value for the target year, is the shape parameter which act as a stabilizing factor and can take both negative and positive value depending on the intrinsic nature of the growth rate.
Discussion
Hyperbolic exponential growth rate was used for intercensal estimation using different values of theta which ranges from small to moderate to high with ±0.1, ±0.5 and ±0.9. Theta can take positive value if the growth rate of a population is low and it can take negative value if the growth rate of a population is high, therefore theta is said to be a stabilizing factor. In Table 1, the growth rate estimate for different cases using Geometry Growth model (GGM), EGM and HEGM. HEGM with theta (0.5) and (0.9) produced negative growth rate for the three cases and the implication of this is that human population is going into extinction. Figure 1-3 suggested that EGM and GGM predicted the same intercensal estimate for the three cases, which prompted us to compare the HEGM with the EGM. Figure 4-6 present the intercensal estimate using HEGM with theta (0.1), (-0.1), (-0.5) and (-0.9) for the three cases. For case 1 and 2, HEGM with theta (0.1) performed best, followed by HEGM with theta (-0.1), theta (-0.5) and theta (-0.9) while for case 3, HEGM with theta (0.1) performed best, followed by HEGM with theta (-0.1) and theta (-0.9). Figure 7 suggested that HEGM with theta (-0.5) does not converge. Figure 8-10 suggested that HEGM with theta (0.1) performed better than EGM in predicting the intercensal estimate for the three cases. Table 2,3 present the result of the nonlinear estimation and the fitted exponential and hyperbolic exponential growth model were = 38.849262e0.025675t and = 41.14675e0.025675t – 0.0215562arcsinh(t) respectively. In Table 4, the hyperbolic exponential growth model was preferred based on the AIC, BIC and MSE results given as -11.8753, -10.18044 and 0.9571 respectively.
Table 1:Growth rates for different cases based on the models

Source: Computed by the authors
* indicates values of the shape parameter that produces negative growth rate
Table 2:Parameter estimation using HEGM

Source: Computed by the authors from data sourced from (www.worldometers.info)
Table 3:Parameter estimation using EGM

Source: Computed by the authors from data sourced from (www.worldometers.info)
Table 4:Selection criteria

Source: Computed by the authors
Figure 1:Intercensal estimate for case 2 using geometry and EGM

Figure 2:Intercensal estimate for case 3 using geometry and EGM

Figure 3:

Figure 4:Intercensal estimate for case 1 using HEGM with (0.1), (-0.1), (-0.5) and (-0.9)

Figure 5:Intercensal estimate for case 2 using HEGM with (0.1), (-0.1), (-0.5) and (-0.9)

Figure 6:Intercensal estimate for case 3 using HEGM with (0.1), (-0.1) and (-0.9)

Figure 7:Intercensal estimate for case 3 using HEGM with (0.1), (-0.1), (-0.5) and (-0.9)

Figure 8:Intercensal estimate for case 1 using EGM and HEGM ( (0.1))

Figure 9:Intercensal estimate for case 2 using EGM and HEGM ( (0.1))

Figure 10:Intercensal estimate for case 3 using EGM and HEGM ( (0.1))

Conclusion
Different values of theta in the hyperbolic model were assumed to be small, moderate and high with ±0.1, ±0.5 and ±0.9 respectively for Case 1, 2, and 3. HEGM gave the best intercensal estimate for the three cases and was preferred based on the AIC, BIC and MSE results with theta stabilized at ±0.1.
References
- Ofori TL, Ephraim, Nyarko F (2013) Mathematical Model of Ghana's Population Growth. International journal of modern management sciences 2(2): 57-66.
- Dean Hathout (2013) Modeling population growth, exponential and hyperbolic modeling. Applied Mathematics 4: 299-304.
- Oyamakin SO, Chukwu AU, Bamiduro TA (2013) On comparison of exponential and hyperbolic exponential growth models in height/diameter increment of PINES (Pinus caribaea). Journal of modern applied statistical methods 12(2).
- worldometers.info
- Sintayehu AM (2016) Mathematical model of ethiopia's population growth. Journal of natural sciences research 6(17): 1015-116.
© 2019 Oyamakin SO. This is an open access article distributed under the terms of the Creative Commons Attribution License , which permits unrestricted use, distribution, and build upon your work non-commercially.
Editor In Chief


.jpg)


Signup for Newsletter

Quick Links
 Editorial Board Registrations
 Submit your Article
 Refer a Friend
 Advertise With Us
Our Recent Edition

.jpg)


Top Editors


.jpg)


.bmp)
.jpg)
.png)
.jpg)


.jpg)


.png)

.png)


.png)


Financial Support

Sponsors

Latest e-Books

Latest Video

 a Creative Commons Attribution 4.0 International License. Based on a work at www.crimsonpublishers.com.
Best viewed in
a Creative Commons Attribution 4.0 International License. Based on a work at www.crimsonpublishers.com.
Best viewed in