- Submissions

Full Text
Biodiversity Online J
Numerical Modelling of Potential Subsea Landslide Generated Tsunami in the Owen Ridge (Arabian Sea)
Sarker MA*
Royal HaskoningDHV, Peterborough, United Kingdom Introduction
*Corresponding author: Sarker MA, Technical Director, Royal HaskoningDHV, Right well House, Peterborough, United Kingdom
Submission: March 01, 2020; Published: September 29, 2021

ISSN 2637-7082Volume2 Issue1
Abstract
Natural hazards such as tsunamis cause significant loss of life and damage to properties, ecosystems and marine structures and facilities. Tsunami modelling results are used for deriving robust design conditions for coastal and marine structures and facilities. The model results are also used for emergency planning and decision-making to estimate potential loss of life, damage to properties and marine facilities and to develop rescue and mitigation measures and plan clean-up operations. Royal HaskoningDHV (hereafter RHDHV) has set up a regional tidal hydrodynamic model covering the Arabian Sea to provide data to address the above issues. The Owen Ridge is a prominent submarine relief located 300 to 400km away from the coast of Oman. Literature search suggests large landslide along the Owen Ridge that could have occurred in the past. Numerical modelling of a potential tsunami from landslide along the Owen Ridge was carried out in the present study. The MIKE21 Flow Model FM developed by DHI was used to simulate this tsunami and sample results from the modelling study are presented in this paper for illustration purposes. Structural design considerations and tsunami risk reduction measures are also discussed. The model could be used to simulate any tsunami generated within the Arabian Sea. The methodology described in this paper for modelling the tsunami in the Owen Ridge could also be applied to simulate this type of events at other sites around the world.
Keywords: Tsunami; Owen ridge; Natural hazards; Earthquakes; Seismicity; Landslide; Numerical modelling; Arabian sea; Port development; RHDHV
Introduction
The Owen Fracture Zone (OFZ) is a transform fault in the northwest Indian Ocean that separates the Arabian and African Plates from the Indian Plate. It starts at the meeting point of the Carlsberg Ridge and the Sheba Ridge at south and goes north-northeast to the Makran Subduction Zone in the north [1]. Slip rate along the Owen Fracture Zone is at 2mm per year (the slowest rate on Earth) [2]. Owen Fracture Zone is named after HMS Owen that identified the ‘fracture line’ in April/May 1963 [3]. The Owen Fracture Zone and the Dalrymple Trough north of it (named after HMS Dalrymple surveyed the area together with HMS Owen) form the modern boundary between the Arabian and Indian Plates [4]. The 800km long the Owen Fracture Zone runs along the Owen Ridge which is divided into two segments. The Southern Owen Ridge, 300km long and 50km wide, is a near-linear structure that drops steeply 2,000m on its eastern side. The Central Owen ridge, 220km long and 50km wide, in contrast, is more uneven and reaches a maximum height of 1,700m. The Qalhat Seamount and Murray Ridge are located at the northern end of the Owen Fracture Zone [5]. All the above information was obtained from [6].
The Owen Ridge is a prominent submarine relief located 300 to 400km away from the coast of Oman. It is mentioned that a number of mass failures have been mapped in detail along the ridge. Although the slide mass could be considerably large (up to ~45km3) and when occur they may cause large tsunamis but the recurrence interval of such an event is estimated as in the order of 105-106 years [7]. Nevertheless, there is a significant risk from subsea landslide generated tsunami along the Owen Ridge.
The potential hazard of the slide event to Oman was assessed by Rodriguez M et al. [8] through numerical simulations of tsunami generation and propagation from one of the biggest landslides (40km3 in volume and 140m layer thickness at initial stage). The slide event was modelled by Rodriguez M et al. [8] using a separate model that treated the slide as a viscous fluid with its own velocity with dynamic viscosity (i.e., visco-plastic fluid or also called a Bingham plastic fluid) without including the slide mechanism. This modelling approach or an approach that includes the generation mechanism of the slide requires a complex modelling tool which is beyond the scope of the present study. The aim of the present study is to introduce the slide in a numerical model as initial condition resembling the tsunami signal after t=10 minutes in the simulation performed by Rodriguez M et al. [8]. After forming an initial amplitude of ~5m, after 10 minutes an outward radiating wave from its origin (17.33330N, 60.00E) is observed with two peaks and troughs. The water ahead of slide direction is pushed away, creating a leading positive wave in the slide direction towards the Oman coast. The wave height after 10 minutes is estimated to be ~2m and the trough approximately -1.5m. After some testing with the orientation of the initial wave pattern the best result for the central Omani coastline is adopted for the simulation (mimicking a slide direction of 280 degrees north). Given the relatively large wavelength (L), at initial stage (~200km), this wave can be considered as a long wave and its propagation can be modelled with software that is used in the present study.
Setting up a large tidal hydrodynamic model is essential to simulate propagation of a tsunami. Royal Haskoning DHV has set up a regional tidal hydrodynamic model covering the Arabian Sea to support their work in the region. The model has been used on several occasions to assess tsunamis within this region.
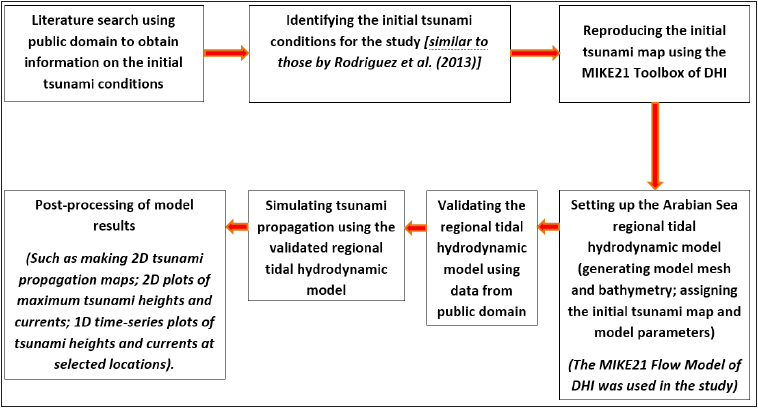
The MIKE21 Flow Model FM developed by Danish Hydraulic Institute [9] has been used in the present study. The initial tsunami waves for a potential tsunami from landslide along the Owen Ridge were generated based on the work by [8]. Sample results of tsunami levels and arrival time from the modelling study are presented in this paper for illustration purposes. Structural design considerations and tsunami risk reduction measures (including mudslides and landslides) are also discussed. The model could be used to simulate the passage of a tsunami anywhere within the Arabian Sea. The methodology described in this paper for modelling the tsunami generated at the Owen Ridge could also be applied to simulate this type of events at other sites around the world. The flowchart in Figure 1; [10] illustrates the steps and the software used in the present study.
Figure 1: Steps and software used in the tsunami modelling study [10].
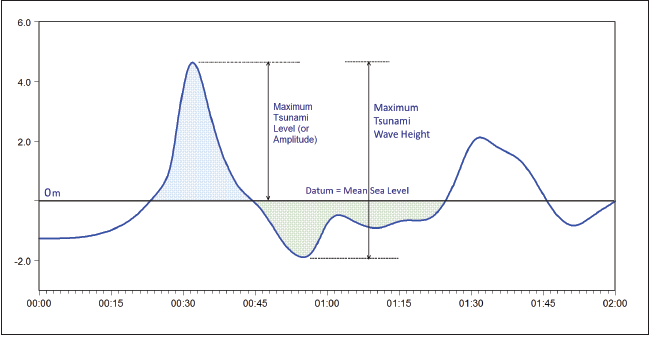
The general definition of tsunami level and wave height is illustrated in Figure 2; [11]. A tsunami wave height refers to the vertical distance from trough to peak of a tsunami wave. A tsunami level (also called amplitude) is referred to the height of the water column above the datum. Usually Mean Sea Level (MSL) or Chart Datum (CD) are used as datum in tsunami modelling. Chart Datum was used in the present study and, therefore, any tsunami level (or tsunami amplitude) in this paper refers to a level above/below the Chart Datum.
Figure 2: General definition of tsunami level and tsunami wave height [11].
Regional Tidal Model Set Up by Royal Haskoning- DHV
Royal HaskoningDHV has set up a two-dimensional Regional Tidal Hydrodynamic Model for the Arabian Sea using the MIKE21 Flow Model FM software of Danish Hydraulic Institute [9]. The model is based on the numerical solution of the two/threedimensional shallow water incompressible Reynolds averaged Navier-Stokes equations invoking the assumptions of Boussinesq and of hydrostatic pressure. Thus, the model consists of continuity, momentum, temperature, salinity and density equations.
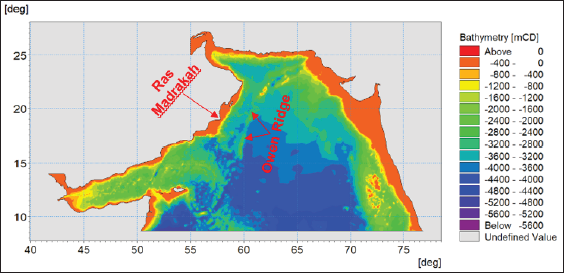
The regional model covers the coastlines of six countries i.e., Yemen, Oman, UAE, Iran, Pakistan and India (Figure 3). An unstructured flexible (triangular) mesh (with variable cell sizes) was used in the study which allowed use of fine mesh at shallow areas where changes in physical processes occur quickly and over shorter distances. It also allowed to use fine mesh size at areas of importance (such as areas close to the tsunami source). The model bathymetry (Figure 3) was obtained from the C-Map Global Database [12]. This regional tidal model was used in the study to simulate the tsunami propagation. The order of the numerical schemes that are used in the numerical calculations for time integration and for space discretization can be specified in the MIKE21 Flow Model to control the simulation time and accuracy. A lower order scheme (first order) is faster but less accurate whereas a higher order scheme is slower but in general produces results that are significantly more accurate than the lower order scheme. Therefore, the higher order numerical scheme was used in the study for both time integration and space discretization.
Figure 3: The regional model domain and bathymetry.
“Flooding and Drying” were included in the model for treatment of the moving boundaries (flooding and drying fronts). Barotropic density and the Smagorinsky formulation for eddy viscosity were used in the model. Bed resistance was included in the model in the form of Manning’s number. Varying Coriolis forces were applied to the model.
Model mesh and bathymetry
A flexible (triangular) mesh was used with variable mesh size distribution to obtain accuracy in the model results. Attention was given to the shallow areas particularly around the Owen Ridge. Typically, 20-30 grids (ideally 40 grids) per wavelength are required to correctly resolve the physical processes of tsunami propagation. Shallower waters have shorter wave lengths. Therefore, smaller grid sizes are required for shallower waters.
The mesh size distribution was generally as below:
a) 50m grid size at 1m depth
b) 150m grid size at 10m depth
c) 500m grid size at 100m depth
d) 1500m grid size at 1000m depth
e) 3000m grid size for the remaining deeper areas
The bathymetry of the model domain was obtained from the C-Map Database [12]. Figure 3 shows the model domain and bathymetry.
Model parameters
Some other major model parameters are given below:
a) Minimum time step=0.01s
b) Maximum time step=15s
c) Critical Courant-Frie¬drich-Lévy (CFL) number=0.8
d) Run duration=3 hours
e) Higher order numerical scheme used
f) Coriolis force=varying in domain
The MIKE21 Flow Model uses a variable time step between the minimum and maximum time steps assigned in the model.
The time step interval must be selected so that the CFL number is less than 1 in order to secure the stability of the numerical scheme using an explicit scheme in the MIKE21 Flow Model. However, the calculation of the CFL number is only an estimate and, therefore, a reduced value of 0.8 was assigned in the model.
Initial tsunami levels
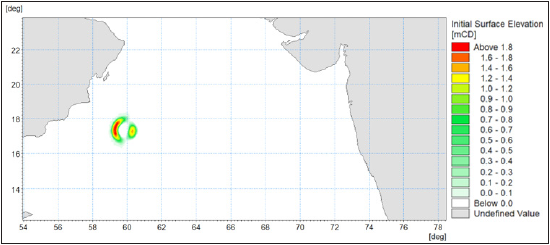
The seabed landslide after t=10 minutes in the simulation performed by Rodriguez M et al. [8] was reproduced in the study. The initial rise in sea surface due to the seabed landslide is illustrated in Figure 4. The maximum rise in sea surface is 1.9m.
Model validation
Tsunami levels and arrival times were extracted from the model results at Ras Madrakah headland and at the Masirah Bay (between Ras Madrakah and Masirah Island). These results are compared with those from [8] in Table 1. A good agreement was found both in tsunami levels and travel time. Therefore, it is concluded that the present model can predict the tsunami levels and arrival time anywhere within the model domain with an acceptable level of confidence.
Figure 4: Initial tsunami levels.
Model Results and Discussion
The propagation of tsunami waves over time was extracted from the model results as shown in Figure 5. The model results suggest that the coastlines at central Oman feel the tsunami signals within about half an hour. The nearby islands, headlands and coastlines were worst affected due to its proximity.
Statistical analysis was carried out using MIKE21 Toolbox [13] to derive maximum tsunami levels over the entire model domain during the full duration of the tsunami as shown in Figure 6. The central Omani coastline was affected the most with the maximum value of about 1.5m at Ras Madrakah (Figure 7). The location of Ras Madrakah is shown in Figure 3. It takes about two hours for the tsunami to calm down as illustrated by Figure 7.
Maximum current speeds were also extracted from the model results and are shown in Figure 8. Higher currents were found at Ras Madrakah and its neighborhoods at north and south. The maximum current speed at Ras Madrakah was about 1.2m/s (Figure 9). Localized current speeds of up to 2.3m/s were found within bay north of Ras Madrakah. It should be noted that the values of the tsunami levels and current speeds and areas affected will vary depending on the landslide location. The above values are an approximation for the location of the landslide shown in Figure 4.
Figure 5(a): Propagation of tsunami waves over time tsunami waves at t=0 minutes.
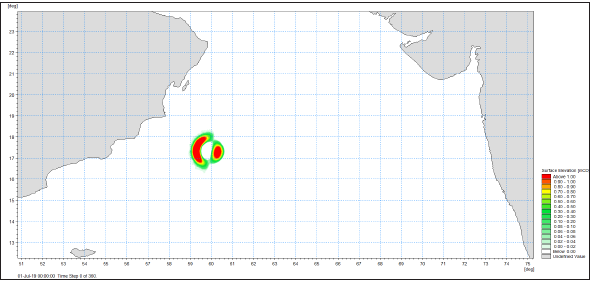
Figure 5(b): Propagation of tsunami waves over time tsunami waves at t=15 minutes.

Figure 5(c): Propagation of tsunami waves over time tsunami waves at t=30 minutes.
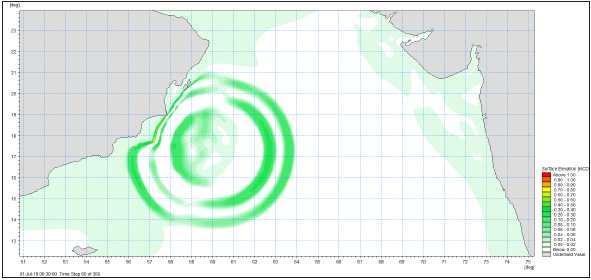
Figure 5(d): Propagation of tsunami waves over time tsunami waves at t=45 minutes.
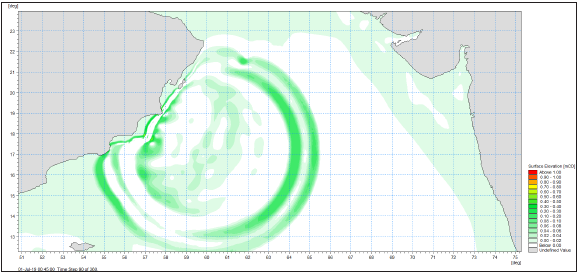
Figure 5(e): Propagation of tsunami waves over time tsunami waves at t=60 minutes.
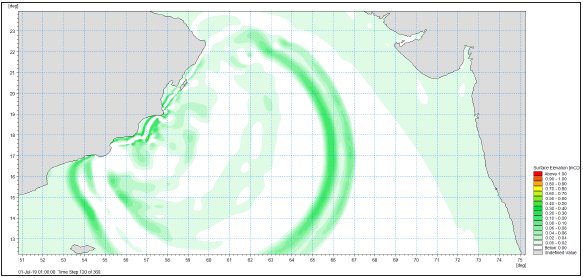
Figure 5(f): Propagation of tsunami waves over time tsunami waves at t=90 minutes.

Figure 6: Maximum tsunami levels.

Figure 7: Time-series of tsunami levels at Ras Madrakah.
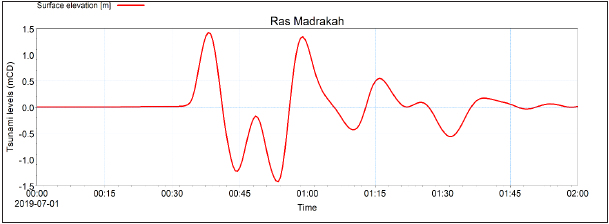
Figure 8: Maximum tsunami current speeds.

Figure 9: Time-series of tsunami current speeds at Ras Madrakah.
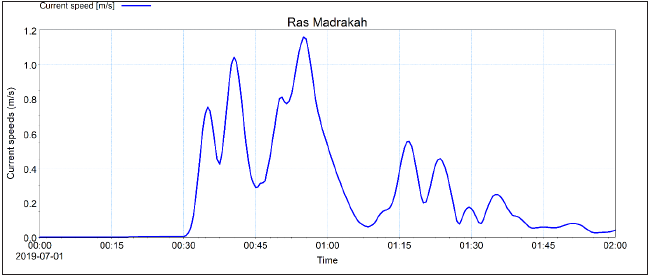
The model showed rapid rise in sea level and then receding it leaving a drying beach and foreshore. In contrast, for an earthquake generated tsunami, the sea level recedes first followed by a rapid rise in sea level. A relatively higher rise in sea surface elevation was found in the shallower water depths. Rise in water level at shallow waters is higher than that in deeper waters as expected due to shoaling effects.
Application of Modelling Results
The results from the tsunami model provide valuable information at all stages of a project including planning, design, environmental impact assessment, construction, operation, and de-commissioning. The model results can also be used in emergency planning and decision-making to estimate potential loss of life, damage to properties and marine facilities and to develop mitigation measures and plan clean-up operations.
The tsunami model is a key tool for deriving robust design conditions for coastal and marine structures and facilities. The models can also provide input conditions to scale physical models for testing structural stability and overtopping rates and input to coastal flood studies.
Uncertainties in modelling results
An unstructured flexible mesh was used in the model which fits better with a curved coastline. It also allowed smaller grids in the areas of higher importance to obtain better accuracy in model results. A variable mesh size distribution as required was maintained with smooth transition between two mesh sizes to obtain accuracy in model results.
Bathymetry is a major input parameter to the model which was obtained from the C-Map Database. The accuracy of this data is the same as if extracted directly from Admiralty Chart data at the various scales available. Admiralty Chart data is based on surveys carried out in the past and some changes in the seabed particularly at shallow waters are expected over time. Therefore, there are uncertainties in model results in shallow waters due to expected seabed changes over time. However, the model results were extracted at relatively deep waters and hence no major effect of discrepancy in bathymetry data is expected. On the tidal modelling, it is important that the regional circulations are understood so that these are captured within the model. Including the effect of the Coriolis force into a tidal model is also important.
A numerical model is developed based on various assumptions. Although the MIKE21 Flow Model developer (DHI) carried out calibration and validation as part of the development process, local site-specific calibration and validation are required before applying the model. Good quality measured data are required for model calibration and validation. Potential tsunami due to an assumed landslide along the Owen Ridge in future was modelled in the present study and, therefore, there was no measured data available in the literature. Hence the model in the present study was validated using numerical model prediction obtained from published literature. Model results presented in this paper are for illustration purposes only. These should not be used for any practical project work for which use of local survey bathymetry data and detailed local calibration are essential. Although there are various uncertainties, numerical models are considered useful tools by researchers and practitioners globally.
Recommended Design Considerations
The potential impact of a tsunami event on the design of coastal and marine facilities may be summarised as follows:
1. Shoaling results in an increase in water levels and stronger currents inshore and the measures will be required to protect structures from scouring of the foreshore and seabed and limit damage to the crest if heavy overtopping occurs.
2. The foreshore will be subjected to flooding as the tsunami waves and surge approach; and
3. Facilities located on the landward slope are at risk from tsunami wave run-up and surge.
Tsunami risk reduction measures
Damage due to a tsunami depends on its strength and proximity as well as local bathymetry and topography and location of people, structures and facilities. It is almost impossible to fully protect people and settlements from major tsunami events. However, various soft and hard measures (independently or in combination) could be adopted to reduce fatalities and damage to key infrastructure.
Some potential measures to reduce the risk of fatalities and damage from major tsunami events are highlighted below:
1. Detection, early warning systems and real-time observation systems are of great importance to save lives and reduce damage.
2. Appropriate awareness and understanding among the general public will reduce death toll.
3. Mitigation plans and evacuation and rescue preparedness by responsible authorities will reduce damage and death toll.
4. Tsunami risk assessment, flood risk and inundation hazard maps.
5. Tsunami shelters are of great use for people to flee.
6. Developing artificial forest such as mangroves and casuarinas of appropriate width behind the shoreline will reduce tsunami wave energy.
7. Maintaining natural sand dunes.
8. Regulations for development in the coastal zone.
9. Saline embankments to prevent salt-water entering fertile lands.
10. Raising ground levels of important structures and facilities such as warehouses, terminals and quays will reduce risk to these being flooded; and
11. Constructing tsunami defence structures such seawalls, dykes, gates, nearshore breakwaters and offshore barriers will reduce risk and damage. However, these structures are huge and are very expensive.
For major coastal infrastructure, the adoption of appropriate design parameters, a proper assessment of structural loads, forces and stability in combination with a detailed understanding of tsunami processes will reduce the level of damage resulting from these events. Furthermore, physical modelling of major coastal and marine structures and mooring systems to investigate their stability under severe conditions will be helpful to reduce damage due to tsunamis.
Risk reduction from mudslides and landslides
High tides during a tsunami may cause floods and submergence of low-lying areas and can lead to mudslides and landslides in mountainous areas causing loss of life and property. Landslides and mudslides are downhill earth movements that can move slowly and cause damage gradually. These can also move rapidly destroying property and taking lives suddenly and unexpectedly. They typically carry heavy debris like trees and boulders which can cause severe damage along with injury or death. Faster movement of mudslides makes these deadly.
There is nothing one can do to prevent a mudslide or a landslide. However, one can always be prepared and take necessary steps to lessen the impact of a mudslide or prevent one altogether. Some guidelines are briefly mentioned below:
1. Carrying out risk assessment.
2. Creating public awareness and practicing an evacuation plan.
3. Staying up to date on warnings during times of increased risk.
4. Watching for any visible signs such as cracks on land, debris flows or trees tilting or boulders knocking.
5. Staying alert and awake.
6. Moving out of the path of the landslide or debris flow; and
7. Some erosion control measures might be helpful (such as installing barrier walls, improving drainage system and planting trees with deep and extensive root systems).
Summary of Findings
Numerical modelling of the tsunami generated by a potential landslide along the Owen Ridge was carried out in this study. This paper illustrates how a tidal hydrodynamic model can be used to simulate the impacts of a tsunami on coastal developments, facilities and communities.
Findings from the tsunami modelling study are summarised below:
a. The coastlines at central Oman feel the tsunami signals within about half an hour. The nearby islands, headlands and coastlines were worst affected due to its proximity.
b. Ras Madrakah was severely affected due to its close proximity with a tsunami level of up to 1.5m.
c. Maximum current speed at Ras Madrakah was about 1.2m/s. Stronger currents of up to 2.3m/s were found at bay north of Ras Madrakah.
d. The model showed rapid rise in sea level and then receding it leaving a drying beach and foreshore. In contrast, for an earthquake generated tsunami, the sea level recedes first followed by a rapid rise in sea level.
e. A relatively higher rise in sea surface elevation was found in the shallower water depths. Rise in water level at shallow waters is higher than that in deeper waters as expected due to shoaling effects.
It should be noted that the values of the tsunami levels and current speeds and areas affected will vary depending on the landslide location. The methodology described in this paper for modelling the landslide tsunami along the Owen Ridge could also be applied to other sites around the world that are affected by this type of events.
Acknowledgement
The author would like to thank Royal HaskoningDHV (an independent, international engineering and project management consultancy company, www.royalhaskoningdhv.com) for giving permission to publish this paper. Special thanks to Mr. Alec Sleigh (Technical Director, Maritime Sector of Royal HaskoningDHV UK) who carried out an internal review of the paper. The author would like to thank his colleague Debra Griffin for carrying out the proof reading of the manuscript. The author would also like to thank the external reviewer(s) who provided valuable comments to improve the paper.
References
- Bird D (2001) Shear margins: Continent-ocean transform and fracture zone boundaries. The Leading Edge 20(2): 150-159.
- Fournier M, Chamot N, Rodriguez M, Huchon P, Petit C, et al. (2011) Owen fracture zone: The Arabia-India plate boundary unveiled. Earth and Planetary Science Letters 302(1-2): 247-252.
- Smith G (2012) HMS Owen, British survey ship, post-WW2. Naval History.
- Fournier M, Petit C, Chamot N, Fabbri O, Huchon P, et al. (2008) Do ridge-ridge-fault triple junctions exist on earth? Evidence from the Aden-Owen-Carlsberg junction in the NW Indian Ocean. Basin Research 20(4): 575-590.
- Rodriguez M, Chamot N, Huchon P, Fournier M, Delescluse M (2014) The Owen ridge uplift in the Arabian Sea: implications for the sedimentary record of Indian monsoon in late Miocene. Earth and Planetary Science Letters 394: 1-12.
- https://en.wikipedia.org/wiki/Owen_Fracture_Zone
- Rodriguez M, Fournier M, Chamot N, Huchon P, Zaragosi S, et al. (2012) Mass wasting processes along the Owen ridge (Northwest Indian Ocean). Marine Geology pp. 1-59.
- Rodriguez M, Chamot N, Hebert H, Fournier M, Huchon M (2013) Owen ridge deep-water submarine landslides: Implications for tsunami hazard along the Oman coast. Nat Hazards Earth Syst Science 13: 417-424.
- https://manuals.mikepoweredbydhi.help/2017/MIKE_21.htm
- Sarker MA (2018) Numerical modelling of tsunami in the Makran subduction zone-A case study on the 1945 event. Journal of Operational Oceanography 2(Sup2): S212-S229.
- Sarker MA (2019) Numerical modelling of the 2004 Indian Ocean tsunami by Royal HaskoningDHV. International Journal of Innovative Studies in Sciences and Engineering Technology (IJISSET) 5(7): 93-109.
- https://ww2.jeppesen.com/
- https://manuals.mikepoweredbydhi.help/2017/Coast_and_Sea/M21Toolbox.pdf
© 2021 Sarker MA. This is an open access article distributed under the terms of the Creative Commons Attribution License , which permits unrestricted use, distribution, and build upon your work non-commercially.
 a Creative Commons Attribution 4.0 International License. Based on a work at www.crimsonpublishers.com.
Best viewed in


.jpg)


 Editorial Board Registrations
 Submit your Article
 Refer a Friend
 Advertise With Us
.jpg)


.jpg)


.bmp)
.jpg)
.png)
.jpg)


.jpg)


.png)

.png)


.png)


