- Submissions

Full Text
Biodiversity Online J
Biodiversity Conservation: Measures of Forest Tree Species Composition and Distribution in a Relic Forest
Egbuche Christian Toochi1*, Nwaigbo LC2, Umuorjiakor AO1 and Alimonu DI1
1Department of Forestry and Wildlife Technology, School of Agriculture and Agricultural Technology, Nigeria
2Faculty of Agriculture, Abia State University, Nigeria
*Corresponding author: Egbuche Christian Toochi, Department of Forestry and Wildlife Technology, School of Agriculture and Agricultural Technology, Owerri, Imo State, Nigeria
Submission: July 20, 2021; Published: July 28, 2021

ISSN 2637-7082Volume1 Issue5
Abstract
The determination of tree species composition, relative density and distribution (richness and diversity) of a forest reserve in Southeastern Nigeria formed the basis of this research. A sample plot measuring 1.5 hectare (150x100)m2 was outlined and divided into four components within the forest reserve. A total of 151 tree count was recorded in the reserve area: belonging to nine different tree species. They were distributed in nine genera and of seven (7) families. Considering species richness, Verbenceae and Rubiaceae family had the highest number of 2 species in 2 genera, while five (5) other families had one (1) specie each. Tectona grandis species had the highest relative density and dominance (35.10% and 35.59% respectively). Gmelina arbozea (27.81% and 27.95%); while Elaesis guineesis and Mitragyna ciliate shared relative density of 3.311% and 3.974% respectively. The least specie was Pinus caribea have relative density and abundance of 1.987% and 2.2%. Generally, the forest location had immoderate diversity as a result of excessive exploitation and there is need to restrict forest exploitation thereby allowing forest full regeneration. This restriction policy is hereby advocated and projected to enhance the soil fertility and retention for full regeneration of forest species.
Keywords: Global change ecology; Tree species composition; Relic forest; Biodiversity conservation; Species; Composition; Distribution and abundance
Introduction
Tropical rainforests are composed of myriad of species that are beneficial to man and other life forms directly or indirectly. Conservation awareness and plant ecosystem management has been an important aspect of biodiversity conservation as supported by [1]. Some direct benefits include food, medicine, timber, forest products are obtained directly from the forest. Some indirect ecosystem benefits of forest biodiversity include protection of watershed and habitats of flora/fauna, cycling of soil materials, carbon repatriation and regulation of microclimate. Diversity functions those natural systems adapt, evolve and thrive. Biodiversity can be seen to be synonymous with ecosystem health, however, diverse ecosystem does increased stability, productivity, resistance to invasion and other disturbances. [2] on scale and species richness and [3] are key supports in the importance of this investigation. Vegetation analysis and tree population structure of tropical wet evergreen forests become an important aspect of tree biodiversity conservation and approach which [4] documented in their research in India. Generally, biodiversity is considered to exist at three levels: genetics, species and ecosystems. The three levels are defined where genetic diversity means the total number of genetic characteristics in the genetic make of specie; whereby genetic diversity allows specie to adapt to changing environments.
The aim of diversity is to ensure that some species survive
adverse or drastic changes and thus exists along their desirable
genes. This helps the survival of individuals to ensure the survival
of their population. Species diversity is defined as a ratio of one
specie population over total number of organisms across all species
in the given biome. In its sense, “zero” Rayers to “infinite” diversity
and “one” represents single specie present. Ecosystem diversity
refers to the diversity of a place at the level of ecosystems. The
earth as a biosphere and the variation of ecosystem within the
earth’s biosphere is considered a measure of ecosystem diversity.
Generally, biodiversity is measured by two major components.
The components are species richness and species evenness.
Species richness simply measures the total number of species in an
ecosystem. While species evenness gauges the proportion of species
at a given site and it simply refers that low evenness indicates that
a few species dominate a particular site.
Considering the global impacts of climate change and global
ecology, there are specific locations and sites identified with
enormous species diversity which has been observed to be under
threat over the globe. The threatening as a result of human activities
is known as Biodiversity hotspot. Gomez A et al. [5] identified the
idea of Hotspot under two criteria of a) Endemic, meaning an
area must contain at least 0.5% or 1.500 species of plants that is
predominant in the specific area. This endemic area is expected
to host at least 70% of the location primary vegetation. Globally, it
has been documented that at least 25 areas around the world meet
these criteria/qualifications; they thereby support nearly 60% of
the earth plant, bird, mammal, reptile and amphibian species that
has a very high endemic species. However, [6] considers b) The
intense human activities as Hotspot thereby presenting unique
species under threat from human impacts around the world.
The 1992, UNCE created (CBD) Convention on Biodiversity
where 192 nations including the EU made committed and significant
effort to reduce biodiversity loss targeting 2010. The benefits of a
health diversity support various components of ecosystem services
such as protection of water resources, soil formation, protection,
nutrient storage/recycling, contribution to climate stability and
other biological services and biological resources. Biodiversity loss
has continued to increase at recent years due to habitat loss and
degeneration, climate change and over-exploitation, unsustainable
use and invasive species. Generally, species composition and
distribution of plant species are influenced by biodiversity loss,
climate change and global change ecology. These factors have
forced species to migrate, extinct and adapt. In this case, there is
need for species conservation and reintroduction as a top priority
for global conservation.
Biodiversity Inventories
Forest produces and diversity are considered to be used at a
sustainable level that enhances the benefits of forest ecosystem.
Forest management operations and biodiversity inventories are
used to determine the nature and distribution of biodiversity in
any managed region. It becomes necessary to conduct long term
empirical data on vegetation changes that eventually determine
species composition and distribution in a forest community (natural
forest) is generally scarce for relic forest such as the study location
in Ohaji/Egbema in Imo state, Southeast Nigeria. In this case,
efficient management plans is needed to enhance forest inventory
data collection. Liu H et al. [7] is in support that biodiversity is
essential for human survival and economic well-being and for the
ecosystem function and stability. Anthropogenic activities result to
destruction of the forest reserve at the study site while many kinds
of environmental changes influence or determine processes that
impact distribution of species while these disturbances have been
considered as important factor in structuring communities [8].
Plant species diversity/composition is an important aspect that
provides resources and habitat for many arboreal species [9]. In
general terms, biodiversity promotes a balanced ecosystem, which is
accounted one in which living species co-exist for nocturnal benefit.
It is anticipated that the study site has lost about 370,000 species
of seedlings which is as a result of rural community encroachment
and the government lack of policy to control the rural population.
However, some plants species were observed to be of medical
value while some tree species within the forest reserve have gone
extinct of indiscriminate logging. The justification is on the fact
that for effective forest plantation management, it is paramount to
understudy plant species composition and distribution for forest
resources sustainability. However, the study objective measures
and determines species composition/abundance as well as,
assesses the tree (plant) distribution in a relic forest. In this regard,
it is recommended that effective forest policy covering plantation
encroachment must be put in place.
Study Area
The study is conducted in Ohaji Egbema forest reserve now relic, that is to say the forest is surviving from an earlier time of disturbance. The forest is located at the outskirts of Owerri-the capital of Imo state, Southeast Nigeria. It is on the latitude 50 290N and 70 20E of the equator with an elevation of 45m and it is bounded by Egbema community. The average annual rainfall in the area is 1550.5mm with a relative humidity, though the vegetation in the area is dense and canopies appear close while there are varied plant association with variable species.
Forest inventory and data collection
The major forest inventory conducted was to understand the forest species composition (diversity), distribution and estimation of the available stock in the woodland. Myers N [10] on a tribute to Claude Shennon (1916-2001) and a plea for rigorous use of species richness, species diversity and Shannon-Wiener’ index is considered here as a strong field background while this study considers the disturbance and relic nature of the reserve. This study was concentrated on the vegetation by considering tree species that are less than 10cm trunk diameter. The forest inventory here means the procedure for obtaining on the quantity and quality of the resources and other characteristics of the land in which the trees are growing. A reconnaissance survey of the study was conducted to establish physical and current state of the area and to determine variations between vegetative cover, indicators of human disturbances such as cutting of trees for logging and poles.
Sampling Procedure
The area is estimated to cover 986 hectares, and for effective evaluation, a fraction of 1.5 hectares was taken for the sampling study. The physical condition compelled the site assessment to consider the variations inconsistencies in the vegetation composition of the forest reserve due to the intensity of human disturbances. To this, a sample of 150mx100m (1.5 hectares) was selected and divided into four distinct plots and used for the forest inventory of the site. The field application was based on the following parameters that was estimated and recorded in all sample plot and individual sample plots:
a) Consideration of family, species and frequency of trees encountered in the sample plot
b) Number of trees within all plots and single sample plots
c) Percentage composition of species within all plots and individual plots
d) Relative abundance/diversity (%) of species in the entire sample plot and single sample plots.
Field Data Analysis
In simple application of acquired field data, various data results were presented using descriptive statistics in form of tables, charts and figures (Table 1). The field data was based on
Table 1: Composition of forest tree species, considering families and species frequency in the forest reserve of 1.5 hectares.
Species richness=0.7324
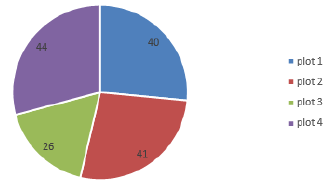
Verifiable forest tree stands in each sample plot
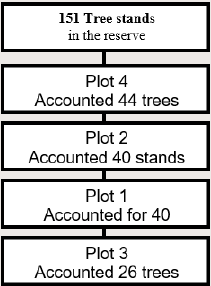
Total number of tree stands in plot 1=40
Total number of tree stands in sample plot 2=41
Total number of tree stands in sample plot 3=26
Total number of tree stands in sample plot 4=44.

a) Species Relative Density (SRD) which is the number of individual species and determined by the formulae:

(%) = × 100 and defined
where,
n=Number of individual species
N=Total number of species in the entire forest community
b) Species Relative Dominance (RDo) was computed using:

Where,
n=Number of individual trees belonging to a given species
N=Number of all species in the sampling unit
c) Species Richness or Variety Index
d) that is determined by Myers N [11]
 as defined
where S = Number of species N = Number of individuals of all
species.
Relative Density of Individual species observed in the entire
sample plot of 1.5 hectares using  while number
of species in the entire sample plot is 151 (Figure 1).
Figure 1: Verifiable forest tree stands in each sample plot.
Discussion
Tree species composition and distribution: an effective tool for forest biodiversity management Effective plant diversity conservation requires periodic and sound environmental management of vegetation ecosystem and spatial assessment of species distributions. Forest plantation plays specific roles and forest reserve is mostly kept and reserved, protected or saved by policy for either future use or special biodiversity purposes. These were established to conserve habitats in its natural state, conserved for scientific research and education purposes or being protected from vulnerable or endangered species or for natural landscapes which aims at protection and maintenance of biological diversity using natural and associated cultural and policy resources of legal or other effective means [12]. Generally, IUCN describes natural forest as a forest where human impact has not surpassed the impact of other indigenous species and may not have affected the ecosystem structure [13] documented that there are 445 gazetted forest reserve located in different parts of Nigeria while 137 accounted to the bulk of the Nation’s natural forest wealth (Tables 2-4).
Table 2: Determination of percentage of species.
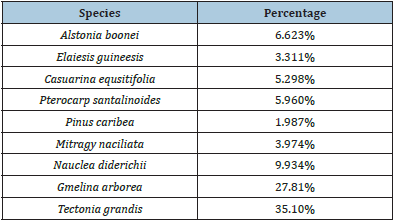
Table 3: Evaluation of species relative density covering the entire sample plot (1.5 hectares).
Ab, Eg, Ce, Ps, Pc, Mc, Nd, Ga, Tg = 99.997.
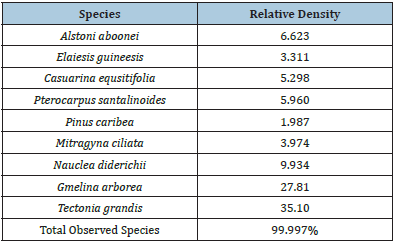
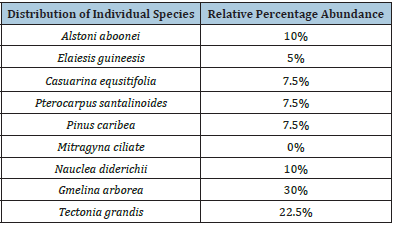
Table 4: Relative percentage abundance (%) distribution of individual species (Assessment of specific tree stands in a sample plot 1=40 stands using).
However, out of 60 vegetation species currently considered commercially important, 35 species have attracted restriction [14]. On this regard, there is the tendency of overexploitation of the few available commercial species. Considering the nature of the relic site in Ohaji Egbema forest reserve it is evidently identified that the poor attention on conservation and biodiversity sustainability particularly in the tropical forests is a consequence of the threat posed by overexploitation of forest resources leading to depletion of flora and fauna. In the same vein regeneration and forest management supports biodiversity as documented by Shengji P [15] whereby species diversity accounts to the variety of different kinds of organisms that make up the community; thereby refers to the number and distribution of species in a location. Though the study site has been under intensive exploitation, in which defining species richness in the total number of different species in the plant community while relative abundance is the proportion each species represents to the total individuals in a forest community as in Figures 2-4. However, the greater effect on plant species diversity is mostly of the influences of destruction of habitat, greenhouse gas emissions and global warming while other anthropogenic effects liking logging, fuel wood and others are on the increase in the scramble for forest resources. The species composition of 151 tree stands accounted to Nine (9) different tree species in the 150mx100m (1 hectare) in the reserve. It was observed and documented that; Verbenaceae family had the highest number of 2 species in 2 different genera followed by Rubiaceae of 2 species belonging to 2 different genera while others had one (Table 5). These variations may largely be as a result of differences in climatic adaptation as well as edaphic factors that characterize the ecological zone.
Figure 2: Field graphical representation in number by percentages of species richness.

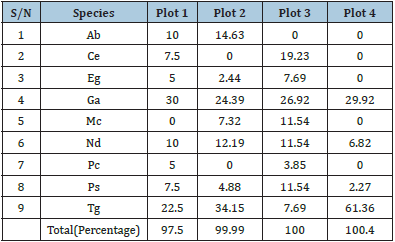
Figure 3: Relative abundance sample calculation of individual species extended to evaluate plot 1, 2, 3 and 4 in percentage spread.

Figure 4: Tree species composition and distribution in classification of stands, genra, families and species 16 families.
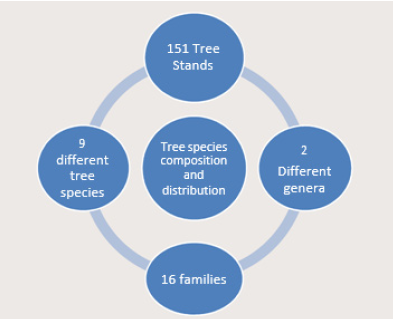
Table 5: Relative abundance simple calculations of individual species extended to evaluate plots 1, 2, 3, and 4 in percentage spread.
Analysis of species composition and distribution
The forest site evaluation identified a total of 151 tree stands among completed plots measuring 150mx100m (1 Hectare). Considering that the ecological variation is virtually same, the field explanation may be as a result of over exploitation of the woody genetic resources as supported [16]. Also, another reason could be as a result of plant habitat destruction whereby survival and tree species among the plots which shows Tectona grandis had the highest relative density (35.99%), Gmelina arborea (27.81%, Naudea diderichii (9.94%). The tree dominance assessment indicated that Alstoni aboonei (6.623%), pterocarpus santalinoides (5.96%), Casuarina equisitifolia (5.29%) Elaeisis guineesis and mitragyna ciliate (5.96%), 5.29%, 3.32% and 3.97% respectively (Figure 5). Pinus caribea was identified most vulnerable tree species which is considered under threat of extinction in the forest reserve which may be influenced by factors of over exploitation, competition and edaphic factors considering distributions of plant species abundance (variations and distributions among individual sample plot, Gmelina arborea recorded 30% richness, Tectonia grandis (22.5%) while Alstoni aboonei and Nauclea diderichii had 10% relative abundance. Casuarine equisitifolia and pterocarpus santalinoides had 7.5% abundance respectively. It was observed that some of the plot recorded no stand of some tree species such as plot one had no mitragyna oiliata casuarinas sequisitifolia had no stand in plot two, also Alstoni aboonei had no stand in plot three. Species diversity and relative abundance could be attributed to intensive logging activities especially used fuel wood and other wood resources in the area. Tectona grandis is observed highly composed and had long exited before the reserve is considered relic.
Figure 5: Accounting of trees among plots covering 151 tree stands in the forest reserve.
Conclusion
The forest reserve is composed of sparsely populated nine tree species. The low plant (tree) species density of stand is a strong evidence of the degree of devastation the forest reserve has been subjected by logging activities and other form of exploitation on non-timber and forest products. It becomes necessary and for urgent attention for the protection of the forest reserves to avoid some species going to extinction and the need to provide requiring time for natural regeneration. The poor canopy and frequent exploitation exposed the soil surface that could be the likely reason for low nutrient status of the forest soils. To this understanding, there is need to develop Integrated Conservation Approach (ICA) that will restore the diminishing potential of the forest reserve, however, not only developing ICA but to effectively implement them and strongly supported in practice by the works of [17,18] that identified biodiversity and conservation as well as conserving plant diversity. Generally, the following recommendations are considered very necessary and priority for the conservation of biological diversity in line and support of [7].
1. Community participation in forest conservation should be encouraged to avoid disputes [19].
2. In this case of the study site, the reserve should be restricted for exploitation for a period of time, this could allow for the forest to fully regenerate while this forest soil will regain its fertility.
3. There is need for alternative energy and affordable to the community, this will reduce the dependence on the forest trees for fuel wood [20].
4. Government should enact laws that reposition the sub sector, to this need employ more manpower with incentives to guard the forests. Furthermore, training and re- training of forest personnel in order to completely address the problem of illegal exploitation and other challenges of the forestry sector.
5. It will be strongly suggested for proper and documented management plan of reserved forest, with clearly stated objectives to forest reserves and strictly adhered.
6. Non-Government Organizations (NGOS) should intervene in the campaign against indiscriminate falling and exploitation of the forest reserved areas.
Conflict of Interest
The authors hereby declare no form of interest either of economic interest or any other form of conflict interest exists.
References
- Condit R, Hubbell SP, Foster RB (1996) Assessing the response of plant functional types in tropical forests to climatic change. J Vegetat Sci 7(3): 405-416.
- Bertness MD, Callaway R (1994) Positive interactions in communities. Trends Ecol Evol 9(5): 191-193.
- Condit R, Hubbell SP, Foster RB (1996) Changes in a tropical forest with a shifting climate, results from a 50 Hectare permanent census plot at barro Colorado island in Panama. J Tropic Ecol 12: 231-256.
- Dawkins HC (1958) The management of natural tropical high forest with special reference to Uganda. Institute Paper, Imperial Forestry Institute, University of Oxford, UK, pp. 34-155.
- Gomez-Pompa A, Burley FW (1991) The management of natural tropical forest, In: Rainforest regeneration and management. UNESCO and Parthenon Publishing Group, Parish, pp. 3-18.
- IUCN (1974) Classification and use of protected natural and cultural areas. IUCN Occasional Paper, pp. 1-24.
- Liu H, Xu Z, Xu Y, Wang J (2002) Practice of conserving plant diversity through traditional beliefs: A case study in Xishuangbanna, Southwest China. Biodiversity and Conservation 11: 705-713.
- Lystar S (1991) Priorities for the conservation of biological diversity: International priorities. Conserving the world’s biological diversity; How can Britain contribute? Proceeding of a seminar by the department of Environment, London, UK, pp. 35-44.
- Nwoboshi LC (1982) Tropical silviculture: Principles and techniques. Ibadan University Press, Nigeria, pp. 333.
- Myers N (1988) Threatened biotas: ‘Hotspots’ in tropical forests. Environmentalist 8(3): 187-208.
- Myers N (1990) The biodiversity challenge: expanded hotspots analysis. Environmentalist 10(4): 243-256.
- Nath PC, Arunachalam A, Khan ML, Arunachalam K, Barbhuiya AR (2005) Vegetation analysis and tree population structure of tropical wet evergreen forests in and around Namdapha national park, Northwest India. Biodiversity and Conservation 14: 2109-2136.
- Padua SM (1994) Conservation awareness through an environmental education program in Atlantic Forest of Brazil. Environmental Conservation 21(2): 145-151.
- Sax DF (2002) Equal diversity in disparate species assemblages: a comparison of native and exotic woodlands in California. Global Ecology and Biogeography 11(1): 49-57.
- Shengji P (2005) Biodiversity in the sacred forests of Xishuangbanna biosphere reserve, China. In: International symposium on conserving cultural and biological diversity: The role of sacred natural sites and cultural landscapes at United Nations. University Tokyo, Japan, pp. 187-193.
- Spellerberg IF, Fedor PJ (2003) A tribute to Claude Shennon (1916-2001) and a plea for rigorous use of species richness, species diversity and Shannon-Wiener’ index. Ecology and Biogeography 12: 117-179.
- Barrow CJ (1992) World atlas of desertification. Land Degradation and Development 3(4): 249.
- Whitehouse JF (1991) East australian rainforest: A case study in resources. Environmental Conservation 18(1): 33-43.
- Whittaker RJ, Wills KJ, Field R (2001) Scale and species richness: Towards a general, hierarchal theory of species diversity. Journal of Biogeography 28(4): 453-470.
- https://wrm.org.uy/
© 2021 Egbuche Christian Toochi. This is an open access article distributed under the terms of the Creative Commons Attribution License , which permits unrestricted use, distribution, and build upon your work non-commercially.
 a Creative Commons Attribution 4.0 International License. Based on a work at www.crimsonpublishers.com.
Best viewed in


.jpg)


 Editorial Board Registrations
 Submit your Article
 Refer a Friend
 Advertise With Us
.jpg)


.jpg)


.bmp)
.jpg)
.png)
.jpg)


.jpg)


.png)

.png)


.png)


