- Submissions

Full Text
Approaches in Poultry, Dairy & Veterinary Sciences
Hyperglycemia Effect on Total Leucocyte Count Determination and Leucocyte Formula in Dog and Cat Blood
Ana Clara Ribeiro1, Ana Cristina Silvestre-Ferreira2,3 and Felisbina Luisa Queiroga2,3*
1School of Life Sciences and Environment, University of Trás-os-Montes and Alto Douro, 5001-801, Vila Real, Portugal
2CECAV, Centre for the Animal and Veterinary Sciences University of Trás-os-Montes and Alto Douro, 5001-801, Vila Real, Portugal
3Associate Laboratory for Animal and Veterinary Sciences (AL4AnimalS), Portugal
*Corresponding author: Felisbina Luisa Queiroga, University of Trás-os-Montes and Alto Douro, Vila Real, Portugal
Submission: June 23, 2022;Published: July 19, 2022

ISSN: 2576-9162 Volume9 Issue2
Abstract
In veterinary medicine the use of fluids supplemented with glucose is a common procedure. Our objective was to evaluate if spurious hyperglycemia can affect the leucocyte cell count (total number and differential count) in dog and cat blood with the ProCyte Dx (IDEXX). Blood samples were collected for EDTA tubes, in a total of 30 samples, previously collected by jugular venopunction, at the Veterinary Teaching Hospital of University of Trás-os-Montes and Alto Douro. The samples were divided into 5 Eppendorf’s of 1.5mL. One of the samples was left in the original status that served as control, 3 of the samples were “contaminated” experimentally adding a 40% glucose solution to achieve a final concentration of 5%, 10% and 20%. The last Eppendorf was left to haemodilution. The samples were left in mechanical agitation approximately 20 minutes at room temperature and were then analysed in the ProCyte Dx (IDEXX). The results of our study demonstrate that spurious hyperglycemia is not the main source of bias in automated leucocyte counting but rather haemodilution, when using the ProCyte Dx (IDEXX). We can conclude that apparently spurious hyperglycemia has no effects in the leucocyte’s parameters.
Keywords:Cat; Dog; Glucose; Hyperglycemia; Leucocyte
Introduction
The pre-analytical phase of a laboratory test corresponds to all activities preceding the analysis. Pre-analytical errors along with analytical errors are common problems that can compromise the test processing quality and consequently the results consistency [1]. Most pre-analytical errors results from procedures performed at sample collection when it is carried out improperly or unstandardized. Additionally, errors can also occur during biological samples handling and preparation [2].
Among the sources of pre-analytical errors, contamination of samples by exogenous fluids such as saline solutions for fluid therapy, therapies with antibiotics, potassium-rich fluids and glycosides are relatively common [3]. Therefore, contamination of the blood sample can lead to diagnostic errors and adverse consequences for the health of patients. Unfortunately, this is a relatively common occurrence, having as consequence the inadequate therapeutic correction of false abnormalities such as hyperglycemia or hyperkalemia, for instance [4,5].
In human medicine, it has been previously demonstrated that the contamination of the blood sample by glucose solutions can generate a significant bias namely in leucocyte count [6]. The underlying causes are probably a combination of glucose-induced effects on leucocyte biology and the different analytical techniques used for leucocyte enumeration and differentiation [7].
In veterinary medicine the use of fluids supplemented with glucose is a common procedure. To the authors’ knowledge, there is no published papers about the effect of spurious hyperglycemia in the leucocyte count in dogs and cats. Therefore, the objective of this work was to evaluate if spurious hyperglycemia can affect the leucocyte cell count (total and differential count) in dog and cat blood with the ProCyte Dx hematological Analyzer (IDEXX).
Materials and Methods
Thirty blood samples selected by chance (20 samples of dogs and 10 of cats) from leftovers sent to Laboratory of Clinical Pathology at the Veterinary of Teaching Hospital of University of Trás-os-Montes and Alto Douro for routine laboratory exams were used. No samples were collected exclusively for this study. Blood was collected for EDTA tubes (FL medical® 1mL) by jugular venopunction. The samples were divided into 5 Eppendorf’s of 1.5mL. One was left in the original status that served as control, 3 were “contaminated” experimentally adding a 40% glucose solution (20g of D - (+) - glucose was weighed and filled up with saline solution until 500mL; Sigma®) to achieve a final concentration of 5%, 10% and 20%, respectively and one other was left for haemodilution control. The samples were in mechanical agitation approximately 20 minutes at room temperature and were then analysed in the ProCyte Dx (IDEXX). The equipment was used according to the manufacturer’s instructions and all samples were analysed within four hours of collection.
Statistical Analyses
Statistical software SPSS 24.0 was used for statistical analysis. ANOVA and Student t tests were used for continuous variables to evaluate the difference between the uncontaminated samples and the contaminated aliquots. Linearity was assessed using linear regression analysis. The normal distribution of the samples was evaluated by the Shapiro-Wilk test and all values were expressed as mean ± standard error of the mean. In all statistical comparisons, P <0.05 was accepted as denoting significant differences.
Results
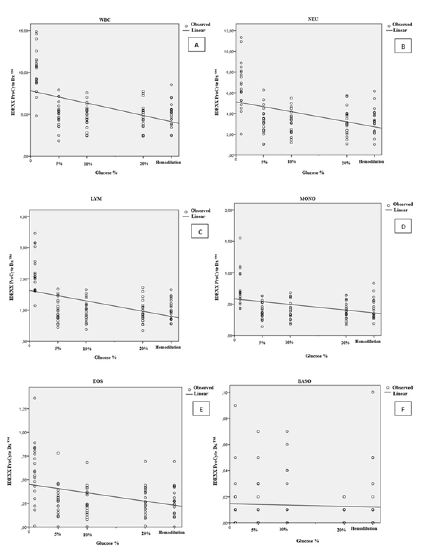
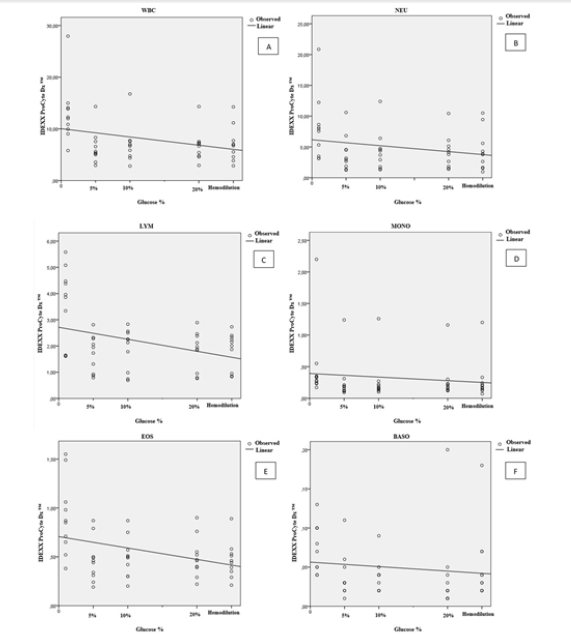
(Figure 1A to 1F) describes the correlation values for leucocyte parameters depending on glucoses concentration and hemodilution. In dogs, the percentage of total leucocyte count (WBC) (r=0.255; p=<0.001), neutrophil (r=0.185; p=<0.001), lymphocyte (r=0.225; p=<0.001), monocyte (r=0.127; p=<0.001), eosinophil (r=0.120 and p=<0.001) and basophil (r=0.002 and p=0.649) decreases significantly comparatively to control group. In cats, WBC (r=0.100 and p=0.025), neutrophil (r=0.053 and p=0.107), lymphocyte (r=0.134 and p=0.009), monocyte (r=0.017 and p=0.368), eosinophil (r=0.128 and p=0.011) and basophil (r=0.0016 and p=0.376) (Figure 2A to 2F) the same tendency was observed.
Figure 1:(A) Percentage variation of white blood cell (WBC), (B) Neutrophil (NEU), (C) Lymphocyte (LYM), (D) Monocyte (MONO), (E) Eosinophil (EOS), (F) Basophil (BASO) counts in samples of dogs contaminated by a glucose standard solution

Figure 2:(A) Percentage variation of white blood cell (WBC), (B) Neutrophil (NEU), (C) Lymphocyte (LYM), (D) Monocyte (MONO), (E) Eosinophil (EOS), (F) Basophil (BASO) counts in samples of cats contaminated by a glucose standard solution.

From present results it is possible to observe a statistical significant difference among all the groups (p<0,01) except for basophils in dogs (Table 1) and monocytes and basophils in cats (Table 2). All the groups (with glucose and hemodilution group) were significantly different from control group. However spurious hyperglycemia groups didn’t show statistical significant difference from hemodilution group. These results were observed both in dogs (Table 1) and cats (Table 2).
Table 1: Effect of spurious contamination of diagnostic blood samples on white blood cell (WBC), neutrophil (NEU), lymphocyte (LYM), monocyte (MONO), eosinophil (EOS), basophil (BASO) (mean ± standard error of the mean) in dogs.

Values with distinct superscript letters in the same line, denote statistical significant differences among them (p<0,01).
Table 2:Effect of spurious contamination of diagnostic blood samples on white blood cell (WBC), neutrophil (NEU), lymphocyte (LYM), monocyte (MONO), eosinophil (EOS), basophil (BASO) (mean ± standard error of the mean) in cats.

Values with distinct superscript letters in the same line, denote statistical significant differences among them (p<0,01).
Discussion
The pre-analytical phase is responsible for about 70% of the errors occurring in the laboratory medicine. In face of that, it is of paramount relevance to highlight the aspects related to patient compliance with previous instructions, such as the need of fasting for a given time before collection, the type of diet, the practice of physical exercise, the use of medications capable of interfering in the analysis and sudden changes in the habits of the daily routine preceding the blood collection [7,8]. Thus, it is noteworthy that the preparation of the sample and the evaluation of the pre-analytical phase become fundamental for obtaining accurate and reliable results, because the way the material is handled is directly related to the quality of the final result [8].
Improper or inaccurate sample collection is a source of problems in diagnostic testing [9], including automated leucocyte counting [10]. Although it was previously shown that spurious hyperglycaemia affects automatic leucocyte counting in human medicine [7], no evidence has been provided that spurious contamination of blood samples with glucose may also generate a significant bias in leucocyte counting in veterinary medicine. Thus, our aim was to investigate the effect of spurious hyperglycaemia in leucocyte count, but we also tested the hemodilution effect because it is well known that hemodilution decreases concentration of cells and solids in the blood resulting from gain of fluid [11].
Our results show statistical differences in most leucocyte parameters when comparing different rich glucose concentration solutions with control group. However, when post hoc tests were performed, there was no statistical difference between spurious glucose rich solutions and hemodilution group. The results of the study of Buonocore et al. [7] demonstrate that a 5% to 20% contamination of whole blood samples with a standard glucose solution (i.e., 25g of glucose monohydrate in 500mL of water) generates a bias in leucocyte enumeration, not only decreasing total WBC count, but also affecting the enumeration of most leucocyte subpopulations. These results agree with our findings, however, Buonocore et al. [7] didn´t investigated the effect of hemodilution when adding glucose to blood samples. This fact prevents us to fully compare our results with the previous ones.
Buonocore et al. [7] affirmed that this may be of greater relevance in patients with hyperglycaemia and bacterial infections, in whom the total WBC count is probably the most important parameter, so that a spurious decrease may affect diagnostic reasoning. The results of our study demonstrate that in blood samples from dog and cat, spurious hyperglycemia is not the main source of bias in automated leucocyte counting but rather hemodilution, when using the ProCyte Dx (IDEXX). Although the results show no influence of glucose rich solution in total WBC or differential leucocyte count, our study demonstrated that haemodilution has a relevant impact, as expected.
Conclusion
In conclusion, our study reveals that apparently, spurious hyperglycemia has no effects in the leucocytes parameters in blood from the species canine or feline and confirms a relevant effect for haemodilution that should also be taken in consideration in clinical practice when evaluating a leucogram.
Acknowledgement
This work was supported by the projects UIDB/ CVT/00772/2020 and LA/P/0059/2020 funded by the Portuguese Foundation for Science and Technology (FCT).
References
- Lippi G, Banfi G, Church S, Cornes M, Carli GD, et al. (2015) Preanalytical quality improvement. In pursuit of harmony, on behalf of European Federation for Clinical Chemistry and Laboratory Medicine (EFLM) Working group for Preanalytical Phase ( WG-PRE ). Clin Chem Lab Med 53(3): 357-370.
- Simundic AM, Lippi G (2012) Responsible writing in science Preanalytical phase-a continuous challenge for laboratory professionals. Biochem Med 22(2): 145-149.
- Anand CV, Anand U, Soundaran V, Aruna V, Gayathri B (2011) Sample contamination in clinical chemistry laboratories. Int J Clin Pract 65(3): 374.
- Gupta KJ, Cook TM (2013) Accidental hypoglycaemia caused by an arterial flush drug error: a case report and contributory causes analysis. Anaesthesia 68(11): 1179-1187.
- Thirugnanam M, French J (2014) Accidental hypoglycaemia caused by an arterial flush drug error. Anaesthesia 69(5): 524-525.
- Lippi G, Becan-McBride K, Behúlová D, Bowen RA, Church S, et al. (2013) Preanalytical quality improvement: In quality we trust. Clinical Chem Lab Med 51(1): 229-241.
- R, Picanza A, Gennari D, Pipitone S, Lippi G (2015) Spurious hyperglycaemia impairs automated leucocyte counting. A pilot study with two different haematological analysers. Blood Transfusion 13(4): 656-661.
- Pegoraro NCC, Gascón TM, Sant’Anna AVL, Moreira APF, Souza AF, et al. (2011) Comparative evaluation of glucose measurements in serum and plasma of patients from the ABC School of Medicine laboratory [Estudo comparativo da glicemia em soro e em plasma de pacientes atendidos pelo laboratório da Faculdade de Medicina do ABC]. Rev Bras Farm 92(1): 9-12.
- Lippi G, Salvagno GL, Montagnana M, Franchini M, Guidi GC (2006) Phlebotomy Issues and Quality Improvement in Results of Laboratory Testing. Clin Lab 52(5-6): 217-230.
- Lippi G, Bassi A, Solero GP, Salvagno GL, Guidi GC (2007) Prevalence and type of preanalytical errors on inpatient samples referred for complete blood count. Clin Lab 53(9-12): 555-556.
- Wegner J (2012) 5-Hemodilution: Physiology and pathophysiology. Minimized Cardiopulmonary Bypass Techniques and Technologies, pp: 62-85.
© 2022 Felisbina Luisa Queiroga. This is an open access article distributed under the terms of the Creative Commons Attribution License , which permits unrestricted use, distribution, and build upon your work non-commercially.
 a Creative Commons Attribution 4.0 International License. Based on a work at www.crimsonpublishers.com.
Best viewed in


.jpg)


 Editorial Board Registrations
 Submit your Article
 Refer a Friend
 Advertise With Us
.jpg)


.jpg)


.bmp)
.jpg)
.png)
.jpg)


.jpg)


.png)

.png)


.png)


