
- About Us
- Information
-

The Author ensures that the research has been conducted responsibly and ethically with adherence to all relevant regulations. read more..
- For Authors
- For Reviewer
- Manuscript Guidelines
- Membership
- Publication Ethics
-
- Journals
- Reprints
- e-Books
- Videos
- Policies
- Contact Us
 COVID-19
- Submissions


Full Text
Approaches in Poultry, Dairy & Veterinary Sciences
Revealing the Effects of Reproduction and Turnover Rate on Farm Profitability through Herd Structure Dynamics
Li W and Cabrera VE*
Department of Dairy Science, University of Wisconsin-Madison, USA
*Corresponding author: Victor E Cabrera, Department of Dairy Science, University of Wisconsin-Madison, Madison, USA lo (LFDA-SP), Campinas, São Paulo, Brazil
Submission: August 08, 2020;Published: January 18, 2021
ISSN: 2576-9162 Volume8 Issue1
Abstract
Dairy herd structure influenced by reproductive performance and herd turnover rate affects the whole farm profitability because each group of animals has a distinctive production efficiency reflected in costs and revenues. The objective of this study was to reveal the interactions among reproductive performance, turnover rate, herd structure, and farm profitability. A monthly Markov chain model was used and updated with a newly developed heifer module. A 1,000-Holstein herd producing 10,442kg/ cow per yr in the US was simulated as the baseline herd, reaching steady-state with 45% turnover rate (TR), 16% 21-d pregnancy rate (21-d PR), and 0% voluntary calf culling rate (VCC). The baseline herd was imposed 25% TR or 40% 21-d PR and VCC combinations to maximize net return or breakeven the demand of replacements. Results showed that lower TR slightly increased net return primarily due to lower replacement demand, increased cow longevity, and had minor impacts on lactating and pregnancy statuses. Higher 21-d PR improved reproductive efficiency, placed more multiparous cows in earlier stages of lactation, and generated a larger number of replacements. Under current market conditions, if calves were not voluntarily culled, it led to considerable replacement rearing, decreasing net return. The combined strategy of 25% TR, 40% 21-d PR and 44% VCC increased net return by $16/cow per mo. Additionally, this strategy decreased percentage of youngstock (44.3% to 34.4%), reduced lactating herd average DIM (187 to 169) and increased herd average longevity (49.7 to 81.6 mo). Sensitivity analysis indicated that milk price significantly affects farm profitability regardless of herd structure. The optimal VCC to maximize net return highly depends on heifer rearing cost and market springer price. VCC could be 0 when the on-farm cost of raising a springer outnumbers selling price, or 100% otherwise. However, the minimum number of heifers for herd turnover should be raised on-farm considering biosecurity and sustainability under any market conditions.For practical utilization of the model developed for this research in commercial farms, target values of the combined strategy could be imposed progressively to alleviate volatility of net return in the short- and medium-term (6 to 34 mo), but still reach the same herd performance and economic outcomes in the long-term.
Keywords: Herd turnover rate; 21-d pregnancy rate; Herd structure; Farm profitability
Introduction
Dairy herd structure affects profitability on dairy farms. Each group of animals has a distinctive production efficiency reflected in costs and revenues. Therefore, different proportions of animals in different states or different herd structures are indicative of overall farm profitability [1-3]. Herd structure is a function of many factors, but the most important ones are reproductive performance and turnover rate (TR). Herd TR refers to the proportion of cows culled from a population over a period of time [4] and dictates the requirement of replacement heifers to maintain stable herd size [5]. Herd TR, therefore, governs the ratio of youngstock to adult animals. Dairy heifers do not provide income until freshening, so replacement rearing costs are usually allocated to lactating cows [6]. When youngstock raising costs are higher or comparable to finished market prices, as currently happens, it is critical to control the number of youngstock raised, especially when dairy profit margins are tight [7] to limit the costs incurred during rearing and prior to freshening. Herd TR also influences the percentage of primiparous cows in a herd, which have lower productivity than multiparous cows, impacting farm profitability [8,9]. Today’s dairy cow longevity is estimated at around 60 mo [10,11] in accordance with a high TR. Aggressive culling usually leads to a younger, but genetically better herd [12]. However, as livestock and milk markets change, the optimal herd TR becomes more sensitive to the difference between cow salvage revenue and heifer rearing costs rather than the benefits from genetic improvements [10]. Reproductive success can improve farm profitability [13-15] primarily through increasing calf value, decreasing reproductive cost, and/or increasing milk production [2,3,16]. The simulation models used by these researchers defined animals in different states and herd structures across simulations. In all cases, improved reproduction resulted in more pregnant cows, calvings, heifers, and changes in lactation distribution [3,16]. Distribution of different animal states offers weights of different animal groups to economic analyses [16-18], which eventually contributes to overall farm profitability [3,19,20]. Herd average DIM or herd average days open, often used in commercial farms, are believed to reflect herd reproductive efficiency [19]. Nevertheless, the average is likely to be influenced by abnormal tails of the actual distribution. Thus, overall herd structure is critical to portray the accurate statistics of a herd. Although many previous simulation models were framed by detailed herd structures, they merely looked at the structure by parity and related end outcomes [9,21]. There are other refined categories, such as lactating or dry, pregnancy status, stage of lactation, or combinations thereof to reveal the influences of management interventions.
Also, current simulation models provide the end, long-term insights about managerial changes. Such processes often take hundreds or thousands of iterations or simulated units of time until reaching a steady state that might represent long-term performance, which does not represent what would happen in the short- or medium-term. Commercial dairy farms have expressed their increased interest and need in the short- and medium-term performance evaluations [22]. Based on the preceding discussion, the first objective of this study was to investigate the effects of reproduction and herd TR on detailed herd structure dynamics and farm profitability, attempting to answer a question often asked: what is the optimal herd structure of a dairy herd based on current market conditions? The second objective was to monitor and maximize the monthly net return related to herd structure dynamics, providing a short- and medium-term vision for practical utilization of the model developed for this research.
Materials and Methods
Whole herd model
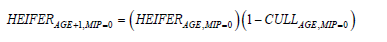
A monthly Markov chain model for adult cows, developed by Cabrera [1], was adjusted and improved. The model distinguishes adult cows by lactation (LACT; 1 to 10), month in milk (MIM; 1 to 33), and month in pregnancy (MIP; 0 for non-pregnant; 1 to 9 for pregnant), which are denoted as COWLACT ,MIM,MIP . A new heifer module was developed in Microsoft Excel® (Microsoft Corp., Redmond, WA) and connected to the cow model. Following Cabrera [1], we assigned calves and heifers to various states, denoted by age in mo (AGE; 1 to 34) and MIP. Consistent with the cow module, transition probabilities such as aging, culling (CULL), and pregnancy (PRG) were incorporated to the new heifer module (Table 1). According to historical records, monthly cow culling rates (mortality and involuntary culling) vary across LACT and MIM as shown in [18] and also used in [1]. Cows in the early stage of lactation have higher risk of culling, which decreases in the mid-lactation, and increases in late lactation. Multiparous cows have more culling risk than primiparous cows. Also, pregnant animals have lower risk than nonpregnant animals. As in [1], cows were labeled do-not-breed after 10 MIM and non-pregnant. These cows were then culled when their production declined below 22.7kg/d. Heifer mortality rates change across age, being higher during preweaning and then decreasing continuously (Table 1) [23]. Heifer 21-d PR was calculated using a matrix of 21-d conception rates multiplied by the average service rate (assumed to be 75%; Table 1). Heifer conception rates were assumed to be 60%, 50%, 45%, 40%, 35%, 30%, 25%, 20% for the 1st to 8th service, respectively (Table 1). Calves and heifers were simulated as follows:
Proportions of non-pregnant, non-breeding eligible heifers (AGE=1 to 12) were simulated as:
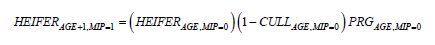
Proportions of heifers eligible to breed and becoming pregnant:
Proportions of heifers eligible to breed and not becoming pregnant:

Female newborn produced by the adult cows and springers (heifers ready to calve) are used as animal inputs for the heifer module, assuming female gender accuracy (%F) of conventional dairy semen to be 47% [2]:

The achieved goal in our study was to develop a whole herd model that included calves, heifers, and adult cows for assessing the relationship between TR and 21-d PR.
The simulated baseline herd
For practicality and scalability, a 1,000 Holstein adult cow dairy herd in Southern Wisconsin with predefined 45% TR and 16% 21-d PR (Table 1), defined as the baseline herd, was simulated until reaching steady state (SS1), which empirically was known occurred after 274 mo of simulation. The US national TR and 21-d PR are approximately 34% [24] and 22% [25], respectively, and their distributions include the parameters used in the baseline herd. The key variables are shown in Table 1.
The economic module
This module calculated monthly net return, the difference between all farm revenues and costs. Farm revenues included: (1) milk sales, herd milk production (aggregation of milk production in each lactating cow state) multiplied by milk price, (2) discarded animal sales, from non-reproductive culling and productive culling multiplied by salvage price. (3) bull calf sales, number of bull calves multiplied by price; (4) calf and heifer culling sales, female calves that are voluntarily culled and open heifers older than 20 mo; springer sales, surplus springers for herd turnover sold at market price. Costs included: (1) adult cow feed costs; (2) reproductive costs set in the baseline scenario at $20/cow per mo for all those breeding eligible cows. These aggregated costs included labor, hormones, AI and pregnancy diagnosis under the assumption of using a standard reproductive program that included a combination of timed AI and visual heat detection, as in [1]; (3) calf and heifer feed costs, number of animals in each state multiplied by corresponding feed costs; (4) springer cost, cost on purchasing springers for replacements if on-farm supply was insufficient; (5) other adult costs including veterinary, bedding, marketing, custom services, energy, repairs, interest on operating capital, and hired labor (for a farm size between 1,000-1,999 cows; [26]); (6) other calf and heifer costs including labor, veterinary, housing, and interest on operating capital. Net return was monthly calculated at the herd level ($/herd per mo) and at the individual cow level ($/ cow per mo). The default values of the economic variables of the baseline scenario are listed in Table 2.
Table 1: Default variables in the herd model.

1Default parameters except adult herd size, heifer herd size, and rolling herd average, were taken from a typical dairy farm in southern Wisconsin. 2Adult herd size was fixed at 1,000 for practicality and scalability. 3Heifer herd size was generated by the whole herd model after reaching steady state with given 45% turnover rate (TR), 16% 21-d pregnancy rate (21-d PR) and 0% voluntary calf culling rate (VCC). 4Approximated to US annual milk production in 2018 (USDA - NASS, 2019a). 5Heifer conception rates were assumed to be 60%, 50%, 45%, 40%, 35%, 30%, 25%, 20% for the 1st to 8th service, respectively. 6Heifer mortality rates by heifer class for all operations based on NAMHS (2012).
Table 2: Baseline economic variables used in the herd model.

1Female and male calf prices released on October 30th, 2019 from Equity Cooperative Livestock Sales Association. 2Received all milk price in August 2019 3Other adult costs include veterinary, bedding, marketing, custom services, energy, repairs, interest on operating capital, and hired labor. These costs based on a farm size from 1,000 to 1,999 cows (USDA–ERS, 2016). 4Other calf and heifer costs include labor, veterinary, housing, and interest on operating capital (Overton, 2019).
Model exploitation
The managerial intervention of TR or 21-d PR was first imposed on the baseline herd to capture the single factor effect on herd structure and farm profitability. We decreased overall TR to 25% and consequently the corresponding culling distribution transition probabilities decreased proportionally. Also, 21-d PR was increased to 40%, which we assumed could be accomplished by adopting a Double-Ovsynch+2nd PGF reproductive program (e.g., http://www.dcrcouncil.org/wp-content/uploads/2019/11/DCRCRoundtable_ Nov19_HD.pdf). The additional cost for this high 21-d PR was assumed to be $30/cow per mo in the baseline reproductive program. This cost assumption follows the trend observed in dairy reproductive economics studies when increasing the intensity of use hormonal treatments and decreasing visual detection [2,8]. Both the 25% of TR or 40% 21-d PR were set in the initial month and remained as such until steady state (274 mo) when herd statistics and economic outcomes were extracted. The TR and 21-d PR that would generate the maximum net return were then combined as a new managerial change. Anticipating a lager youngstock herd determining oversupply of replacements, we introduced the voluntary calf culling rate (VCC) to breakeven the supply and demand of replacements. We also maximized expected net return by selecting the optimal VCC using Microsoft Excel’s Solver tool with the Standard LP/Quadratic Engine. Finally, another constraint was imposed into the optimization algorithm to breakeven on-farm replacement supply and demand by manipulating the VCC.
To study farm performance in the short- and medium-term in addition to long-term outcomes after managerial changes, we progressively introduced the optimal strategies found previously. This implied changes in transition probabilities every simulated unit of time. Progressive managerial changes avoid substantial disruptions in farm performance and economic net return. We were interested in comparing overall performance between progressive or abrupt changes in the short-, medium-, and long-term. For long-term comparisons, we used a net present value with a 4%/yr discount rate according to current bank interest rate for medium term loans.
Sensitivity analysis
Previous sections of the study evaluated the farm economic under current market conditions, where the total heifer rearing cost (from birth to freshening) outnumbered the selling price. In the sensitivity analysis, we assessed net return under alternative market assumptions of milk price, springer price, salvage price, and heifer rearing cost. One price or cost assumption was changed at a time, leaving all other assumptions unchanged. Each factor was changed by ±50% and ±100%. The positive 100% change in springer price was set to be greater than the cost of raising a springer from birth to freshening (springer rearing cost of approximately $2,000). Heifer rearing cost was changed proportionally across all age groups. The single or combined managerial interventions performed before were also evaluated herein under different market conditions.
Results and Discussion
Replacement balance
Figure 1: Breakeven (replacement demand=supply) between turnover rate (TR) and 21-d pregnancy rate (21-d PR) with a stable adult herd size.

Turnover rate and 21-d pregnancy rate with a stable herd size: The relationship of adult herd 21-d PR versus TR to breakeven the supply and demand of replacements followed a quadratic function: TR=-0.0723 (21-d PR)2+5.5617(21-d PR) -39.224 (R²=0.9998) portraying a diminishing return of 21-d PR to compensate same change of TR at higher levels of 21-d PR (Figure 1). Because the assumption herein is a closed cycle, where only using on-farm replacement supply as replacements, heifer reproductive performance is also essential. Eligible heifer service rate and conception rate at 1st service were fixed at 75% and 60%, respectively, as defaults (Table 1), resulting in an average 23.2 mo of calving age. This allows for higher TR as 21-d PR increased. For example, when 21-d PR increases to 23.0%, TR is up to 50.4%, which indicates better reproduction could allow for more aggressive adult culling [16]. However, TR is not determined by 21-d PR. Positive replacement balance could be reduced by culling surplus replacement heifers [7].
Table 3: Herd statistics from the baseline scenario and the differences between the baseline scenario and treatments of imposing a single or combined managerial intervention on a 1,000 adult cow herd and corresponding youngstock.

1With 45% TR, 16% 21-d PR, and 0% VCC. TR=turnover rate, 21-d PR=21-d pregnancy rate, VCC=voluntary calf culling rate. 2Treatments: 25TR=25% turnover rate; 40PR=40% 21-d pregnancy rate; 25TR-40PR=25% turnover rate and 40% 21-d pregnancy rate; 25TR-40PR-44 VCC=25% turnover rate, 40% 21-d pregnancy rate and 44% voluntary calf culling at 2 mo of age. 3Dry cows excluded. 4The difference of springers required and produced on the farm. 5Based on the average mo at first calving of 23.2.
Turnover rate, 21-d pregnancy rate, and voluntary calf culling rate: Setting the maximum TR to 45% for the adult herd, VCC is intended to regulate extra replacements produced on-farm to balance the replacement supply and demand at steady state (Figure 2). At 21% 21-d PR, the breakeven of demand and supply is reached with 45% TR. Hence, starting at 22% 21-d PR, VCC kicks in with a quadratic trend. When TR reaches a given level of 45%, it is required to cull calves to maintain a stable adult herd size as 21-d PR increases.
Figure 2: Breakeven (replacement demand=supply) between turnover rate (TR) and 21-d pregnancy rate (21-d PR) or voluntary calf culling rate (VCC) and 21-d PR when TR is constrained to a maximum of 45% with a stable adult herd size.

Effect of herd turnover rate on herd structure and farm economics
Effect of turnover rate on herd structure: A new steady state (SS2) was found when decreasing TR from 45% to 25% (Table 3 & Figure 3). The percentages of 1st and 2nd lactation cows are reduced by 8.4 percentage points (from 50.0% to 41.6%) and 1.8 percentage points (from 27.2% to 25.3%), respectively. Accordingly, there are 10.2 percentage points more 3rd and greater lactation cows, resulting in an older herd. The productive lifespan increased from 25.8 to 35.0 mo. A study by Liang and Cabrera [9] reported a lower percentage of 1st lactation cows to increase percow milk production. In our study, a decreased number of lowerproduction primiparous cows (compared to mature cows) slightly increases the herd or per-cow milk production (28.5 vs. 28.6kg/ cow per day), which is consistent with [9], when the target milk production was close to the default value (10,442kg/cow per yr; Table 2). We also find that lactating herd DIM increases by 6 d to 193 d. The general belief is that as overall herd DIM increases, fewer cows are in the early stage of lactation, which results in lower herd milk production. However, this contradicts with the slightly increased milk production found in our study. Looking at detailed herd structure changes, the percentage of total cows in less than 90 DIM decreases from 26.9% to 25.4%, of which the percentage of primiparous cows decreases by 2.7%, while multiparous cows with higher productivity increases by 1.2%. Our results suggest that the change in lactating herd DIM caused by changing TR would not be indicative of the direction of the herd milk production shift.
Figure 3: Comparison of adult herd structures by lactation (1st, 2nd, and 3rd and greater), pregnancy and/ or lactating, and month in milk (MIM; 1 to 33) at steady state (SS) on decreasing turnover rate (TR) from 45% (SS1=45% TR and 16% 21-d pregnancy rate) to 25% (SS2=25% TR and 16% 21-d pregnancy rate).

With the refined herd structure, the percentage of dry cows increases by 0.4 percentage points to 9.8%, which might slightly dilute the per-cow milk production. Aside from more dry cows, the total percentage of pregnant cows also increases from 49.6 to 50.4%. Lower TR enables more eligible cows to be bred and there is a possibility that these cows become pregnant even though the process is inefficient, with only 16% 21-d PR. Therefore, youngstock increases by 40, from 794 to 834 head, representing 44.3% of the whole herd population. The youngstock herd structure remains the same because the managerial change introduced so far has no impact on them. In all, herd structure or distribution of animals (Figure 3) could account for those subtle alternations when TR decreased. In this case, decreased TR merely changes lactating and pregnancy status, but not the base number of eligible animals nor the distribution by parity.
Effect of Turnover Rate on Net Return: Compared to the baseline scenario, there is 38% less salvage value from non-reproductive culling and 31.5% more from reproductive culling (Table 4). As discussed, 25% TR increases the base number of eligible cows but also increases the likelihood of cows being culled due to reproductive failure. Milk sales only increase by $554/herd per mo because of a small increase in milk production. The replacement balance turns positive (3.4 head/mo) from a negative value (-7.4 head/mo), and the herd gains revenue from selling springers. Decreasing TR to 25% generates 40 more calves and heifers, leading to an increased rearing cost (Table 4). Net return increases by $2/cow per mo. The small increase in overall net return is mainly an artifact of fewer springers required and, therefore, allows available springers for sale, releasing an enormous pressure of purchasing replacements [6] and providing extra revenue.
Table 4: Farm economic values from the baseline scenario and differences between the baseline scenario and treatments of imposing a single or combined managerial intervention on a 1,000 adult cow herd and corresponding youngstock under current market conditions.

1With 45% TR, 16% 21-d PR, and 0% VCC. TR=turnover rate, 21-d PR=21-d pregnancy rate, VCC=voluntary calf culling rate. 2Treatments: 25TR=25% turnover rate; 40PR=40% 21-d pregnancy rate; 25TR-40PR=25% turnover rate and 40% 21-d pregnancy rate; 25TR-40PR-44 VCC=25% turnover rate, 40% 21-d pregnancy rate and 44% voluntary calf culling at 2 mo of age. 3Other adult costs include veterinary, bedding, marketing, custom services, energy, repairs, interest on operating capital, and hired labor. These costs are based on a farm size from 1,000 to 1,999 cows (USDA–ERS, 2016). 4Other calf and heifer costs include labor, veterinary, housing, and interest on operating capital (Overton, 2019). 5Net return=revenues expenses.
One arguable aspect that has not been built into our model is genetic progress. Improved reproduction and sexed semen use could prompt more culling due to accelerated genetic progress in commercial farms (Weigel et al., 2012), thus bringing economic benefits from genetic gains. However, our focus herein was to reveal herd structure dynamics according to TR, and then to capture greater net return rather than studying genetic progress. De Vries [10] reported that the optimal TR would become more sensitive to cull cow price and heifer rearing cost considering the everchanging market and the opportunity cost of raising a springer for 2 yr. Another study illustrated that the net present value decreased as TR increased regardless of genetic improvement, replacement heifer price, operation cost, and reproductive levels [27]. More recently, De Vries [11] concluded that genetic gain due to genomic selection has only minor effect on the optimal productive lifespan. A deduction for genetic opportunity costs on net return was considered beyond the scope of this specific study because we were interested in the herd structure and their specific relationship between TR and 21-d PR.
Effect of reproduction on herd structure and farm economics
Effect of Reproduction on Herd Structure: As the 21-d PR rose from 16% to 40% (SS3), the overall percentage of pregnant cows increases from 49.6% to 67.3% (Figure 4). Research has reported that better reproduction results in more pregnant cows [3,8,28], which is consistent with our results. The 67.3% of pregnant cows are not commonly seen in the industry, but it would be accomplished when 40% 21-d PR is constantly achieved on a 45% TR farm for a long period of time. We also found that the increase in pregnant cows occurs only in multiparous cows (from 25.0% to 43.9%), whereas the percentage of pregnant primiparous cows decreases from 24.6% to 23.4%. Fewer pregnant primiparous cows occurs because the overall percentage of first lactation cows decreases from 50.0% to 34.5%. However, the ratio of pregnant to nonpregnant primiparous cows increases from 0.97 to 2.11 due to high reproductive efficiency. Giordano et al. [2,29] reported lesser culling due to reproductive failure when reproduction was improved, which implied fewer primiparous cows as in our study. The herd longevity increases by 14.6 mo from 49.0 to 63.6 mo, which seems a more efficient way to increase herd longevity than only decreased TR (49.0 to 58.2 mo). Furthermore, improved reproduction also causes a larger youngstock herd, from 794 to 1,078 head, which then accounts for 51.9% of the whole herd (Table 3).
Figure 4: Comparison of adult herd structures by lactation (1st, 2nd, and 3rd and greater), pregnancy and/or lactating, and month in milk (MIM; 1 to 33) at steady state (SS) on increasing 21-d pregnancy rate (21-d PR) from 16% (SS1=45% turnover rate and 16% 21-d PR) to 30% (SS3=45% turnover rate and 40% 21-d PR).

Effect of reproduction on milk production: Lactating cows in the early stage of lactation tend to produce more milk [30] due to the inherent cow physiology described by the typical lactation curve. There are more multiparous cows in early lactation stage (Figure 4), leading to a decreased lactating herd DIM, from 187 to 165 d (Table 3). As stated, improved 21-d PR seems to place more multiparous cows in a more productive stage, resulting in higher milk production [3,15,16]. The milk production per lactating cow increases by 1.4kg/d (+4.5%) from 31.5 to 32.9kg/d at the given rolling herd average. However, per-adult milk production merely increases by 0.2kg/d (+0.6%) from 28.5 to 28.7kg/d (Figure 5) because there were 3.9% more dry cows diluting the herd milk production [2,8,21].
Effect of reproduction on net return: As milk lactation curves are assumed to remain constant, herd population changes due to increased 21-d PR make only a minor difference in milk sales (Table 4), which agrees with previous studies [2,8,16]. With improved reproductive performance, the total reproductive cost decreased by 6.6% even though default reproductive cost increased from $20 to $30/cow per mo. Increased 21-d PR leads to less reproductive culling, more bull calf sale revenue, and more significant heifer rearing costs (feed and other costs) due to a larger youngstock herd. Also, replacement balance switches to positive and increased revenue from selling excess springers. Net return decreases by $5/ cow per mo (-5.9%) compared with the baseline scenario.
Giordano et al. [29], who compared the economic performance of 3 breeding programs, have reported that the economic differences ranged from $2.0 to $5.8/cow per mo. In Giordano et al. [2], the economic difference between the lowest (14%) and highest (20%) 21-d PR was $4.1/cow per mo. Calsamiglia et al. [21] increased 21-d PR from 12% to 17% with timed artificial insemination, and the net margin increased by $5.9/cow per mo. These variations could be explained by the assumption of only purchasing replacements, the magnitudes of 21-d PR, different voluntary waiting period, and distinct economic variables. Importantly, in the present study, we assumed that on-farm replacements would enter the herd, and springers would be purchased if there was an insufficient supply. Hence, calf and heifer rearing costs and other management costs were included to calculate net return. Increasing 21-d PR from 16% to 40% do bring benefits reported in previous research, but also a more significant expense on heifer rearing costs, leading to an even decreased net return (Table 4).
Figure 5: Per-cow milk production over time after imposing an increase of 21-d pregnancy rate (21-d PR) from 16% (SS1=45% turnover rate and 16% 21-d PR) to 40% (SS3=45% turnover rate and 40% 21-d PR).

Combined strategies to maximize farm profitability
Based on previous results, an attempt was made to maximize net return by combining decreased TR and increased 21-d PR. The baseline herd first imposes a 25% TR (25TR) and then a 40% 21-d PR (40PR), which enables the farm to replace less and produce more heifer replacements at the same time. Replacement balance of this combination (25% TR, 40% 21-d PR and 0% VCC; 25TR-40PR) is positive, 26 head/mo, and the heifer herd accounts for 53.1% of the whole herd population, which creates a higher replacement rearing cost (Table 4). In this case, net return (Table 4) decreases by $3/cow per mo in comparison with the baseline scenario. To capitalize on the gains and reduce the additional costs for maximum profit, only the required number of replacements are raised on-farm. Surplus calves are sold at 2 mo of age. The optimal VCC is 44% to balance on-farm supply and demand for replacements to be self-sufficient at steady-state. Compared to 25% TR, this change (25% TR, 40% 21-d PR and 44% VCC; 25TR-40PR-44VCC) decreases heifer rearing costs but also removes springer sales (Table 4). In the end, the net return increases by $16/cow per mo. Selection costs can be computed if the farm would use genomic testing at $35/calf. In this case study, the expense on genomic testing for all calves would be $1,313/mo. After the managerial change of 25TR-40PR-44VCC, the youngstock accounts for 34.4% of the whole herd (Table 3). Dry cows increase by 3.9 percentage points from 9.4% to 13.3%, and 1st lactation cows decrease by 24.3% percentage points from 50.0% to 25.7%. Also, the percentages of cows in early, peak, and middle stages of lactation increases by 5.3%, 7.4%, and 9.1%, respectively, which were compensated by the decreased percentage of cows in late lactation stages (Table 3). Meanwhile, herd average lactation increases from 2.1 to 3.5 and adult herd longevity increases by 32.9 mo, from 48.7 mo to 81.6 mo. De Vries [11] reported an optimal productive lifespan of 5 yr (84 mo), which is consistent with this our result of the combined strategy.
Short- and medium-term strategies to maximize the farm profitability
The long-term analysis at steady state did provide insights with economic values as commonly done by various studies [1,3,21]. However, for the practical application of the model developed, short- and medium-term predictions and economic analyses are necessary [17], which farmers are interested in [22]. Analyzing the short-term net return portrays significant volatility (gray line; Figure 6) because 21-d PR, TR, and VCC changed considerably every month (from the initial to the subsequent month). In a quest for less volatile changes, managerial interventions on TR, 21-d PR, and VCC were progressively introduced every month. 21-d PR was increased by 1% monthly to 40%, and TR was decreased by 1% monthly to 25%. In the simulated mo 9, 20% VCC was introduced and increased by 1% monthly to 44%. 21-d PR, TR or VCC were maintained after reaching their target values. Results displays a smooth increase in net return until mo 28 ($107/cow per mo), the point at which a reduction starts ($104/cow per mo) because of a carry-over effect of the baseline herd. The baseline herd already had a stable youngstock herd structure, and VCC only impacts calves at 2 mo of age. For heifers older than 2 mo of age in the baseline herd, they would continue to grow until becoming springers, whether for sale or as replacements, which imposes noise that affects the steady rise of the net return. In the long run, net return still reaches the same level ($108/cow per mo) as in the steady-state analyses, but with much lower volatility in the first 30 mo and lesser simulation time (20 mo) to reach steady state. Because the concentrated calving would result in a substantial amount of calves, milk production, and springers at a later specific time, it impacts the variability of monthly net return. Increasing 21-d PR progressively distributes pregnant cows to each month, thus eliminating concentrated calving at one particular time. The nature of progressive change in the study is to change transition probabilities monthly. With this approach, the same level of net return is reached faster in the longterm.
Figure 6: Comparison of net return with abrupt (gray and dashed line) and progressive (black continuous line) change of the combined managerial changes (25% turnover rate, 40% 21-d pregnancy rate, and 44% voluntary calf culling). Net return=all revenues–all expenses.

A further analysis was conducted to explore the performance of abrupt and progressive change approaches in terms of their corresponding net present value (NPV) with a 4%/yr discount rate (Figure 7). Although there is significant volatility of abrupt change, the NPV is always slightly greater than a progressive change. It might suggest that risk-takers, who could handle financial volatility, could capture slightly greater profits. Nonetheless, risk-averse farmers might feel more comfortable with secure, less volatile net return in the short- and medium-term. To investigate monthly herd structure and economics in the short-term, Table 5 provides herd statistics and economic values for simulated mo 6, 12, 24, and 36. Like the long-term analyses, a small increase in net return happens partly because a lower TR reduced the required number of replacements. However, the primary outcomes of higher 21-d PR regarding herd structure and net return are realized in a more extended time. In mo 6, an improved 21-d PR of 21% shows no changes in stages of lactation. Reproductive cost increases in the short-term because of higher cost of improved reproduction and increased number of eligible cows due to lower TR. The reproductive culling increases due to a larger base number of eligible animals, which resulted from the lower TR. At this time, the effects of improved reproduction are not realized. Around mo 12, due to better reproduction, more cows start calving consecutively. Therefore, progressively increased 21-d PR makes few differences regarding stages of lactation and net return and slightly increases by $2/cow per mo (Figure 6), which is in favor of stable net return. As the simulation progresses, the benefits of reproductive success start manifesting. These were reflected in less reproductive cost, less reproductive culling, more offspring, and more cows in earlier stages of lactation. The time lag of reproduction between the implementation of a program and realization of economic benefits was then revealed, in-line with previous studies [8,29,31].
Table 5: The short-term herd statistic and economic differences between the baseline scenario and progressive managerial interventions (target values of 40% 21-d pregnancy rate, 25% turnover rate, and 44% voluntary culling rate achieved in mo 34 of simulation) at specified month (6, 12, 24, 36, respectively).

1Dry cows excluded. 2The difference of springers required and produced on the farm. 3Based on that the average mo at first calving was 23.2. 4Other adult costs include veterinary, bedding, marketing, custom services, energy, repairs, interest on operating capital, and hired labor. These costs based on a farm size from 1,000 to 1,999 cows (USDA–ERS, 2016). 5Other calf and heifer costs include labor, veterinary, housing, and interest on operating capital (Overton, 2019). 6Net return=revenues-expenses.
Sensitivity analysis
The net return sensitivity for prices and costs relative to the baseline scenario under the current market assumption ($92/ cow per mo) for the baseline herd and 4 managerial interventions are shown in Figure 7. As expected, milk price makes the most significant difference in net return, ranging from $177 to $199/ cow per mo when increased by 50% for the baseline herd and all managerial interventions. The difference in net return for the extreme treatments is relatively small ($22 or 12.4% more from the worst to the best treatment). Comparisons between managerial treatments follows the same pattern as stated in previous sections. When springer price decreases and increases by 50%, it ranges from $0 to $1860, which is less than the on-farm springer rearing cost (the cost of raising a calf/heifer from birth to freshening was approximately $2,000). In this case, the combined strategy “25TR- 40PR-44VCC” has the greatest net return among all treatments. The springer price has no impact on the intervention because of self-sufficient of springer supply. Reduction in net return of other treatments is because surplus heifers fails to be transformed into more valuable assets. In the situation where springer price decreases, the baseline scenario with 45% TR and 16% 21-d PR is the second most profitable, which indicates insufficient on-farm heifer supply could be complemented by off-farm heifer sources at a low cost. When springer price doubles ($2,480), farms could improve profit by selling extra springers. Combining 25% TR and 40% 21-d PR (25TR-40PR) becomes the most profitable treatment due to reduced replacement heifer demand and boosted heifer production. Similarly, heifer rearing cost, the opposite aspect of springer price, is greatest for “25TR-40PR-44VCC” strategy when being increased and decreased by 50%. Increasing heifer rearing cost by any level leads to smaller net return compared with the baseline scenario. When heifer rearing cost is reduced by more than 50%, on-farm springer rearing cost becomes lower than the default springer price ($1,240), for which raising more heifers and selling extra springers could be profitable. Net return seems less sensitive to the salvage price compared with milk price and springer price. When salvage price increased by 100%, the baseline herd (45% TR and 16% 21-d PR) had a greater net return in comparison with lower TR (25%). At such high salvage price, 40% 21-d PR fails to help 25% TR increase net return unless culling extra heifers (Figure 8).
Figure 7: Comparison of net present value (NPV, $/cow; discount rate = 4%/yr) with abrupt (gray continuous line) and progressive (black and dashed line) changes of the combined managerial changes (25% TR, 40% 21-d PR, and 44% VCC).

Figure 8: Net return ($/mo per cow) for the baseline herd (Baseline; 45% turnover rate, 16% 21-d pregnancy rate and 0% voluntary calf culling rate at 2 mo of age) and 4 managerial interventions under distinct market scenarios. Managerial interventions were: 25TR=25% turnover rate; 40PR=40% 21-d pregnancy rate; 25TR-40PR=25% turnover rate and 40% 21-d pregnancy rate; 25TR-40PR-44 VCC=25% turnover rate, 40% 21-d pregnancy rate and 44% voluntary calf culling at 2 mo of age. The net return for the baseline herd under current market conditions, $92/cow per mo, is set as reference for other scenarios.

Whether to cull or not-to-cull calves depends highly on the relationship between springer price and heifer rearing cost. Thus, as a follow-up analysis, we set an optimization algorithm to maximize the net return by selecting the optimal VCC within previously predefined plausible ranges from 0 to 100%. The optimal VCC that maximized net return was 100% when the cost of raising a heifer from birth to freshening is greater than the market springer price, and 0% when the latter outnumbers the former. However, it is likely many farms would choose to raise at least the minimum number of heifers for herd turnover considering biosecurity and sustainability concerns under any market conditions.
Limitations
As in other simulation studies, some limitations of our model and study need to be recognized. One limitation is the predefined culling distribution module [1], which is based on the historical involuntary culling data similar to [19]. A higher probability of involuntary culling occurs in early and late lactation and varies by lactation, which is reasonable. However, this type of module does not include possible culling strategies farmers might use. For example, some farmers would strive for keeping primiparous cows over multiparous cows. In our study, TR was proportionally changed, which limited the potential custom culling that could impact the herd structure. Another limitation was our monthly model framework that could not reproduce many reproductive scenarios precisely as they nowadays occur [1]. Nevertheless, our focus was to generally understand the impacts of reproduction on herd structure and farm economics, rather than comparing a variety of breeding programs in other studies. Nevertheless, we envision that the model will become a practical decision-making tool, which needs less inputs but provide enlightening insights and quantitative conclusions for commercial dairy farms [32-36]. Also, we acknowledge that there could be other opportunities to better simulate a dairy farm such as including seasonality, health, and genetics. Incorporation of semen combination of all types into a simulation model might be one important direction for future modeling. For example, Li and Cabrera [5] reported farms using solely female-sorted sexed semen to produce replacements and beef semen brought extra revenues, which could make a significant difference in the herd structure dynamics and optimal farm profitability.
Conclusion
Reproduction and turnover rate are two major factors of a dairy herd with essential impacts on farm profitability, which are first reflected in herd structure dynamics. Herd structure provides weighted economic values that greatly influence farm economics. Herd structure could be a critical key performance indicator for commercial dairy farms to monitor herd evolution and account for economic performance. The optimal herd structure is a joint result of reproduction and culling policies. In general, and under current market conditions, farms with better reproduction performance, lower herd turnover, tailored calf culling, and raising only required replacements, are more profitable. To eliminate enormous volatility in farm economic performance in response to drastic reproductive or replacement changes, combined managerial interventions could be implemented progressively. The model described in this manuscript is envisioned to become a user-friendly decision support tool.
Acknowledgement
This work is supported by the Food and Agriculture Cyberinformatics and Tools grant no. 2019-68017-29935/project accession no. 1019780 from the USDA National Institute of Food and Agriculture. The authors are thankful to Allison E. Quick and Bill Slack for their review of an earlier version of the manuscript.
References
- Cabrera VE (2012) A simple formulation and solution to the replacement problem: A practical tool to assess the economic cow value, the value of a new pregnancy, and the cost of a pregnancy loss. J Dairy Sci 95(8): 4683-4698.
- Giordano JO, Kalantari AS, Fricke PM, Wiltbank MC, Cabrera VE (2012) A daily herd Markov-chain model to study the reproductive and economic impact of reproductive programs combining timed artificial insemination and estrus detection. J Dairy Sci 95(9): 5442-5460.
- Kalantari AS, Cabrera VE (2012) The effect of reproductive performance on the dairy cattle herd value assessed by integrating a daily dynamic programming model with a daily Markov chain model. J Dairy Sci 95(10): 6160-6170.
- Fetrow J, Nordlund KV, Norman HD (2006) Invited review: Culling: Nomenclature, definitions, and recommendations. J Dairy Sci 89(6): 1896-1905.
- Li W, Cabrera VE (2019) Dairy Beef: sustainable future or fad? Proc Dairy Cattle Reproduction Council Conf, USA.
- St-Pierre NR, Eastridge ML (2013) Culling rate on dairy farms and its effect on income over feed costs and forage inventory requirements. USA. pp. 153-159.
- Overton MW (2019) Replacement heifers: how many, what kind, and how should we manage it all? J Dairy Sci, pp. 345.
- Galvão KN, Federico P, De Vries A, Schuenemann GM (2013) Economic comparison of reproductive programs for dairy herds using estrus detection, timed artificial insemination, or a combination. J Dairy Sci 96(4): 2681-2693.
- Liang D, Cabrera VE (2015) Optimizing productivity, herd structure, environmental performance, and profitability of dairy cattle herds. J Dairy Sci 98(4): 2812-2823.
- De Vries A (2017) Economic trade-offs between genetic improvement and longevity in dairy cattle. J Dairy Sci 100(5): 4184-4192.
- De Vries A (2020) Symposium review: Why revisit dairy cattle productive lifespan? J Dairy Sci 103(4): 3838-3845.
- Liang D (2017) Whole farm decision-Making, Dairy farms profitability and greenhouse gas emission. USA. pp. 1-210.
- Meadows C, Rajala Schultz PJ, Frazer GS (2005) A spreadsheet-based model demonstrating the nonuniform economic effects of varying reproductive performance in Ohio dairy herds. J Dairy Sci 88(3): 1244-1254.
- Olynk NJ, Wolf CA (2007) Expected net present value of pure and mixed sexed semen artificial insemination strategies in dairy heifers. J Dairy Sci 90(5): 2569-2576.
- Overton MW, Cabrera VE (2017) Monitoring and quantifying the value of change in reproductive performance. In: Beebe DK (ed.), Large dairy herd management (3rd), USA. pp. 549-564.
- Cabrera VE (2014) Economics of fertility in high-yielding dairy cows on confined TMR systems. Animal 8(1): 211-221.
- St Pierre NR, Jones LR (2001) Forecasting herd structure and milk production for production risk management. J Dairy Sci 84(8): 1805-1813.
- Cabrera VE (2010) A large Markovian linear program to optimize replacement policies and dairy herd net income for diets and nitrogen excretion. J Dairy Sci 93(1): 394-406.
- De Vries A (2004) Economics of delayed replacement when cow performance is seasonal. J Dairy Sci 87(9): 2947-2958.
- Lima FS, De Vries A, Risco CA, Santos JEP, Thatcher WW (2010) Economic comparison of natural service and timed artificial insemination breeding programs in dairy cattle. J Dairy Sci 93(9): 4404-4413.
- Calsamiglia S, Astiz S, Baucells J, Castillejos L (2018) A stochastic dynamic model of a dairy farm to evaluate the technical and economic performance under different scenarios. J Dairy Sci 101(8): 7517-7530.
- Cabrera VE (2018) Invited review: Helping dairy farmers to improve economic performance utilizing data-driving decision support tools. Animal 12(1): 134-144.
- (2012) NAHMS Dairy Studies: Dairy heifer raiser 2011. NAHMS (National Animal Health Monitoring System). US Department of Agriculture: Animal and Plant Health Inspection Service: Veterinary Services: Centers for Epidemiology and Animal Health (USDA:APHIS:VS:CEAH), USA. pp. 1-164.
- (2018) Dairy 2014: Health and Management Practices on U.S. Dairy Operations 2014. NAHMS (National Animal Health Monitoring System). US Department of Agriculture: Animal and Plant Health Inspection Service: Veterinary Services: Centers for Epidemiology and Animal Health (USDA:APHIS:VS:CEAH), USA. pp. 1-216.
- (2019) DRMS (Dairy Records Management Systems) Dairy metrics, USA.
- (2016) National milk cost of production. USDA-ERS (Economic Research Service), USA.
- Dhuyvetter KC, Kastens TL, Overton MW, Smith JF (2007) Cow culling decisions: Costs or economic opportunity? West Dairy Manag Conf 9: 1-16.
- Tenhagen BA, Drillich M, Surholt R, Heuwieser W (2004) Comparison of timed AI after synchronized ovulation to AI at estrus: Reproductive and economic considerations. J Dairy Sci 87(1): 85-94.
- Giordano JO, Fricke PM, Wiltbank MC, Cabrera VE (2011) An economic decision-making support system for selection of reproductive management programs on dairy farms. J Dairy Sci 94(12): 6216-6232.
- Sharma AK, Wilcox CJ, Martin FG, Thatcher WW (1990) Effects of stage of lactation and pregnancy and their interactions on milk yield and constituents. J Dairy Sci 73(6): 1586-1592.
- Britt JH (1985) Enhanced reproduction and its economic implications. J Dairy Sci 68(6): 1585-1592.
- De Vries A, Van Leeuwen J, Thatcher WW (2004) Economic importance of improved reproductive performance. Proc 2004 Florida Dairy Reprod Road Show. pp. 33-43.
- De Vries A (2006) Economic value of pregnancy in dairy cattle. J Dairy Sci 89(10): 3876-3885.
- (2019) Equity Cooperative Livestock Sales Association. Statewide market report.
- (2019a) Milk production. USDA-NASS (National Agricultural Statistics Service), USA.
- (2019b) Agricultural prices. USDA-NASS (National Agricultural Statistics Service), USA.
© 2020 Victor E Cabrera. This is an open access article distributed under the terms of the Creative Commons Attribution License , which permits unrestricted use, distribution, and build upon your work non-commercially.
Editor In Chief


.jpg)


Signup for Newsletter

Quick Links
 Editorial Board Registrations
 Submit your Article
 Refer a Friend
 Advertise With Us
Our Recent Edition

.jpg)


Top Editors


.jpg)


.bmp)
.jpg)
.png)
.jpg)


.jpg)


.png)

.png)


.png)


Financial Support

Sponsors

Latest e-Books

Latest Video

 a Creative Commons Attribution 4.0 International License. Based on a work at www.crimsonpublishers.com.
Best viewed in
a Creative Commons Attribution 4.0 International License. Based on a work at www.crimsonpublishers.com.
Best viewed in