
- About Us
- Information
-

The Author ensures that the research has been conducted responsibly and ethically with adherence to all relevant regulations. read more..
- For Authors
- For Reviewer
- Manuscript Guidelines
- Membership
- Publication Ethics
-
- Journals
- Reprints
- e-Books
- Videos
- Policies
- Contact Us
 COVID-19
- Submissions


Full Text
Approaches in Poultry, Dairy & Veterinary Sciences
Expression Profiling and Quantification of Interferon Gamma (IFN-Y) Gene in Sheep Experimentally Infected with Haemonchus Contortus
Gautam Patra1*, Efimova MA2,3,4, Ana Sahara5, Lateef Al-Awsi GR6, Ghosh S1, Shamik Polley7, Kumar SB1 and Debbarma A8
1Department of Veterinary Parasitology, India
2,3,4Kazan State Academy of Veterinary Medicine, Russia
5Department of Veterinary Parasitology, Indonesia
6Department of Biomedical Engineering, Iraq
7Department of Veterinary Physiology & Biochemistry, India
8College of Veterinary Sciences and Animal Husbandry, India
*Corresponding author: Gautam Patra, Department of Veterinary Parasitology, India
Submission: January 08, 2020;Published: January 22, 2020

ISSN: 2576-9162 Volume7 Issue3
Abstract
The present study was carried out to assess the rhythmic change in the relative expression of IFN-y and quantification in blood of sheep experimental infected with Haemonchus Contortus. The whole blood samples were collected from Garole and Sahabadi breeds of sheep from West Bengal, India. All samples collected on three occasions were tested for expression of IFN-y gene in relation to GAPDH gene for quantification by Fast Eva green-based real time PCR and relative concentration by using the ELISA based standard commercial kit. The subsequent analysis was done by comparing infected group with normal group. The relative expression of IFN- gene in resistant group was found significantly lower (p< 0.05) in comparison to other two susceptible groups. The serum concentration of IFN-y was also found lower at the end of the experiment compared to two susceptible groups. This unique expression profile with reduced expression of IFN Y gene and low level of the cytokine in resistant Garole sheep indicates the immunity against Haemonchus Contortus infection in sheep predominantly Th2 type rather than Th1 type. This rhythmic change in immunological profile of IFN Y gene found in the present study will help to implement suitable control measure against one of the most pathogenic nematodes in ruminants.
keywords Haemonchus Contortus; Sheep; IFN-y gene expression and quantification
Introduction
Among gastro-intestinal nematodes of ruminants, Haemonchus Contortus is the most pathogenic parasite which is responsible for severe health and economic loses in livestock industry throughout the world [1]. The disease haemonchosis in severely infected animals like sheep and goats is characterized by severe blood loss, anaemia, loss of body weight and growth and even death [2]. Control of GI nematodes including Haemonchus Contortus relied upon wipe spread use of anthelmintics, but repeated treatment has resulted in drug resistance [3]. It is therefore impelling to search for alternative control measures. In infected animals, T helper (Th2) cells are activated and this Th2 response plays important role in case of Haemonchus Contortus infection [4]. IFN-y is an immune cytokine associated with upregulation of the Th1 subset. Therefore, high rise of IFN-y could compromise the ability of the host to expel a nematode infection due to the shift of the Th1/Th2 balance to Th1 dominance [5]. Understanding of the immune mechanism is an important step for the development of new control measures.
Parasitism in ruminants depends of several intrinsic and extrinsic factors. However, seasonal variation of parasitism is still unclear. Parasites can hardly detect directly the environmental stimuli like temperature, photoperiodicity etc. The parasitic larval stages hibernate in winter in the internal organs like in liver and muscle of their endothermic hosts. These types of parasites are unable to show periodicity due to endogenous circannual clock to time emergence but relapse in animals present on constant photoperiod regimes [6,7]. On the other hand, a seasonal fluctuation in host physiology could stimulate or facilitate parasitic emergence. In the present investigation, the main objective is to unravel the rhythmic induction of IFN-y cytokine gene by quantifying mRNA via Q-RT-PCR, as a marker for cytokine gene expression in response to Haemonchus contortus antigens as well as determination of serum level of this cytokine which in turn could provide valuable insights for the development of novel immunodiagnostic technique and also therapeutic and vaccination strategies against haemonchosis.
Material and Method
Animals were divided into three groups according to egg per gram of faces (EPG): five Garole sheep with mean EPG 150 (resistant) as Gr-I; five Garole and five Sahabadi with 500 EPG as Group-II and Group-III (susceptible), respectively. All three Groups were fed with Haemonchus contortus third stage larva (L3) @ 500/kg body weight using a 10ml syringe. For determination of expression level of IFNY gene from all three groups viz resistant group (n=5), susceptible Garole group (Gr-II) and susceptible Sahabadi (Gr-III), the RNA was isolated from trizine-stored blow samples using standard protocol on day 0, 7 and 14 days post infection. The RNA was also extracted from non-infected group as a control group for comparison. The quality of the RNA samples was analyzed by running equal amount of D-Nase treated RNA in denaturing agarose gel electrophoresis. Total RNA was quantified, and purity was checked using the Nano Drop Spectrophotometer. One microliter of re-suspended total RNA was used and absorbance at 260nm and 280 nm wavelengths were recorded against nuclease free water as blank. RNA samples showing the OD 260; OD 280 value more than 1.8 were taken for further use. The first strand cDNA was synthesized from the isolated total RNA. Reverse transcription was carried out in 20µl reaction mixtures. Reaction mixture was mixed to RNA primer complex and spanned, followed by incubation at 25 °C for 5 minutes and 42 °C for 60 minutes. Reaction was stopped by incubating for 5 min at 70 °C and finally at 4 °C forever. The c DNA was stored at -20 °C for further use. The resulting complementary DNAs (cDNAs) were used in quantitative RT-PCR (Qrt-PCR) reactions. A 137bp for IFNY and 113bp for glyceraldehydes-3-phosphate dehydrogenase (GAPDH) genes were designed for RT-PCR reaction in the present study.
The sequence of each gene is given below
IFNɤ: For CTTGAACGGCAGCTCTGAGAAACT; Rev AGGTTAGTTTTGGCGACAGGTC.
GAPDH: For CCTTCATTGACCTTCACT; Rev GCCTTTCCATTGATGACGAG.
Quantitative Real-time PCR was performed with SOS Fast Eva green@ q PCR Kit (Biorad) and Bio Rad Real time PCR thermal cycler (USA) operated by Bio-Rad CFX Manager. Reaction setup was performed in area separate from nucleic acid preparation or PCR product analysis. Exposure of light to the Q PCR master mix was minimized. Pipetting was done carefully without creating bubbles to avoid interference in reading of fluorescence by the instrument. In negative control, only the real time master mix and primers were added. The reaction set up and thermal cycler protocol is shown as Table 1 & 2. The amplification and denaturation were acquired. After the run has ended, cycle threshold (Ct) values and amplification plot for all determined factors were acquired by using the Eva Green R (with dissociation curve) method of the Bio-Rad CFX Manager real time machine (USA). Optical data were collected at end of each extension step, and relative expression of PCR product was determined by the equation [8] given below:
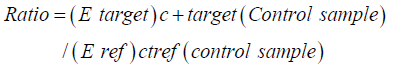
Table 1: Master mix.

Table 2: Master mix.

Where,
Ratio is the relative expression,
E target is the real time efficiency of the target gene transcript, and
E ref is the real time efficiency of housekeeping gene transcript.
The statistical significance of differences in mRNA expression of the examined factors was assessed by using one-way ANOVA and paired t’ test using SPSS 16.0 software. Differences were considered significant if P<0.05. For the quantitative estimation of IFN-y serum samples were collected separately from three infected groups on day 0, 7 and 14-day post infection. Approximately 5ml of blood was drawn ascetically by jugular vein puncture with the help of a disposable syringe from each sheep and then serum was collected after three hours. The collected serum samples were preserved without any preservative at -20 °C in a deep freezer until further use. IFN-y in the serum samples of different days of post infection was quantified in pg/ml using the ELISA based standard commercial kits (CUSABIO Pvt. LTD., USA). The procedure was as mentioned: First, samples were brought to room temperature for 30 minutes before use. The number of wells to be used was determined. 100µl of the Standard or the Sample was added per well in duplicate followed by the addition of 50µl of HRP- conjugate to each well. Then the samples were mixed properly and incubated for 2 hours at 37 °C. After incubation, the contents of the plates were shaken out and the wells were washed at room temperature by filling each well with Wash Buffer (200µl) using a squirt bottle, multi- channel pipette. After the last wash, any remaining wash Buffer was removed by aspirating or decanting. Then the plate was inverted and blotted it against clean paper towels. Fifty microlitre of the substrate A and substrate B were added to each well and mixed properly. The plate was covered and incubated for 15 minutes at 37 °C keeping the plate away from drafts and other temperature fluctuations in the dark. Finally, 50µl Stop Solution was added to each well and the plate was gently tapped to ensure thorough mixing. The optical density of each well was determined within 10 minutes, using a micro plate reader set at 450nm. Data on the parameters for each group on different post-infection days were analyzed (Analyze-Compare Means) for obtaining the mean value along with standard error (S.E). After that they were analyzed separately i.e. between the relevant groups and between post-infection days by DUNCAN method (one-way ANOVA). The significance of the difference (p-value) was recorded at 5% (p<0.05) level and 1% (p<0.01) level.
Further, the percentage changes in respect of all the parameters in the infected of both resistant and susceptible group of Garole sheep and Sahabadi as control group were calculated. These percentage values were then analyzed between the two breeds of sheep and the significance was recorded. The complete statistical analyses were done using the Statistical Package for social scientists (SSPS), Windows version 20.0. All animal experimentations were performed as per the provided guidelines by ARRIVE and committee for the purpose of control and Supervision of experiments on Animals (CPGSEA) and was approved by Institutional Animal Ethic Committee with Reference no. CVSc/CAU/ no. 1819, dtd, Selesih, 24 February 2018.
Result
Agarose Gel electrophoresis of total RNA, cDNA using primers for GAPDH and cDNA using primers for IFN-y gene are shown in Figure 1-3. Changes in mRNA expression level of IFN-y due to haemonchosis in different experimental groups of sheep are present in Table 3 and depicted in Figure 4 & 5. It was observed that the relative expression of IFN-y gene in Gr-I was significantly lower (p<0.05) as the infection progressed with the level being 1.16±0.197 on day 7 to 0.54±0.14 on day 14. Evidently, the two susceptible groups showed a greater expression of IFN-y mRNA in response to Haemonchus contortus infection compared to the resistant breed, but it was not statistically significant. In the present study a transient rise of IFN-y mRNA expression was seen in resistant group on day 7 before decreasing on day 14 of post infection. The mean serum concentration of IFN-y in the resistant Garole sheep (Gr-I) was 15.44pg/ml prior to infection, increasing to 17.42pg/ml on 7-day post infection but dropped significantly (p<0.01) at 7.56pg/ml 14 days after infection. In GR-III, the serum concentration of IFN-y was 16.90pg/ml prior to infection, went up to 20.58pg/ml on day 7 then dropped (P<.01) to 17.54pg/ml after 14 days. Interestingly the infection did not have any significant effect on the concentration of IFNY in group-II during the course of infection (Table 4; Figure 6).
Figure 1: Denaturing agarose (containing formaldehyde-MOPS) gel electrophoresis for isolated RNA samples from blood.

Figure 2: 1.5% Agarose gel electrophoresis of PCR products for GAPDH amplification (113bp) for-cDNA samples (L: 100bp ladder).

Figure 3: Denaturing agarose (containing formaldehyde-MOPS) gel electrophoresis for isolated RNA samples from blood.

Figure 4: Denaturing agarose (containing formaldehyde-MOPS) gel electrophoresis for isolated RNA samples from blood.

Figure 5: Denaturing agarose (containing formaldehyde-MOPS) gel electrophoresis for isolated RNA samples from blood.

Figure 6: Denaturing agarose (containing formaldehyde-MOPS) gel electrophoresis for isolated RNA samples from blood.

Table 3: Changes in mRNA level IFN-ɤ due to haemonchosis in two breeds of sheep.

N.B. Vales with different superscription in a row (i.e. a, b, c) and in a column (i.e. x, y, z) differ significantly.
Table 4: Changes in serum IFN-y concentration (pg/ml) due to haemonchosis in two breeds of sheep.

N.B. Vales with different superscription in a row (i.e. a, b, c) and in a column (i.e. x, y, z) differ significantly.
Discussion
The Parasitism in ruminants fluctuates due to various seasonal factors. The parasitic infections are correlated with fitness consequences and epizootiology of each parasite and also on the basis host-parasite relationship, host physiology and local environmental conditions. GI parasites in ruminants is most frequently seen during rainy season in many countries including India when chances the survival of larval stages of various helminths are higher and at the same time when a major part of hosts energy is utilized for reproduction. The haematophages abosomal nematode to Haemonchus contortus is one of the most pathogenic parasites of small ruminants across the world [9]. The role of IFN-y in parasitic resistance is not clear. The predominant function of IFN-y is to drive a Th1 type immune response by down regulating IL-4, inhibiting Th2 cells and promoting Th1 cell concentration [10]. A temporary increase of IFNY Mrna expression on day 7 and then a drop on day 14 post infection in resistant groups might be in response to the invasion of larval stages in the tissue. A similar type of expression was also observed on day 7 post infection with Trichostrongylus colubriformis in sheep [11]. Gill et al. [4] reported that compared to resistant sheep susceptible sheep produce more IFN-y. These studies indicated that protection against haemonchosis is mainly due to Th2 type response. Andronicos et al. (2010) showed that the initial infection did not change the cxcl 10 gene (regulator of IFN-y) expression in the abomasal mucosa of lambs susceptible and resistant to haemonchosis. In subsequent infections susceptible lambs expressed this gene which most likely to made them incapable of establishing a protective Th2 type response.
The cytokine produced by Th2 include IL-4, IL-5, IL-10 and IL-13. On the other hand, Th1 cells secrete IFN-y, IL-2, IL-18 and IL-13. The elevated level of IFN-y concentration in the serum sample of resistant Group of sheep on day 7 after infection suggested that this gene might play an important role in the initial stage of infection with to Haemonchus contortus. The susceptibility and resistance to haemonchosis depend on the type of immune response developed against the parasite. Compared to resistance sheep more IFN-y is produced in susceptible sheep and therefore, susceptibility is most likely associated with a Th1 type response [12,13]. Genetic studies also bolstered these observations. Pernthaner et al. [11] observed that haemonchosis resistant sheep express the genes for IL-5, IL-3 and TNF-ἁ but do not express those of IL-4, IL-10 AND IFN-y. From our findings in the present study, it can be concluded that the haemonchosis is leading to the rhythmic changes in the dynamic immune responses from Th1 type to Th2 type of immune response [14,15]. Furthermore, it was worth undertaking studies on similar line for exploitation of the immune response of the resistant sheep to Haemonchus contortus and the claim that Th1/Th2 dichotomy occurs in ruminants against this parasite.
Funding Source
The present study was funded to the Department of Veterinary Parasitology, CVSc&AH, CAU for post graduate research work under the supervision of first author (No. CAU/CVSc/PhD Res/ Para/2018).
Acknowledgement
The authors duly acknowledged the Dean, Faculty of Veterinary Sciences WBUAFS, Kolkata for providing necessary facilities to conduct the study.
References
- Beriajaya, Copeman DB (2006) Haemonchus contortus and Trichostrongylus colubriformis in pen-trials with Javanese thin tail sheep and Kacang cross Etawah goats. Vet Parasitol 135(3-4): 315-323.
- Jasmer DP, Lahmers KK, Brown WC (2007) Haemonchus contortus intestine: A prominent source of mucosal antigens. Parasite immunol 29(3): 139-151.
- Kaplan RM, Vidhyashankar AN (2012) An inconvenient truth: Global warming and anthelmintic resistance. Vet Parasitol 186(1-2): 70-78.
- Gill HS, Altmann K, Cross ML, Husband AJ (2000) Induction of T helper 1 and T helper 2-type immune responses during Haemonchus contortus infection in sheep. Immunology 99(3): 458-463.
- Else KL, Finkelman FD (1998) Intestinal nematodes parasites, cytokines and effector mechanisms. Int J Parasitol 28(8): 1145-1158.
- Hawking F (1975) Circadian and other rhythms of parasites. Adv Parasitol 13: 123-182.
- Valkiunas G (2005) Avian malaria parasites and other haemosporidia. CRC Press, USA.
- Pfeffer AW, Wilson JA, Pernthaner A (2001) Changes in morphology and key cytokine gene expression following intradermal injection of louse (Bovicola bovis) antigen in sheep with a naturally occurring atopic dermatitis. J Comp Pathol 136(1): 36-48.
- Anon (2013) Annual progress report, All India network programme on gastrointestinal parasitism, Kolkata centre, Department of Veterinary Parasitology, and West Bengal University of Animal and Fishery Sciences, Kolkata.
- Pulendran B (2004) Modulating TH1/TH2 responses with microbes, dendritic cells, and pathogen recognition receptors. Immunol Res 29(1-3): 187-196.
- Pernthaner A, Cole SA, Morrison L, Hein WR (2005) Increased expression of interleukin -5 (IL-5), IL-13, and tumor necrosis factor alpha genes in intestinal lymph cells of sheep selected for enhanced resistance to nematodes during infection with Trichostrongylus colubriformis. Infect Immun 73: 2175-2183.
- Guzman MMA, Ordaz CJA, Anda VJA, Jimenez BA, Hurtado AF (2006) Correlation of parasitological and immunological parameters in sheep with high and low resistance to haemonchosis. Canadian Journal of Animal Science 86(3): 363-371.
- Shakya KP, Miller JE, Lomax LG, Burnett DD (2011) Evaluation of immune response to artificial infections of Haemonchus contortus in Gulf Coast Native compared with Suffolk lambs. Vet Parasitol 181(2-4): 239-247.
- Grillo EL, Fithian RC, Cross H, Wallace C, Viverette C, et al. (2011) Presence of Plasmodium and Haemoproteus in breeding Prothonotory Warbles (Protonotaria citrea: parulidae): Temporal and spatial trends in infection prevalence. J Parasitol 98(1): 93-102.
- Kotze AC, Hunt PW, Skuce P, Von Samson Himmelstjerna G, Martin RJ, et al. (2014) Recent advances in candidate-gene and whole-jenome approaches to the discovery of anthelmintic resistance markers and the description of drug/receptor interactions. Int J Parasitol Drugs Drug Resist 4(3): 164-184.
© 2020 Gautam Patra. This is an open access article distributed under the terms of the Creative Commons Attribution License , which permits unrestricted use, distribution, and build upon your work non-commercially.
Editor In Chief


.jpg)


Signup for Newsletter

Quick Links
 Editorial Board Registrations
 Submit your Article
 Refer a Friend
 Advertise With Us
Our Recent Edition

.jpg)


Top Editors


.jpg)


.bmp)
.jpg)
.png)
.jpg)


.jpg)


.png)

.png)


.png)


Financial Support

Sponsors

Latest e-Books

Latest Video

 a Creative Commons Attribution 4.0 International License. Based on a work at www.crimsonpublishers.com.
Best viewed in
a Creative Commons Attribution 4.0 International License. Based on a work at www.crimsonpublishers.com.
Best viewed in