- Submissions

Full Text
Approaches in Poultry, Dairy & Veterinary Sciences
Comparison of Fluorescent Image Technique for Somatic Cell Counting and Traditional Microscopic Method
Becheva Z1, Ivanov Y1 and GodjevargovaT1*
1Department of Biotechnology, “Prof. Dr Assen Zlatarov” University, Bulgaria
*Corresponding author:Tzonka Godgevargova, Department of Biotechnology, “Prof. Dr Assen Zlatarov” University, Bulgaria
Submission: August 05, 2019;Published: August 12, 2019

ISSN: 2576-9162 Volume6 Issue4
Opinion
Somatic cell count (SCC) in milk is an important characteristic associated with udder health. Somatic cells are mainly leucocytes that protect the animal glands, and a smaller percentage of epithelial cells [1,2]. There are variety methods for somatic cell counting in milk. The standard technique, used all over the world, is the light microscopic method [3]. The probability of errors is high due to subjectivity of the counting. The operator must be well trained and properly educated. Therefore, automatic cell counters, in particular fluorescent image cytometers, are preferable. They save time and allow many samples to be proc essed in a short time. Moreover, there is lower risk for subjective counting and the operators do not need to have special and complex training or education [4]. Also, the fluorescence detection is more selective compared to methylene blue-based microscopic method [5]. There are several companies that offer fluorescent image cytometers: Lactoscan SCC (Milkotronic Ltd, Bulgaria); ADAM-SCC (NanoEnTech Inc, South Korea), NucleoCounter SCC-100 (Chemometec, Denmark) DeLaval Cell Counter (DeLaval Ltd, New Zeland).
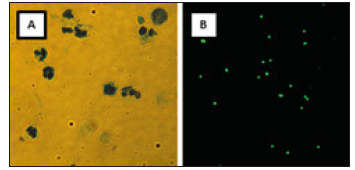
In the present experiment cow milk samples (n = 108) with variety SCC were analyzed. Two different counting techniques were used and compared: a light microscope (reference method) and a fluorescent image cytometer (Lactoscan SCC). The standard microscopic method uses Methylene blue. It is cheap. But one of the disadvantages is the need of trained operator (for example veterinarian). Main problems of this method were artifacts from the dye or parts of cells, and in some cases cell aggregation. So the counting was time-consuming and labor-intensive. These analysis points were observed from other authors too [6]. The mentioned disadvantages were avoided when using the automatic cell counter Lactoscan SCC. The somatic cells in milk samples were stained with fluorescent dye (Sofia Green) which entered in cell nucleus and they turned intensive green. Main privileges of the fluorescent dye Sofia Green are the weak background and the high fluorescence intensity after DNA binding [7]. It was easier to count fluorescent green cells in a black field using the auto-counter than the blue cells in a bright field using the light microscope (Figure 1).
Figure 1:Images of milk somatic cells by a direct microscopic method – Olympus BX51 × 40 magnification (A) and by a fluorescent somatic cell counter – Lactoscan SCC (B).

Moreover, the Lactoscan SCC has an algorithm and counts the cells itself in a few seconds to 1 min, and displays the result. For example, ten samples were counted with Lactoscan SCC only for 10 min, but microscopic analysis was more than 60 min for the same quantity of samples. Therefore, it was a suitable method for the analysis of many samples at a time. That is a great advantage for research works or for farms with a very large number of animals. Furthermore, the fluorescent image technique is more accurate and reproducible. Convincing demonstration of the statements is a lot of sample analysis and statistical processing of the results.
Total number of the analyzed milk samples was 108. The range of SCC in the samples was wide. The lowest SCC was 0.9 × 10⁵ cells/mL, and the highest SCC was 5.4 × 10⁶ cells/mL. All of the samples were analyzed with both devices: the light microscope (Olympus BX51) and the fluorescent image cytometer (Lactoscan SCC). For the statistical processing, each sample was measured 6 times, and the mean value and standard deviation from the mean value were calculated. After that, the coefficient of variation (CV) was determined for each sample [8]. For better presentation of the results, milk samples were summarized into five classes due to their SCC (Table 1). The average values of CV in each class obtained from the light microscope were higher, compared with the values from Lactoscan SCC. The average CV of the counted cells with the microscopic method in the first class (<2 × 10⁵ cells/mL) was high (8.52%) due to fewer cells in the field of view. Also, the CVs of the samples that had more than 1.0 × 10⁶ cells/mL increased significant due to the big crowd of cells in the field of view (CV 18.30%). That was avoided while using the automatic cell counter. The CVs were much lower than those with the microscopic method. Furthermore, increasing of the SCC in the sample showed decreasing of the CV. It was found that there was a good correlation between the methods (correlation coefficient 0.96). Therefore, fluorescent image cytometers can be successfully used for SCC analysis. Consequently, automatic cell counting is preferable technique for SCC of a large number of samples with a wide range of SCC, and especially for SCC in mastitic milks, where the quantity of somatic cells is high.
References
- Boutinaud M, Jammes H (2002) Potential uses of milk epithelial cells: a review. Reprod Nutr Dev 42(2): 133-147.
- Li N, Richoux R, Boutinaud M, Martin P, Gagnaire V (2014) Role of somatic cells on dairy processes and products: a review. Dairy Sci Technol 94(6): 517-538.
- ISO 13366-1:2006 (IDF 148-1:2006) Milk -- Enumeration of somatic cells -- Part 1: Microscopic method (Reference method).
- Alhussien MN, Dang AK (2018) Milk somatic cells, factors influencing their release, future prospects, and practical utility in dairy animals: An overview. Vet World 11(5): 562-577.
- Petersson KH, Connor LA, Petersson-Wolfe CS, Rego KA (2011) Evaluation of confirmatory stains used for direct microscopic somatic cell counting of sheep milk. J Dairy Sci 94(4): 1908-1912.
- Zajac P, Zubricka S, Capla J, Zelenakova L (2016) Fluorescence microscopy methods for the determination of somatic cell count in raw cow’s milk. Veterinární Medicína 61(11): 612-622.
- Atanasova M, Yordanova G, Nenkova R, Ivanov Y, Godjevargova T, et al. (2019) Brewing yeast viability measured using a novel fluorescent dye and image cytometer. Biotechnol Biotec, pp. 1-11.
- Reed GF, Lynn F, Meade BD (2003) Use of coefficient of variation in assessing variability of quant itative assays. Clin Diagn Lab Immunol 10(6): 1162.
© 2019 GodjevargovaT. This is an open access article distributed under the terms of the Creative Commons Attribution License , which permits unrestricted use, distribution, and build upon your work non-commercially.
 a Creative Commons Attribution 4.0 International License. Based on a work at www.crimsonpublishers.com.
Best viewed in


.jpg)


 Editorial Board Registrations
 Submit your Article
 Refer a Friend
 Advertise With Us
.jpg)


.jpg)


.bmp)
.jpg)
.png)
.jpg)


.jpg)


.png)

.png)


.png)


