
- About Us
- Information
-

The Author ensures that the research has been conducted responsibly and ethically with adherence to all relevant regulations. read more..
- For Authors
- For Reviewer
- Manuscript Guidelines
- Membership
- Publication Ethics
-
- Journals
- Reprints
- e-Books
- Videos
- Policies
- Contact Us
 COVID-19
- Submissions


Full Text
Aspects in Mining & Mineral Science
Some Assumptions about the Structure of Oxide Melts
Vladimir Sokolskii1*, Valentyn Davydov1, Volodymyr Kazimirov1, Dmytro Pruttskov2 and Oleksandr Roik1
1Chemistry Faculty, Taras Shevchenko National University of Kyiv, Ukraine
2Department of General Education, Engineering Institute, Zaporizhzhia National University, Ukraine
*Corresponding author:Vladimir Sokolskii, Chemistry Faculty, Taras Shevchenko National University of Kyiv, Kyiv, Ukraine
Submission: October 18, 2023: Published: November 06, 2023

ISSN 2578-0255Volume12 Issue1
Abstract
The structure of oxide melts based on nanoformations (compacted regular clusters) located in a discharged quasi-gas matrix has been proposed. Clusters are formed when crystals melt. The nearest interatomic distances and coordination in the clusters are mostly the same as in the crystals before melting. Compacted clusters are located inside a continuous discharged medium (quasi-gas matrix). The X-ray scattering on the atoms of the oxide melt two parts. The principal contribution of X-ray scattering is due to the scattering from the cluster component of the melt. The diffuse scattering from the quasi-gas matrix makes a relatively weak contribution to the overall diffraction pattern.
Keywords:High-temperature chemistry; Oxide melt; X-ray diffraction; Nanocluster; Quasi-gas matrix
Introduction
The molten state of matter plays a significant role in metallurgy, ceramics, etc. In many cases, the structure of the final commercial product, especially if it is produced from a melt, can hardly be explained. This is due to the fact that the structure of the melt is not practically clear. We have been researching oxide melts for many years. During this time, various binary, ternary, and industrial multi-component systems (mainly welding fluxes) have been investigated. Our experience has shown that the theory of a liquid cannot be limited to the framework of the closest ordering of atoms. The processes occurring in the liquid (melt) are much more complex and diverse. The liquid interacts more efficiently with the contacting medium, whether it is a crystal, gas, or another liquid. This is due to the fact that the particles in the liquid are much more mobile than in the crystal, and the density of the liquid is much greater than in the gas. Short-range order in a liquid state resembles the ordering in corresponding crystalline state. However, the efficiency of the liquid-contact medium interaction is associated with high particle mobility, as in a gas. A model according to which the liquid in many cases can be represented as compacted discrete nanoformations of the crystalline type that fill a rarefied (quasi-gas) matrix has been proposed. As known, materials consisting only of nanoparticles give a diffraction pattern similar to liquid [1].
Therefore, it can be assumed that the diffraction pattern formed by the experiment comes from compacted nanoformations, and the weak diffraction contribution of the quasi-gas matrix does not significantly affect the diffraction pattern. The structure of the short-range order of the melt is normally characterized by the so-called atomic Radial Distribution Function (RDF). In most cases, RDF indicates that the nearest arrangement of atoms in the oxide melt is very much the same as in the corresponding crystal. This is not sufficient to fully describe the structure of the melt. The diffraction experiment says nothing about the arrangements of atoms at medium and long distances. The analysis of the RDF also shows that the structure of the melt is not completely disordered at distances greater than the nearest ones. It should be noted that there is practically no theory of the liquid state, while the advances in physical sciences in the field of crystals and gases are based on full-fledged theories.
For the crystalline state, the ordering in the relative arrangement of atoms or molecules in matter (the solid-state) is repeated at large distances. This makes it possible to develop a full-value theory of crystals, according to which atoms of various types are completely described as a crystal lattice. Each phase of the sample studied has its crystal lattice. In theory, such a lattice is described by the smallest space-averaged group of atoms, which are repeated at regular intervals – a unit cell. Parameters of such a cell correlate with the physical and chemical properties of the phase. Whereas the sum of the properties of the phases in the sample correlates with the properties of the resulting material. The ideal approximation in a crystal is a perfect crystal (a crystal without defects). Many crystals are characterized by anisotropy, i.e., the relationship between physical properties and the direction chosen in the crystal.
The description of a gas state as the state of matter in terms of the molecular kinetic theory gave the most complete and valuable results. First of all, this applies to the so-called ideal gas. Its molecules spend a large share of time in a state of continuous free chaotic motion, drastically changing their speeds and directions only at the moments of short-term collisions. However, the molecular-kinetic theory can successfully explain all the known experimental laws of the ideal gas (the Boyle-Mariotte law, the Gay-Lussac law, Avogadro’s law, etc.). Isotropy is an inherent characteristic of a gas. The physical properties of a gas do not depend on the direction chosen. The size of the space in which a gas is placed does not depend on the size of the elementary particles. The particles of a gas are not ordered. The diffraction pattern of a gas has no discrete maxima. The transfer processes in gases, such as diffusion, viscosity, and thermal conductivity have been explained based on this theory.
Thus, an ideal crystal or ideal gas is the basic approximation for the corresponding aggregate states. So, the process of determining the structure of a real crystal or real gas is in effect based on how much they differ from the ideal state. All basic models of the structure of crystal and gas have been formed based on the ideality principle. As things now stand, only the short-range order term is reliably applied to describe a liquid melt. The ideal model is generally not used to describe liquids, which greatly hinders the development of the theory of melts. The description of the structure of the liquid (melt) should, in our opinion, be based on a strict theory. However, as long as there are no good theories, there are no suitable physical models of the structure of the melt.
Cluster Model of Oxide Melt
With the advances in physicochemical analysis and the accumulation of databases on the properties of oxide melts, researchers used to predict the possible structure of the melt purely qualitatively. Over a long period, the direct methods of studying the structure of the melt by X-ray, electron, or neutron diffraction experiment supported the basic provisions of material scientists. However, the information value of the existing methods for the liquid state was rather insufficient. At this moment, there is a strong need for the development of more acceptable versions of the structure of oxide melt. In [2] we have proposed a new model of melts of complex oxide systems. The basis for the model is a longtime experience of our research into the structure of oxide melts [2-5]. According to this model, the oxide melt is considered to be a completely homogeneous system. As a solid oxide material melts, the system made from compacted nanoformations (products of crystal breakdown) located inside a rarefied and highly disordered matrix is formed. This matrix is close to the gaseous state. The ratio of the fraction of substance in the matrix to the nanoformations depends on external influences - temperature and pressure..
The density of the oxide materials during melting decreases by 10-15%. The dimensions of the nanogrouping have the maximum possible values at relatively low temperatures near the melting point, while the disordered matrix is the least concentrated. As the temperature rises, atoms in the upper layers of the groupings can break off and diffuse into the disordered matrix. Then, at a certain temperature, a diffuse equilibrium between the new compacted nanoformations and the matrix is achieved. In this situation, the number of atoms leaving and joining the nanogroup appears to be equal. At elevated temperatures, the density of the gaseous matrix increases, but the size of the nanogroup decreases. A further increase in temperature can lead to a complete transition of cations and anions of the nanogroupings into a quasi-gas matrix. It is quite possible that in the quasi-gas matrix, there are some nanoformations of the smallest possible dimensions. This contributes to the homogenization and the evaporation rate of the melt.
In the 1990s a certain understanding made its appearance that at the level, matter has some other specific properties. In our work [6] we tried to present the melt in terms of compacted microformations located in a disorderly quasi-gas matrix. At that time, we used the term micelle for microformations, since it was popular in colloidal chemistry. Figure 1 presents two-dimensional probable images of the micelle (in such a way the concept can be better understood) and their arrangement in the quasi-gas matrix. For better perception, the locations of the particles of the quasi-gas matrix in (Figure 1) are not shown.
Figure 1:The micelle core of nanocluster (only atoms are shown) (a); Example of tetrahedral voids in close packing of oxygen atoms in the outer layers of nanocluster (b). The structure of an oxide melt is based on micelles of dense oxygen packing at low (c) and high (d) temperatures [2].

As nanotechnology was progressing, and nanomaterials and new “nano terms” made their appearance, we decided to adapt the term “nano” to the molten state. Taking into account that the microformations (Figure 1) are much smaller than the micelles used in colloidal chemistry, they may be called nanoclusters, nanogroupings or nanoformations. Properties of matter in the molten state can be explained using the peculiarities of the structure and properties of such nanoobjects. According to our present-day views, compacted nanoformations have short-range order and, accordingly, are the main contributors to coherent scattering (Figure 2, curve 2). They, in most cases, retain the shortrange order of the corresponding crystal. However, simultaneously with melting, something similar to the phase transition in the crystal may occur, and the nearest ordering of the atoms may not correspond to the crystalline one before melting. The scattering from the particles in a non-ordering matrix will give a similar contribution to curve 3 in (Figure 2). This type of scattering is likely to have a degree of resemblance to the structural maxima that are detected by gas electron diffraction in gas-like phases [6]. The experimental X-ray scattering curve (curve 1 in Figure 2) is the sum of curve 2 and curve 3.
Figure 2:Experimental X-ray scattering intensity curve by a non-crystalline (liquid or amorphous) material. (1); Dispersion fraction of the cluster component of the melt(2); the proportion of scattering from the quasi-gas component (3).

This paper summarizes some of the authors’ considerations [7-
12] and those of other researchers who hold similar views [13-17].
The results of the research done on complex oxide-fluoride melts
[7] can be summed up as follows:
a. In all the oxide melts we have studied, most of the atoms and
ions tend to some order, based on compacted nanogroupings
that are located in a disordered environment.
b. The basis of the nanogrouping consists of close-packed oxygen
atoms. The inner part of the dense oxygen pack is formed by
tetrahedral and octahedral voids, as it occurs in a crystal.
c. The voids are occupied by cations. The calculation of coordination
numbers from the RDF indicates that each cation is surrounded
by four or six anions. Small cations occupy smaller tetrahedral
voids, as far as larger cations are located in octahedral ones. The
number of cations in a nanocluster tends to compensate for the
negative charge of the dense oxygen pack.
d. A small part of the cations and anions form a disordered quasigas
environment.
e. It can be assumed that mentioned nanogroupings have a
significant negative electric charge. This is due to the fact that
their outer oxygen layer is not compensated, related to the
grouping by the positive charge of the cations.
f. The cations of a quasi-gas matrix are weakly bound to the
nanogrouping. They are mainly concentrated around the outer
oxygen layer. These diffuse cations tend to compensate for
the negative charge of the nanogrouping, however, they have
significant mobility and resemble cations of a quasi-gas matrix
in their properties.
g. The nanoclusters of the oxide melt are affected by compressive
forces (e.g., surface tension and double electric layer). These
forces prevent the enlargement of the nearest interatomic
distances [3,7,8].
h. A small amount of energy destruction of the long-range
order during melting (comparable to the energy of phase
transformations in a crystalline substance). However, this
energy is not comparable to the energy of a crystal lattice or the
heat of boiling.
i. When the long-range order is destroyed during melting, the
crystal splits into small nanogroupings. The nearest ordering
of elementary particles remains within the nanogrouping. Its
dimensions are commensurate with nanoclusters of several
atomic layers.
j. Anions (F-, Cl-, etc.) do not take part in the formation of discrete
oxygen nanogroupings. These anions fill the disordered medium.
Their presence in the nanocluster contributes to the occurrence
of additional stresses inside the nanoclusters and leads to their
destruction.
These are the main points that formed the basis of the model proposed. Earlier, the method for describing the shape of the experimental Intensity Curve (IC) of X-ray scattering by a noncrystalline condensed object has been proposed [3-6]. In these works, the main maximum or all IC were described using the Gaussian curves. Their location and area were determined by the location and relative intensity of the Debye reflections of the corresponding crystalline phase. In the beginning, we considered the area where only the first maximum of IC is located only. This was driven by the great structural information it provided and its good reproducibility. In addition, all the intense Debye reflections were registered in the area of the first and, partially, of the second maximum. These limitations excluded the wide scattering region beyond the first maximum from being analyzed. However, it was this region that significantly determined the RDF.
As a next step, we applied our developments to describe the profile of the experimental IC of a non-crystalline solid material by blurring the Debye reflections of the polycrystal [3]. It is known that a decrease in the size of a crystal leads to a widening of the profile of the diffraction peaks [18]. The widening can be so significant that diffraction peaks are considerably overlapped, and the discrete diffraction curve may take the form of a typical curve that is characteristic of a liquid or solid non-crystalline substance. The curves of this type are shown in Figures 2-4.
Figure 3:Experimental IC of amorphous silica prepared by: (Ia) melting of quartz; (Ib) co-deposition from an aqueous SiF4 solution; Model curves obtained by blurring of β-cristobalite X-ray diffraction lines with some alterations (II) and without them (III).

Figure 4:Data processing with the powder cell of sodium-silicate glass (70 mol. % SiO2. (1)-silica; (2)-Na2Si2O5; (3)-the resulting curve of (1)+(2); (4)-experimental curve

Figure 3 compares the experimental IC of silica with those of crystalline modifications of silica available in the reference database PDF-2. Two samples of amorphous silica: the first one was obtained by melting silica, and the second one was prepared by codeposition from an aqueous SiF4 solution have been also examined. The experimental intensity curves were taken from [19,20]. We have been unable to reach any resemblance between the sets of quartz reflections and the IC of glassy silica. The experimental curves could be most successfully described by a set of the Debye reflections of β cristobalite. The term “fused quartz”, which occurs in the literature to describe glassy (amorphous) silica, appeared to be incorrect.
In Figure 4 the profile of sodium-silicate glass (70 mol. % SiO2) was presented using the blurring of the Debye reflections of silica and sodium disilicate (Na2Si2O5). The profile was described using the PowderCell program. The results obtained almost completely coincided with those received with the help of the programs developed by our team [2,3]. A bar chart of β cristobalite (black squares and lines) and an experimental curve of amorphous quartz (red dots) are shown in Figure 5a. Figure 5b shows the blurring of diffraction lines of β-cristobalite by the Gaussian curves and the total profile of the sum of the Gaussian curves (thick black line). The corrected curve of the improved profile for the diffraction experiment is shown in Figure 5c. To do this, the area of the integral was calculated as the half-width of the Gaussian curve multiplied by its height. The halfwidth was calculated as the difference between the maximum and minimum values of the Gaussian function, taken at a level equal to half of its maximum value. It should be noted that when improving the curve profile, we took into consideration the atomic scattering factors and incoherent scattering. The curves although had to be normalized to arbitrary units in some cases. The determining factor was the convergence of the experimental and calculated profiles.
Figure 5:(a)-Experimental diffraction curve of amorphous silica (red dots) and bar chart of diffraction maxima of β cristobalite; (b)-blurring of diffraction lines of β cristobalite by the Gaussian curves and the combined profile of the Gaussian curves; (c)-the improved profile of β cristobalite (red line) compared to the experimental one (black line).

The mathematical description of the profile enhancement is as follows. The location of the diffraction maximum was selected from a set of Debye reflections calculated according to the Bragg condition:

where d is an interplane distance, n is an order of reflection, θ is a scattering angle, λ is the wavelength of X-rays. The profile of diffraction maximum (corresponding to the interatomic distance d) is described by the Gaussian distribution at each point in θ-space:
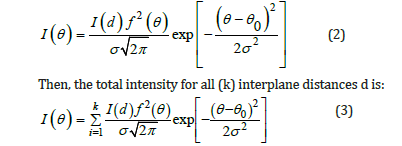
Here I(di) is a relative intensity of the Debye reflections from the
family of planes with the di interplane distance; f2(θ) is the atomic
scattering factor averaged in composition; σ is an integral half-width
(the width of a rectangle equal to the area of the Gaussian curve
(3)). The height of this curve is  which corresponds to the
maximum of the curve (2). It is worth noting that such a description
can be carried out using the Pseudo-Voight approximation.
which corresponds to the
maximum of the curve (2). It is worth noting that such a description
can be carried out using the Pseudo-Voight approximation.
Some problems associated with this technique were described in [3]. While working with the PowderCell to describe the shape of this curve type, a major difficulty was that some reflections (especially those with large (hkl) indices) had to be abandoned in order to obtain a satisfactory similarity of the experimental and reconstructed curves. At that time, we could not find a satisfactory explanation for this fact. But now, while studying melts, we have established the cause of this phenomenon, as stated below. It might be well to point out that melts cannot sufficiently be described by this method than glasses. In glasses, the appearance of polycrystalline formations however begins at the beginning of solidification. But at the same time, these formations cannot be fully formed as crystalline with rapid quenching of a melt. Figure 5 presents a graphic interpretation of constructing a model diffraction pattern of a non-crystalline condensed material by blurring the discrete diffraction maxima. In Figure 5a the red line is the experimental IC of amorphous silica, and the bar diagram belongs to the β cristobalite. Figure 5b shows a representation of each peak of the bar chart on the basis of the Gaussian curve and the combined curve from the sum of the Gaussian curves.
Discussion
Thus, the oxide melt is a combination of compacted nanoclusters located in a quasi-gas matrix consisting of small and more mobile particles. The latter can be atoms, molecules, atomic and molecular groupings, etc. Particles in the matrix behave in the same manner as particles in a real gas. The diffraction pattern of the oxide melt is mainly determined by the nanoclusters, which are formed as a result of the destruction of the crystal and retain its features. As the size of the crystal decreases, its properties may begin to change upon reaching a certain size. The proportion of surface atoms located on the surface and their contribution to the properties of the object becomes more significant and even grows with a further decrease in size (Figure 6). On the surface of an individual nanocluster, the surface tension and electrostatic forces are determining factors. These forces are directed inward and can result in significant compression of the nanocluster. Oxide melts have some considerable differences from other types of non-crystalline condensed materials, and the main one is that the negatively charged dense oxygen packing cannot be fully compensated by positive cations on the surface. Cations from the quasi-gas matrix around the clusters are quite mobile and can create a strong compensatory environment for the cluster. An interesting feature of the nanoclusters is that they have a large number of surface atoms (Figure 6, Table 1), which to be much larger than in the bulk.
Figure 6:The number of atoms on the surface and in the bulk as function of the size of the cluster.

Table 1:Some cluster parameters.

The compressive forces that act on the cluster might cause the cluster to take on a spherically symmetrical shape. As is known, it happens to a small drop of water in free fall. In this case, the force of gravity does not affect the shape of a drop. Under the influence of surface forces, a droplet is compressed and takes a spherical shape. As the size of a drop grows, the spherical shape is noticeably distorted. I may be suggested that the nanoclusters of the oxide melt have a shape close to a spherical one. Figure 1 schematically shows the formation of clusters from a crystal on the 2D model. The formation of a two-dimensional anionic framework from a dense oxygen package is shown only (cations are not shown). At the same time, the quasi-gas matrix, in its structure and properties, is to be close to a gas, and its volume is filled with smaller particles, i.e., atoms, molecules, small complex molecules.
Since two components contribute to the X-ray scattering: one from the nanoclusters themselves, and the second one of the second from the quasi-gas matrix, the diffraction pattern is a superposition of the two contributions, respectively, as shown in Figure 2. Figure 7 compares (in the flat version) the planes in crystal. Figure 7a shows the planes in the crystal in the form of parallel lines, while (Figure 7b-7f & 7i) point out similar sites in the nanoclusters. The planes of the crystal are significantly larger and, accordingly, have abundant scattering centers. Instead of planes, in nanoclusters, there are only “nanocluster sites” in which few scattering centers are located. It is their small size that leads to the blurring of the diffraction lines [18]. Attention should be paid to the fact that in nanoclusters the sites of (i) type have few scattering centers, and the (e) type sites do not have corresponding scattering centers at all.
Figure 7:Potential planes in the crystal (in a two-dimensional form) - (a) and their appropriate analogues in nanoclusters (b), (c), (d), (e), (f), (i).

We would like to suggest that clusters occupy strictly specified locations inside a quasi-gas matrix and are located at well-defined distances from each other (like atoms inside a crystal lattice). The interaction of clusters with a quasi-gas medium is mainly due to the collisions of mobile particles of quasi-gas with clusters. The collisions can lead to the oscillatory movement of the cluster and its rotation. It occurs because of the repulsive forces between the clusters due to their significant negative charge. The scheme of the unit layer of the cluster structure is shown in Figure 8.
Figure 8:The estimated cluster structure of the melt. Cluster cations and filling of gas-like matrix with particles are not shown.

It may be suggested that clusters occupy strictly specified
locations inside a quasi-gas matrix and are located at well-defined
distances from each other (like atoms inside a crystal lattice). For
the previously investigated in our works slag melts the following
conditions for the formation of the dense nanoclusters are
necessary:
i. The atomic fraction of oxygen atoms should be close to 0.6.
ii. Cations can only be located in the tetrahedral and octahedral
voids of the nanocluster.
iii. The size of the nanoclusters is not large, so the attraction force
is significantly lesser than the repulsive forces that act on the
cluster.
Conclusion
a. The structure of a complex oxide melt has a more diverse and
structured character than is postulated according to modern
views.
b. At temperatures near the melting point the oxide melt consists
of discrete nanoformations (nanoclusters) that are arranged in
a quasi-gas continuous matrix.
c. The nature of the interaction between discrete nanoformations
and the continuous disordered matrix is similar to the
interaction of a colloidal micelle and an intermolecular fluid.
d. At low temperatures near melting, the arrangement of
nanoclusters in the liquid is ordered. An increase in temperature
leads to a disorder in the arrangements of nanoparticles, and
to a decrease in their size due to the transition of the upper
layers into a quasi-gas matrix, until the destruction at high
temperatures.
References
- Slouf M, Skoupy R, Pavlova E, Krzyzanek V (2021) Powder nano-beam diffraction in scanning electron microscope: Fast and simple method for analysis of nanoparticle crystal structure. Nanomaterials 11(4): 962.
- Sokolskii V, Roik O, Kazimirov V, Pruttskov D, Yakovenko O, et al. (2022) Cluster structure of complex oxide melts. Mater Today Proc 62: 7731-7737.
- Sokolsky VE, Kazimirov VP, Shovsky VA (1995) Crystallography 40(6): 989-991.
- Sokolsky VE, Kazimirov VP, Shovsky VA, Galinich VI (1989) Rasplavy 2: 47.
- Sokolskiy VE, Kazimiirov VP, Roik AS (2018) Ukr Chem J 84(5-6): 11-19.
- Khargittai M, Khargittai I (1976) Geometry of molecules of coordination compounds in the vaporous phase. Mir, Moscow, Russia.
- Shpak AP, Sokolsky VE, Kazimirov VP, Smyk SY, Kunutsky YA (2003) Structural features of melts of oxide systems. Akademperiodika Kyiv, Ukraine.
- Sokols’kii VE (1998) Russ Probl Spec Electrometall 51: 66-73.
- Sokolsky VE, Shovsky VA, Kazimirov VP, Galinich VI (1999) Russ Proc Univ Black Met 5: 3-14.
- Sokolsky VE, Shovsky VA, Kazimirov VP, Galinich VI (1991) Russ Proc Univ Black Met 5: 3-6.
- Sokol’skii VE, Kazimirov VP, Lisnyak VV, Roik OS, Goncharov IA, Galinich VI (2015) Welding fluxes: Structural and physicochemical aspects of slag melts. The University of Kyiv, Kyiv, Ukraine.
- Sokolskii VE, Kazimirov VP, Lisnyak VV, Roik OS, Goncharov IA, et al. (2015) In: Wythers MC (Ed.), Nova Publishers, New York, USA, pp. 95-128.
- Ezikov VI, Sheludko MA, Chukmarev SK, Voznik VS (1986) Russ Proc Univ Black Met 3: 4-9.
- Denisov VM, Belousova NV, Istomin SA, Bakhvalov SG, Pastukhov EA (1999) Structure and Properties of Molten Oxides, URO RAN, Ekaterinburg, Russia.
- Brook LB, Toporischev GA (1981) In Sverdl Proc Int Conf Sverdlovsk. pp. 16-20.
- Malinovsky VK, Novikov VN, Sokolov AP (1993) Russ Physics-Uspekhi 163: 119-124.
- Polukhin VA, Rigmant LK, Potemkina EV (2001) Chelyabinsk-2001 Proc. X-Th Russ Conf, Chelyabinsk, Russia, pp. 130-134.
- Hayker DM, Zevin LS (1963) X-Ray Diffractometry. Fizmatgiz, Moscow, Russia.
- Sokolsky VE, Kazimirov VP, Shovsky VA (1985) Izv AN SSSR Inorgan Mater 21: 123-129.
- Sokolsky VE, Shovsky VA, Sidorchuk VV, Luchuk EG, Kazimirov VP (1989) Izv AN SSSR Inorgan Mater 25: 1178-1181.
© 2023 Vladimir Sokolskii. This is an open access article distributed under the terms of the Creative Commons Attribution License , which permits unrestricted use, distribution, and build upon your work non-commercially.
Editor In Chief


.jpg)


Signup for Newsletter

Quick Links
 Editorial Board Registrations
 Submit your Article
 Refer a Friend
 Advertise With Us
Our Recent Edition

.jpg)


Top Editors


.jpg)


.bmp)
.jpg)
.png)
.jpg)


.jpg)


.png)

.png)


.png)


Financial Support

Sponsors

Latest e-Books

Latest Video

 a Creative Commons Attribution 4.0 International License. Based on a work at www.crimsonpublishers.com.
Best viewed in
a Creative Commons Attribution 4.0 International License. Based on a work at www.crimsonpublishers.com.
Best viewed in