- Submissions

Full Text
Aspects in Mining & Mineral Science
Supercritical Fluids Conserved as Fluid and Melt Inclusion in Quartz from the Sheba-Gold Mine, Barberton, South Africa
Rainer Thomas1*, Paul Davidson2, Adolf Rericha3 and Ulrich Recknagel4
1Im Waldwinkel 8 D-14662 Friesack, Germany
2Codes, Centre for Ore Deposits and Earth Sciences, University of Tasmania, Hobart 7001, Australia
3Alemannenstraße 4a, D-144612 Falkensee, Germany
4Böhmerwaldstraße 22, D-86529 Schrobenhausen, Germany
*Corresponding author: Rainer Thomas, Im Waldwinkel 8 D-14662 Friesack, Germany
Submission: February 01, 2023;Published: February 14, 2023

ISSN 2578-0255Volume10 Issue5
Abstract
Our fluid inclusion study found some primary alkali-rich fluid inclusions in quartz besides the dominant secondary fluid inclusions with native gold. Other unusual observations are graphene and alkali-rich fluid inclusion, whose vapor phases are composed of 13C-rich methane and 13C-rich CO2. Furthermore, we found an inclusion with a micro-diamond crystal and one melt inclusion with moissanite.
Keywords:Native gold; Daughter crystals of gold; 13C-Rich methane; Graphene; Supercritical fluid
Introduction
The Sheba gold mine is located 13 miles N.E. of Barberton, South Africa. Mining started in 1885. The deposit is characterized by hydrothermal, fault/shear-hosted zones of mineralization in the Archean meta-sedimentary rocks of the Barberton Greenstone Belt [1]. However, there is only a little information about the genesis of this famous deposit.
Sample and Methods
Sample
As a sample for the study, we used double-polished quartz chips with a thickness of 500μm. We used only SiC F10 and F3 (10 and 3μm) powder for grinding and a suspension of Al2O3 in water for polishing. For the preparation, we used in no case diamond. The sample was given by Prof. L. Baumann from the Mining Academy Freiberg in 1980 as reference material.
Methods
For our preliminary studies, we used only microscopic and Raman spectroscopic methods. We have performed all microscopic and Raman spectroscopic studies with a petrographic polarization microscope coupled with the EnSpectr Raman spectrometer R532. The Raman spectra were recorded in the spectral range of 0-4000cm-1 using a 50mW single-mode 532nm laser, an entrance aperture of 20μm, a holographic grating of 1800g/mm, and a spectral resolution ranging from 4-6cm-1. Depending on the grain size, we used objective lenses with a magnification varying from 3.2x to 100x. We used the Olympus long-distance LMPLFLN100x as the 100x objective lens. The laser energy on the sample is adjustable down to 0.02mW. The Raman band positions were calibrated before and after each series of measurements using the Si band of a semiconductor-grade silicon single-crystal. The run-to-run repeatability of the line position (based on 20 measurements each) is ±0.3cm-1 for Si (520.4±0.3cm-1) and 0.5cm-1 for diamond (1332.3±0.5cm-1 over the range of 80-2000cm-1). We used a water-clear natural diamond crystal as a diamond reference [2].
Results
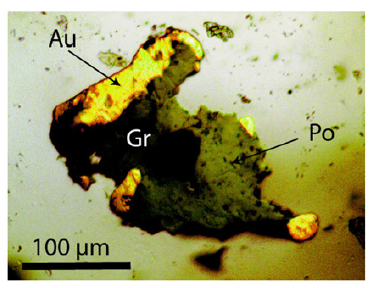
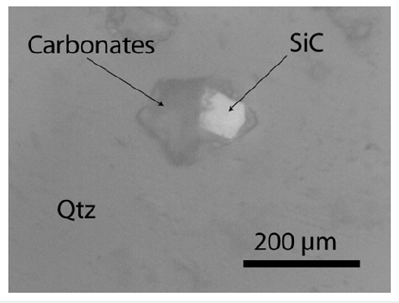
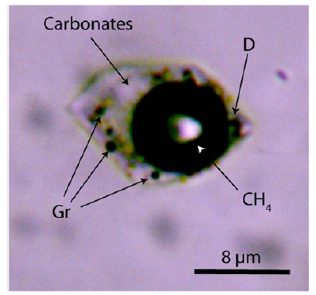
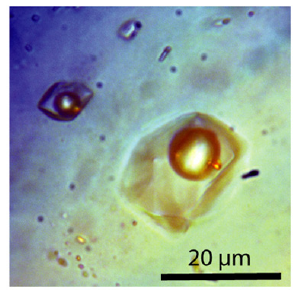
The quartz contains abundant secondary fluid inclusions and very rare nahcolite-rich, alkaline-earth carbonate-bearing fluid and melt inclusions with primary characteristics. The alkaline-earth carbonates are calcite, magnesite, and dolomite. The vapor phase of this carbonate-rich inclusions is mostly pure CH4 with 13CH4>>12CH4 [3] because of the methane band at 2914.1±0.3cm-1, FWHM=4.4cm-1 (n=13). The 12CH4-reference (fluid inclusion in cassiterite) gives 2919.1cm-1 with an FWHM=3.3cm-1. Numerous solid mineral inclusions in quartz are often spherical: graphite, calcite, gold, goldtellurites, and arzakite [Hg3S2(Br,Cl)2]. Gold often forms spherical aggregates with graphite-like material. However, there are also larger aggregates of gold, graphite, and pyrrhotine (Figure 1). Gold has extreme reflectivity, so the brightest sulfides appear relatively faint [4]. Some carbonate-rich fluid and melt inclusions contain spherical gold, graphite, and moissanite particles (Figures 2a & 2b). Nahcolite [NaHCO3], with the strong Raman band at 1046cm-1, is the dominant species. Such inclusions give a rough estimation of more than 10,000ppm Au (Figure 3). Such values in a fluid or melt are entirely unusual. The solubility of gold is under hydrothermal conditions in the order of <1ppm. In a classical sense, we interpret this gold as accidentally trapped from a supercritical fluid. However, the solubility of gold in a reduced supercritical alkali-carbonaterich fluid is quite unknown, probably in the presence of graphene, Graphene Oxide (G.O.), and especially Reduced Graphene Oxide (RGO), it may be very high [5]. An unexpected result of our Raman work was finding different graphene types, such as graphene, G.O., and RGO in the spherical gold in quartz. These graphene types are suspended in all gold globules. The determination is quite simple because gold as face-centered cubic (fcc) metal has no optical phonons – therefore, it shows no Raman bands. Thus, the detection of the graphene types is straightforward (see Figure 4, [6,7]).
Figure 1:Gold (Au), pyrrhotine (Po), and graphite (Gr) in quartz (Qtz) of the Sheba mine.

Figure 2a:A moissanite-bearing melt inclusion (accidentally trapped) deep under the sample surface in quartz from the Sherba mine. The carbonates are composed of nahcolite and calcite. The 80-90μm large moissanite crystal is significantly larger than the used SiC F10 powder for grinding. The inclusion is about 25μm deep in the 500μm thick polished quartz slide.

Figure 2b:An alkali carbonate-rich melt inclusion in quartz of the Sherba mine. Gr–graphite, CH4–methane, D–blue micro-diamond (first order Raman band: 1331.5±4.9cm-1).

Figure 3:Alkali-carbonate-rich fluid inclusion in quartz with three spherical gold particles. The micro photomicrograph is a combination of transmitted and reflected light.

Figure 4:Raman spectrum of graphene on gold from the Sheba mine. This graphene is a mixture of graphene, Graphene Oxide (G.O.), and Reduced Graphene Oxide (RGO)–see [6]. The D band at 1352cm-1 and the G band at 1586cm-1 represent the dominance of reduced graphene oxide. The G peak at 1586cm-1 and the 2D peak at 2664cm-1 result from a light-increased 13C concentration [7]. The broad 2D features between 2700 and 3000cm-1 can be attributed to Graphene Oxide (G.O.).

During the formation of the deposit, reduced conditions dominated, as indicated by graphite, graphene, methane, and moissanite. All of our observations imply the involvement of a goldcarbon- bearing supercritical fluid from mantle depth moving very rapidly to the place of the gold mineralization. The relatively large carbon isotope scatter of methane from the fluid phase of melt, and secondary fluid inclusions are also remarkable. The position of the methane Raman band is 2914,4±1.6 (n=35). This value corresponds to pure 13CH4. With a decrease in the temperature (an increase in the oxidation state), methane disappears completely, and CO2 becomes dominant. Here the 13C content of CO2 is also high (~35,6 %). A very deep carbon source is highly probable [8]. As an explanation for the primary enrichment of heavy methane (13CH4) in fluid inclusions, we suggest it may be due to the selective adsorptive separation of 13CH4 by graphene pores on gold surfaces responsible [9].
Conclusion
Our contribution shows some unexpected results: a very high concentration of gold in alkali-rich fluid inclusions and a remarkably high 13C content of the inclusions gas phase. A careful study of this gold quartz sample must be done in the future. Here we want to concentrate only on the key features.
References
- Jones C, Kisters A (2022) Regional and local controls of hydrothermal fluid flow and gold mineralization in the Sheba and Fairview mines, Barberton Greenstone Belt, South Africa. Ore Geology Reviews 144: 104805.
- Thomas R, Davidson P, Rericha A, Recknagel U (2022) Water-rich coesite in prismatine-granulite from Waldheim/Saxony. Veröffentlichungen Naturkunde Museum Chemnitz 45: 67-80.
- Vitkin V, Polishchuk A, Chubchenko I, Popov E, Grigorenko K, et al. (2020) Raman laser spectrometer: Application to 12C/13C isotope identification in CH4 and CO2 greenhouse gases. Applied Sciences 10(21): 7473.
- Ramdohr P (1975) The ore minerals and their intergrowths. Academy Publishers, Berlin, Germany, p. 1277.
- Li F, Zhu J, Sun P, Zhang M, Li Z, et al. (2022) Highly efficient and selective extraction of gold by reduced graphene oxide. Nature Communications 13: 4472.
- Hidayah NMS, Liu WW, Lai CW, Noriman NZ, Khe CS, et al. (2017) Comparison on graphite, graphene oxide and reduced graphene oxide: Synthesis and characterization. AIP Conference Proceedings 1892(1): 150002.
- Carvalho BR, Hao Y, Righi A, Rodrigues-Nieva JF, Colombo L, et al. (2015) Probing carbon isotope effects on the Raman spectra of graphene with different 13C Physical Reviews B92: 125406.
- Cartigny P (2005) Stable isotopes and the origin of diamond. Elements 1(2): 78-84.
- Ujjain SK, Bagusetty A, Matsuda Y, Tanaka H, Ahuja P, et al. (2021) Adsorption separation of heavier isotope gases in subnanometer carbon pores. Nature Communication 12: 546.
© 2023 Rainer Thomas. This is an open access article distributed under the terms of the Creative Commons Attribution License , which permits unrestricted use, distribution, and build upon your work non-commercially.
 a Creative Commons Attribution 4.0 International License. Based on a work at www.crimsonpublishers.com.
Best viewed in


.jpg)


 Editorial Board Registrations
 Submit your Article
 Refer a Friend
 Advertise With Us
.jpg)


.jpg)


.bmp)
.jpg)
.png)
.jpg)


.png)

.png)


.png)


