
- About Us
- Information
-

The Author ensures that the research has been conducted responsibly and ethically with adherence to all relevant regulations. read more..
- For Authors
- For Reviewer
- Manuscript Guidelines
- Membership
- Publication Ethics
-
- Journals
- Reprints
- e-Books
- Videos
- Policies
- Contact Us
 COVID-19
- Submissions


Full Text
Aspects in Mining & Mineral Science
Theories and Trends in Porosimetry
Michail Chalaris*, Ramonna Kosheleva and Athanasios Mitropoulos
Department of Chemistry, School of Science, International Hellenic University, Greece
*Corresponding author: Michail Chalaris, Department of Chemistry, School of Science, International Hellenic University, Ag. Loukas, Kavala, 65404, Greece
Submission: December 01, 2022;Published: January 09, 2023

ISSN 2578-0255Volume10 Issue3
Abstract
This paper presents the theories that are the most widely used in surface science. The BET theory is belonged to them and used for the calculation of surface areas of solids by physical adsorption of gas molecules. Several similar methods are used for the micropore characterization such as V–t method, the Alpha–s, the MP, the DR, the DA, the HK and the SF. Also, the Pore Size Distribution (PSD) of porous media can be calculated with the use of several methods. Furthermore, mercury porosimetry gives information such as surface area. This study describes the theoretical basis of the basic theories for micro-, meso– and macro- pores characterization and provides information which can be extracted from the mentioned techniques.
Keywords:Porosimetry; Gas sorption; Pore size distribution; Porous media
Introduction
Porosity is the pore space in a material. Internal surface of the material comprises the pores and cracks that are deeper than they are wide. Porosity refers also as void fraction and is a measure of “holes” in a material. There are many techniques to characterize the internal structure of powders or porous solids. The two most reoffered techniques for the porous characterizations are the gas sorption and the mercury porosimetry. According to IUPAC, porous are classified in three categories; micropores (pore diameter <2nm), mesoporous (2nm
Figure 1:Pore diameter ranges determined with nitrogen adsorption and mercury porosimetry.

Gas Sorption
The physical and chemical process, by which one substance becomes attached to another or released from it, is called sorption. The sorption is divided into two processes: adsorption and desorption. In adsorption procedure, a film of the adsorbate created on the surface of the adsorbent. Desorption is the opposite process of sorption. A simple schematic of the sorption procedure is described in Figure 2. Several methods are developed, based on the gas sorption for the porous characterization. The most used of them are BET, Langmuir, V–t, DR, DA, etc which will be described in the following sub-chapters. In Figure 3 presents the different pores characterization methods according to different relative pressures.
Figure 2:Simple schematic for adsorption and desorption mechanism.

Figure 3:Different pores characterization methods according to different relative pressures.

BET method
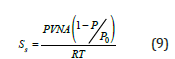
The BET theory is the most widely used method in surface science for the calculation of surface areas of solids by physical adsorption of gas molecules such as N2, He, Ar, Kr, etc. The BET theory was published in the Journal of the American Chemical Society, in 1938, by Brunauer et al. [2]. Two different expressions of BET method can be found, the Single Point Method and the Multi Point Method. For the calculation of Surface Area of solid materials, the BET equation is:
Where, P: is the equilibrium pressure of adsorbates (Pa) Po: is the saturation pressure of adsorbate (Pa) U: is the adsorbed gas quantity (mol g-1) Um : is the monolayer adsorbed gas quantity (mol g-1) c: is the BET constant
The BET constant is related to the energy of adsorption for the first layer. If El is the heat of adsorption for the first layer, and E2l is equal with the heat of liquefaction, R is the molar gas constant (8.314Jmol-1K-1) and T is the temperature in Kelvin degrees, the BET constant is described as:
Figure 4:Typical BET plot.

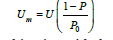
Multipoint BET method: The BET plot, is maintained in the range of 0.05
in the linear plot of the

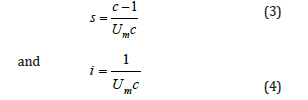
The total surface area (S) of the sample can be calculated from:

where,
M : is the molar mass of the adsorbate
N: is the Avogandro number (6.0221415x10²³ molecules/mol)
and
A: is molecular cross–sectional area of the adsorbate molecule
(Angstroms).
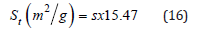
At the end, if the total surface area (S) is divided by sample weight (W), the specific surface area is:

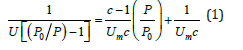
Single point BET method: The Single Point BET method is used for a fast calculation of the specific surface area compared with the multipoint BET method and it used for routine measurements, if the value of c is sufficiently large to ignore the value of i [3]. The equation (1) becomes:
and after the combination with the ideal gas equations,
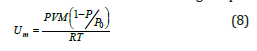
For the calculations of the previous parameters, needs only to measure the amount of nitrogen adsorbed at only one relative pressure (usually near to 0.3)
Langmuir method [4]
The Langmuir equation is a simplified equation of the BET equation and can be used only in Type I adsorptions isotherms. If W is the weight of adsorbate at a P/P0 and Wm is the weight of a monolayer and C is constant associated with the energy of adsorption (is not the BET constant) the equation is
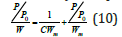
The Langmuir Plot is a plot of (P/P0)/W versus P/Po. From the slope of Langmuir plot, is possible the calculation of the weight of monolayer Wm. From the Langmuir equation can calculate the surface area with the use of equation 5. The limitation of Langmuir method is not applicable to characterize micro and meso porous materials [4].
Harkins–Jura (HJ) method
Another method for the determination of the surface area is the Harkins – Jura method (HK) [5]. The HK method is an empirical method and does not require the volume of gas which is required to form a mono molecular layer. The HK method involves the gas pressure P and the volume of adsorbed gas, which were measured during the experiments.
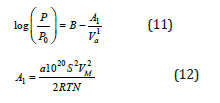
Where, P: is the gas pressure P0: is the saturation vapor pressure B: is a constant Va: is the volume of adsorbed gas a: is a constant S: is the specific surface area Vm: is the molar volume of gas N: is the Avogadro number R: is the gas constant T : is the temperature
The HJ plot is a plot of (1/Va2) versus log (P/Po) and solving the previous equation as per S, can calculate the specific surface area. The HJ can be used for the S in the region of 0.01
.
Micropore Characterization
Several similar methods are used for the micropore characterization. The most commons are: V–t method, the Alpha–s, the MP, the DR, the DA, the HK and the SF. One of the most popular methods to calculate the thickness of a layer of adsorbate on the porous walls at a certain relative pressure is with the use of a V-t Plot. The V–t plot is a plot of the volume of the gas absorbed versus the statistical thickness t of an adsorbated film. Three different, but similar equations can be used, for the calculation of the statistical thickness in the V–t method. The three equations are:
a. de Boer [6]
b. Carbon Black [7]
c. Halsey [8]
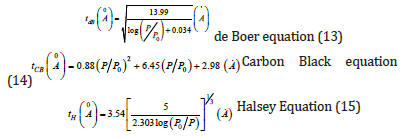
Figure 5:Typical t – plot from type II isotherm.

Figure 6:Typical plot for the t calculation.

All the previous equations are used only for nitrogen adsorption at the temperature of 77K. If the gas and temperature are different, constant numbers used in the equations must be changed. A typical t–curve shown in Figures 5 & 6. From the slope of t–plot it is easy to calculate the total surface area with the use of equation:
Where s is the slope of t plot. When the intercept of the plot multiplied by 0.001547, give the micropore volume.
Alpha–S method [9]/
The Alpha–S method, like the t-plot but compares experimental data on porous solids with adsorption on selected standard materials. It allows us to determine not only the content of micropores but also mesopores as well as macropore/external area. I is most often used for N2 data, but it can be used also for other adsorbates. However, every type of adsorbate the determination of a fixed relative pressure is required. The fixed relative pressure is 0.4 for nitrogen.
MP method or micropore analysis method [10]
In Mikhail et al. [10] propose an extension to the de Boer’s t – method for micropore analysis. The advantage of this method is that the calculation of t is independent of the solid. The value of t comes from the equation:
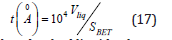
Where the Vliq is the adsorbed liquid volume.
Then, the values of t used for the construction of V versus t plot. Using linear slopes constructed for t – values intervals from the origin to 4 Angstrom, 4 to 4.5 Angstrom, etc. When the slope stops decreasing, then the calculation stops also. Pore volumes can be calculated, using the relation:
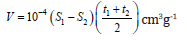
Where, S1: is the surface area calculated from slope 1 S2: is the surface area calculated from slope 2 t(1A ) : is the thickness at beginning of interval used for slope 2 t(2A ) : is the thickness at the end of interval used for slope 2
DR–method (Dubinin – Radushkevich) [11]
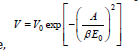
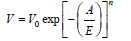
The DR method is used to express the adsorption isotherms in micropores. For the use of DR equation, is required a saturation pressure, which is not defined for supercritical conditions. According to Dubinin and Radushkevich, a Gaussian fuction can be used to express the fraction of the adsorption volume V occupied by liquid adsorbate at various adsorption potentials ε.
Where,
V: is the adsorption volume
V0: is the micropore volume
A: is the free energy of adsorption and expressed as
A=ε=RTln(P/P0)
β: is the affinity coefficient and can be calculated by the
equation
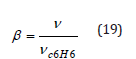
v: is the liquid molar volume of a given adsorbate
vC6H6: is the molar volume of benzene as the reference liquid

A plot of isotherm data as log(V) versus [log(P/P0)]2 is used for the calculation of micropore volume and for the characteristic energy of adsorption. The DR method is used at P/P0<0.01.
DA–method (Dubinin – Astakhov) [12]
In Dubinin et al. [12] proposes another equation for the calculation of micropores volume and especially when the DR method fails to linearize the adsorption data. The DR equation is used for materials with heterogeneous distributions or strongly activated carbons.
Where,
V: is the volume adsorbed
V0: is the limiting micropore volume
E: is the characteristic energy of the system
A : is the adsorption potential and expressed as
( ) A = ε = RT ln P P0 (22)
R: is the gas constant
T: is the equilibrium temperature
P0: is the saturated pressure
The equation 21 can expressed as :
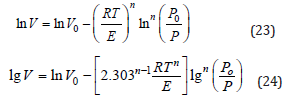
A plot of lgV versus


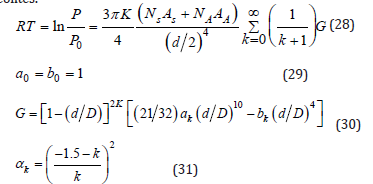
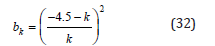
HK – method (Horvath – Kawazoe)
In Horvath et al. [13] developed a method for the finding of the pore size distribution in microporous carbons using nitrogen adsorption measurements at 77K [13]. This method is independent of the assumption of capillary condensation phenomenon. The HK method is a semi–empirical method and describes the adsorption potential function within slit–like micropores as a function of the effective pore width. The HK equation is:
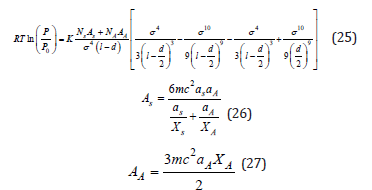
Where, R: is the gas constant T: is the equilibrium temperature P0: is the saturated pressure K: is the Avogadro number Ns: is the number of atoms per unit area of adsorbent NA: is the number of molecules per unit area of monolayer of adsorbate AA: is the Kirwoof – Mueller constant of adsorptive AS: is the Kirwoof – Mueller constant of adsorbent σ: is 0.858d/2 l: is the distance between 2 layers of adsorbent d: dS+dA dS: is the diameter of the adsorbent molecule dA: is the diameter of the adsorbate molecule m : is the mass of electron c: is the speed of light αs: is the polarizability of adsorbent αA: is the polarizability of adsorptive χs: is the magnetic susceptibility of adsorbent χA: is the magnetic susceptibility of adsorptive
SF – method (Saito–Foley)
As alternative to HK method is the SF method which was proposed by Saito et al.[14]. The SF method is independent of the assumption of capillary condensation phenomenon as HK method. Is better for solids that usually have cylindrical pore geometry like zeolites.
Density functional theory method (DFT)
In the decade of 1980’s, several articles published in the field of fluid behavior in non-homogeneous systems [15-18]. In 1990’s the Density Functional Theory applied as a practical method for reducing isotherm data [19-22], finally in 2000’s different DFT models applied to a variety of adsorbent – adsorbate systems and pore shapes [23-26]. The molecular simulations with monte carlo, the DFT method and the molecular dynamics provides more accurate results in pore size analysis than BJH, HK and SF methods. Usually, a combination of Non Local DFT and of Grand Canonical Monte Carlo Simulation is used to describe the local fluid structure near curved solid walls. The relation between isotherms determined by microscopic approaches and the experimental isotherm on a porous solid can be interpreted in terms of a Generalized Adsorption Isotherm equation :
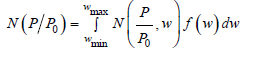
N(P/P0)is the experimental adsorption isotherm data
W is the width of the pore
N(P/P0 ,w) is the isotherm on a single pore of width (w)
f(w) is the PSD function
Many different methods (NLDFT and GCMC) have been
developed and used nowadays.
Fractal dimension methods
In 1983, Avnir and Pfeifer introduced first time the fractal Analysis from nitrogen isotherms [27,28]. The roughness of the surface structure of different solids can be determined by the fractal dimension D. Usually, a real surface varies between 2 and 3. The determination of D can be found, using different methods, but two of them are the most popular. These two are the Frenkel – Halsey – Hill (FHH) method and the Neimark – Kiselev (NK) method.
Frenkel – Halsey – Hill (FHH) method: The FHH model for multilayer adsorption is a method which determines surface fractal dimensions from a single adsorption isotherm. The surface fractal dimension by FHH model according to the following equation is:
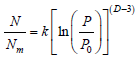
where N is the number of adsorbed moles of nitrogen at the given relative pressure (P/P0) and Nm is the number of adsorbed moles in monolayer. The values of Nm and N can be obtained from the Brunauer–Emmet–Teller (BET) model equation. The surface fractal dimension, D , can be calculated from the slope of a plot of ln(N/Nm) versus ln[ln(P0/P)].
Neimark – Kiselev (NK) method: The NK method is a combination of Neimark and Kiselev equations/fractal and thermodynamic arguments. The capillary condensation fractal surfaces follow the equation …
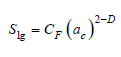
Where,
D : is the fractal dimension
CF: is a constant
ac: is the mean radius of curvature between the adsorbate –
vapor interface
S(r) is expressed in terms of the adsorbate–vapor interfacial
area Slg that, in turn, is given by the Kiselev equation [28]:
equation(4)
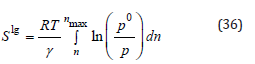
With R being the universal gas constant; T the adsorption temperature; γ the l–g interfacial surface tension; Vm the adsorbate molar volume; p/p0 the relative pressure (where p0 is the saturation pressure); and finally, n and nmax are the amounts of gas adsorbed at p/p0 and at saturation, respectively.
Mesopores Characterization
Barrett–Joyner–Halenda method (BJH) [29]
The Pore Size Distribution (PSD) can be calculated with the use
of BJH method. The assumptions for the BJH method use are:
a. All pores have cylindrical geometry and
b. All pores are filled with liquid when the relative pressure is
closed to 1.
The BJH method is based on the reducing of the thickness of adsorbed layer of a pore, in the case of the relative pressure is lower than 1. At the same time, the radius of the inner capillary is reduced also. If the procedure continues and the relative pressure becomes lower, then the volume of liquid desorbed includes the condensate from the next larger size pores and the second thinning of the physical adsorbed layer. This mechanism expressed from the equation:
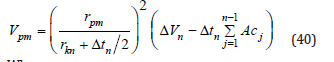
Where, Vp: is the pore volume rp: is the pore radius rK: is the inner capillary radius Δt_: is the thickness of adsorbed layer of nitrogen Ac_: is the area exposed by the pore from which the adsorbed gas is desorbed.
The factor Ac can be calculated from the area of each pore. The area of each pore is a constant and expressed as:

Dollimore and heal method (DH) [30]
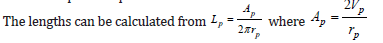
A similar to the BJH method for the PSD is the DH method. The assumptions are: all pores have cylindrical geometry and are emptied of condensate previous desorption steps. The DH is simpler than BJH, because of the fact tn VΔ is calculated from the equation:
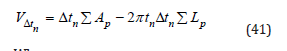
Where Σ Lp : is the lengths of all the pores emptied of condensate in previous desorption steps Σ Ap : is the areas of all the pores emptied of condensate in previous desorption steps
Favvas – mitropoulos – stefanopoulos method (FMS)
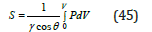
In Favvas et al. [31] propose a simple equation for accurate mesopore size calculations. The FMS method is an empirical method which satisfies the thermodynamic requirements of capillary vaporization and allows a calculation of the mean pore size. The simplest form, for the calculation of pore radius of a mesoporous material is given by the equation:
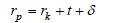
Where, rp: is the pore radius rk: is the kelvin radius t: is the thickness of the adsorbate film δ: is a correction term for the interaction between adsorbate and substrate
Based on experimental data, they propose a reduced version of equation (43) which overtakes many of the standard method limitations without loss of simplicity. The FMS equations is:
Macropores Characterization
The most appropriate method for macropores characterization (pores with width more than 50nm) is the mercury porosimetry. Mercury porosimetry gives information such as surface area, Pore size distribution, pore size, length and particle size distribution, porosity, tortuosity, permeability, fractal dimension etc. This characterization technique is based on the external pressure which is needed to force the mercury into a pore, against the reverse force of the mercury surface tension. Mercury porosimetry is based on Washburn equation [32]:

Where,
P: is the pressure (Kg/m2)
r: is the pore radius
γ: is the surface tension (480mNm-1 for mercury)
θ: is the contact angle (140o)
Figure 7:Mercury intrusion curve.

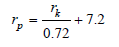
and represent the relation between pore radius and pressure. The surface area (S) calculated from the curve which is an intrusion curve and is a plot of penetration curve versus pressure and radius [33] (Figure 7). The equation for the calculation of surface area is
The mean pore diameter can be calculated by [34]
Where dm is the mean pore diameter, Vt is the total mercury volume and S is the surface area. The volume pore size distribution [35] Dvd is defined as the pore volume per unit interval of pore diameter (d) and given by
Conclusion
In this study, the theories are the most widely used in surface science have been presented. Firstly, described the methods for the determination of the surface area such as BET Method, the alternatives Multipoint BET Method & Single Point BET Method, Langmuir method and Harkins – Jura (HJ) Method. Secondly described the methods used for the micropore characterization such as V – t method, the Alpha – s, the MP, the DR, the DA, the HK, the SF, the DFT and the Fractal Dimension Methods. Moreover, presented the methods used for the calculation of the Pore Size Distribution (PSD), the Barrett – Joyner – Halenda Method (BJH), the Dollimore and Heal Method (DH) and the Favvas – Mitropoulos – Stefanopoulos Method (FMS). Finally, described the mercury porosimetry as the most appropriate method for macropores characterization.
References
- (1972) IUPAC manual of symbols and terminology, colloid and surface chemistry. Pure Appl Chem 31: 578.
- Brunauer S, Emmett PH, Teller E (1938) Adsorption of gases in multimolecular layers. J Am Chem Soc 60(2): 309-319.
- ISO 9277, Determination of the specific surface area of solids by gas adsorption – BET method.
- Langmuir I (1918) The adsorption of gases on plane surfaces of glass, mica and platinum. J Am Chem Soc 40(9): 1361-1403.
- Harkins WD, Jura G (1944) Surface of solids. X. extension of the attractive energy of a solid into an adjacent liquid or film, the decrease of energy with distance, and the thickness of films. J Am Chem Soc 66(6): 919-927.
- de Boer JH, Verwey EJW, Santen JH (1948) Cation arrangement in spinels. J Chem Phys 16(12): 1091.
- Magee RW (1994) Evaluation of the external surface area of carbon black by nitrogen adsorption. Rubber Division of the American Chemistry Society, US.
- Halsey GD (1938) Physical adsorption on non‐uniform surfaces. J Chem Phys 16: 931.
- Sing KSW (1970) Surface area determination. In: Everett DH, Ottewill RH (Eds.), Butterworths, London, p. 25.
- Mikhail RS, Brunauer S, Bodor EE (1968) Investigations of a complete pore structure analysis: I. Analysis of micropores. J Colloid Interface Sc 26(1): 45-53.
- Dubinin MM, Radushkevich LV (1947) The equation of the characteristic curve of activated charcoal. Proceedings of the Academy of Sciences, Physical Chemistry Section 55: 331.
- Dubinin MM (1960) The potential theory of adsorption of gases and vapors for adsorbents with energetically nonuniform surfaces. Chem Rev 60(2): 235-241.
- Horvath G, Kawazoe K (1983) Method for the calculation of effective pore size distribution in molecular sieve carbon. J Chem Eng 16(5): 470-475.
- Saito A, Foley HC (1991) Curvature and parametric sensitivity in models for adsorption in micropores. AIChE Journal 37(3): 429-436.
- Evans R, Tarazona P (1984) Theory of condensation in narrow capillaries. Phys Rev Lett 52: 557-560.
- Tarazona P, Evans R (1984) A simple density functional theory for inhomogeneous liquids. Molecular Physics 52(4): 847-857.
- Tarazona P, Marconi UMB, Evans R (1987) Phase equilibria of fluid interfaces and confined fluids. Molecular Physics 60(3): 573-595.
- Ball PC, Evans R (1988) Structure and adsorption at gas-solid interfaces: Layering transitions from a continuum theory. The Journal of Chemical Physics 89(7): 4412.
- Olivier JP, Conklin WB (1992) Determination of pore size distribution from density functional theoretic models of adsorption and condensation within porous solids. International Symposium on the Effects of Surface Heterogeneity in Adsorption and Catalysis on Solids, Kazimier Dolny, Poland.
- Lastoskie C, Gubbins KE, Quirke N (1993) Pore size distribution analysis of microporous carbons: A density functional theory approach. J Phys Chem 97(18): 4786-4796.
- Ravikovitch PI, Domhnaill SCO, Neimark AV, Schueth F, Unger KK (1995) Capillary hysteresis in nanopores: Theoretical and experimental studies of nitrogen adsorption on MCM-41. Langmuir 11(12): 4765-4772.
- Lastoskie CM, Gubbins KE, Quirke N (1997) Structure of porous sorbents: Analysis using density functional theory and molecular simulation. Studies in Surface Science and Catalysis 104: 745-775.
- Occelli ML, Olivier JP, Petre A, Auroux A (2003) Determination of pore size distribution, surface area, and acidity in fluid cracking catalysts (FCCs) from nonlocal density functional theoretical models of adsorption and from microcalorimetry methods. The Journal of Physical Chemistry B 107(17): 4128-4136.
- Ravikovitch PI, Alexander VN (2006) Density functional theory model of adsorption deformation. Langmuir: The ACS Journal of Surfaces and Colloids 22(26): 10864-10868.
- Jagiello J, Alejandro A, Martínez MT (2006) DFT-based prediction of high-pressure H2 adsorption on porous carbons at ambient temperatures from low-pressure adsorption data measured at 77K. The Journal of Physical Chemistry B 110(10): 4531-4534.
- Neimark AV, Lin Y, Ravikovitch PI, Thommes M (2009) Quenched solid density functional theory and pore size analysis of micro-mesoporous carbons. Carbon 47(7): 1617-1628.
- Pfeifer P, Wu YJ, Cole MW, Krim J (1989) Multilayer adsorption on a fractally rough surface. Phys Rev Lett 62.
- Neimark AV (1991) Calculating surface fractal dimensions of adsorbents. Ads Sci Tech 7(4): 210.
- Barrett EP, Joyner BG, Halenda PP (1951) The determination of pore volume and area distributions in porous substances. i. computations from nitrogen isotherms. Journal of the American Chemical Society 73: 373-380.
- Dollimore D, Heal GR (1964) An improved method for the calculation of pore size distribution from adsorption data. J Appl Chem 14(3): 109-114.
- Favvas EP, Mitropoulos AC, Stefanopolous KL (2011) A simple equation for accurate mesopore size calculations. Microp and Mesop Mat 145(1-3): 9-13.
- Washburn EW (1921) The dynamics of capillary flow. Phys 7: 115-116.
- Rootare HM, Prenzlow CF (1967) Surface areas from mercury porosimeter measurements. J Phys Chem 71(8): 2733-2736.
- Dees PJ, Polderman J (1981) Mercury porosimetry in pharmaceutical technology. Powder Technol 29(1): 187-197.
- Ritter HL, Drake LC (1945) Pore-size distribution in porous materials: Pressure porosimeter and determination of complete macropore-size distributions. Ind Eng Chem 17: 782-786.
© 2023 Michail Chalaris. This is an open access article distributed under the terms of the Creative Commons Attribution License , which permits unrestricted use, distribution, and build upon your work non-commercially.
Editor In Chief


.jpg)


Signup for Newsletter

Quick Links
 Editorial Board Registrations
 Submit your Article
 Refer a Friend
 Advertise With Us
Our Recent Edition

.jpg)


Top Editors


.jpg)


.bmp)
.jpg)
.png)
.jpg)


.jpg)


.png)

.png)


.png)


Financial Support

Sponsors

Latest e-Books

Latest Video

 a Creative Commons Attribution 4.0 International License. Based on a work at www.crimsonpublishers.com.
Best viewed in
a Creative Commons Attribution 4.0 International License. Based on a work at www.crimsonpublishers.com.
Best viewed in