- Submissions

Full Text
Aspects in Mining & Mineral Science
Development of a Data Analytics & Machine Learning Tool for the Mining Industry
Lewis Oduro1* and Rajive Ganguli2*
1Mining Engineering Department, University of Utah, USA
2Malcolm McKinnon Endowed Professor, Mining Engineering Department, University of Utah, USA
*Corresponding author: Lewis Oduro and Rajive Ganguli, Mining Engineering Department and Malcolm McKinnon Endowed Professor, Mining Engineering Department, University of Utah, USA
Submission: September 16, 2022;Published: September 26, 2022

ISSN 2578-0255Volume10 Issue1
Abstract
Advances in data analytics and Machine Learning (ML) techniques have seen a tremendous uplift in recent years and impacted most complex mining operations regarding safety improvement, operations optimization, and cost reduction. However, due to a lack of coding skills, most mining personnel face the challenge of fully adopting these techniques. In this project, a desktop application, Ute Analytics, was developed to allow users with little or no coding skills to perform data analytics and apply machine learning to any structured data. The app has an easy-to-use Graphical User Interface (GUI) and in-built data cleaning algorithms for users to import structured data, perform data cleaning, and store the cleaned data on their computers. Several Exploratory Data Analysis (EDA) tools were built into the app to enable users to explore trends and get insights from data. Additionally, the app has in-built machine learning tools-regression and classification algorithms- to give users the ability to train, test, and build machine learning models for predictive purposes. Finally, the app is made executable so it can be installed on any computer with Windows Operating System. With its user-friendly GUI, the desktop application was tested on real industrial data, and its ease of use proved that mining personnel and data enthusiasts with no coding experience could use it to benefit from data analytics without the need to understand or write complex computer codes.
Keywords:Ute Analytics; Desktop application; Data analytics; Machine learning; Linear regression; Random forest
Abbreviations: ML: Machine Learning; GUI: Graphical User Interface; EDA: Exploratory Data Analysis; CI: Computational Intelligence; NLP: Natural Language Processing; HSMS: Health and Safety Management Systems; RF: Random Forest; SME: Subject Matter Expert; OS: Operating System
Introduction
Like any other complex industrial operation, the mining industry requires intense capital injection and, as such, requires maximum asset utilization and throughput [1]. However, the industry continues to face several challenges ranging from diminishing resources, deeper deposits, harder rock mass, high capital and operating costs, volatile markets, and increasing environmental and social awareness [2,3]. This can disrupt the operational success of mining companies. Consequently, advanced data analytics and Machine Learning (ML) have been tipped to possess great value by extracting insights from operational data to enable process optimization, increased equipment efficiency, and timely decision-making [4]. With the amount of data generated from mining operations and advances in ML and data analytics, companies can make real-time decisions and predict future events to improve operations performance, reliability, and efficiency [2,5].
Work done by researchers and subject-matter experts
Regardless of the humungous amount of available data, mining companies’ adoption of modern innovative techniques to utilize data has not been as comprehensive and fast-paced as in other industries [6,7]. Ali & Frimpong [8] stressed that while industrial organizations continue to make impressive strides in developing and implementing these innovative techniques, the mining industry still lags in its adoption and application towards achieving intelligent operational autonomy. Despite these apparent concerns, the World Economic Forum [9] insists mining companies have been leaders in some areas but late adopters in other innovative disciplines. Nonetheless, the trend has recently seen a positive change as researchers and subject matter experts have begun to employ data analytics and machine learning to solve complex operational challenges. Ganguli et al. [10] noted this upward trend when they recognized that the industry has moved from the data-collection stage to the data utilization stage by employing Computational Intelligence (CI) techniques such as neural networks, fuzzy systems, and evolutionary computing. In mine health and safety, Talebi et al. [11] utilized a Random Forest (RF) to detect potential leading fatigue indicators to help managers make informed decisions on fatigue management. Researchers have also used Natural Language Processing (NLP) algorithm to classify mine accident narratives based on MSHA standards [12], thus, helping mining managers identify the best mitigating strategies in their Health and Safety Management Systems (HSMS).
Mine planning is another area where data analytics and ML have significantly impacted. For instance, Sarantsatsral et al. [13] used RF to identify and predict rock types below known benches to help strategic mine planning. In a further study, a mining company used machine learning to predict rock domains [14]. Researchers and subject matter experts have used these techniques to identify rock types within mining blocks, optimize the truck dispatching approach to increase mine production, and provide better and faster mineral reserve and ore grade estimates [13,15-19]. Additionally, several researchers have used data analytics and ML algorithms to optimize drill and blast in terms of fragmentation, back breaks, fly rocks, and blast-induced ground vibrations [20- 25]. Srivastava et al. [26-29], have employed these techniques to improve mill throughput, reduce high costs, and enhance mill efficiency in operating mines.
Adoption of data analytics and ML techniques by mine workers
It is undeniable that the work done by the subject matter experts and researchers in advancing the frontiers of ML and data analytics adoption and implementation in mining (some discussed earlier) has impacted many operations in diverse ways. However, despite the immense efforts of researchers and experts to promote the complete adoption and integration of ML and data analytics techniques in the mining field, it is unfortunate to note that utilization of ML is low as the typical mining industry engineer lacks a background in ML. Additionally, being able to program in Python, R, etc. [30] is critical to applying ML. Therefore, the goal of this research was to develop a tool to make ML accessible to the typical industry Subject Matter Expert (SME) without requiring knowledge of ML or programming.
Background to computer software and desktop applications
Figure 1:Structural breakdown of the computer software.
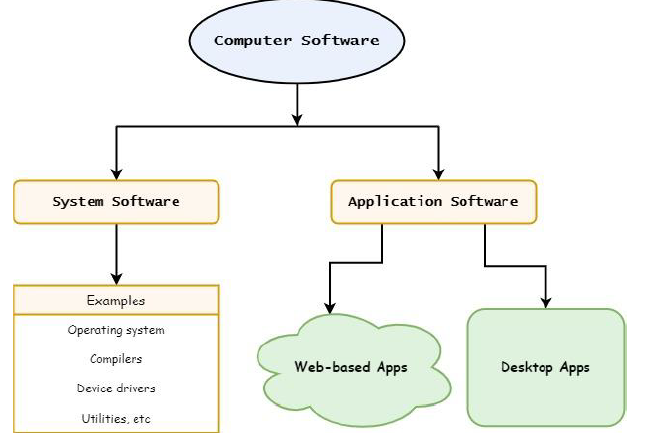
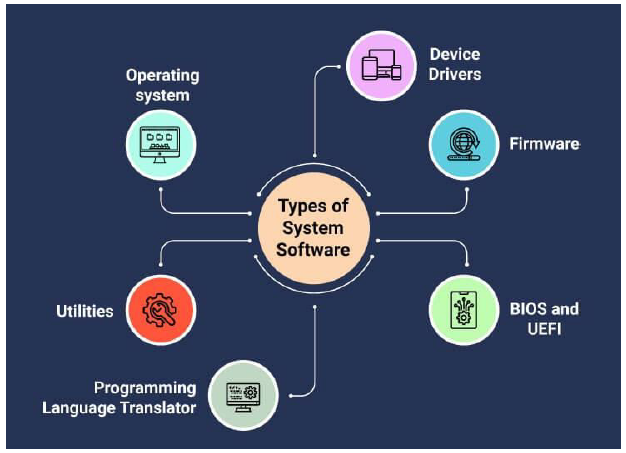
Computer software is a set of instructions or programs designed for a computer to perform a specific function directly for an end user or another application; they are classified into either system software or application software depending on the usability or the intended users of the program [31,32]. Figure 1 shows a structural breakdown of the computer software. System software consists of programs that operate on the computer background to allow other applications to run and do not directly interfere with the computer user. Their architecture is designed to simultaneously execute and process hardware and application software development, thus, providing an interface between hardware and application software [31,33]. These system applications include assemblers, compilers, file management tools, and the operating system. Figure 2 shows the types of system softwares. Application software (app) is built to run on a computer’s system software. Unlike system software, which is usually installed with the Operating System (OS) automatically, apps are installed on a computer based on what task the user wants to perform. As shown in Figure 1, application software can be a web-based or desktop app.
Figure 2:Types of computer system software [33].
Web-based applications: Web-based applications (also
known as web apps) depend on the web or the internet for their
correct execution because they are configured and installed on a
remote server [34,35]. Although web apps have gained popularity
recently, especially since the internet’s inception, they have some
disadvantages that render some programs unable to be executed
over the web. As noted by Desia [36], some of these bottlenecks are:
a. They solely depend on internet availability.
b. Disruptions on the internet make their execution relatively
slow.
c. Users can be prone to cyber-attacks, which can challenge
their data security.
d. Web apps can be costly for users when subscription fees
are charged.
Desktop application: Desktop applications or software have been around for many years and were the primary approach to building computer software way before the rise of the internet [37]. A desktop app runs on standalone computers and comes in a GUI that allows users to perform specific tasks [32]. They nullify the disadvantages of web apps and enable apps to interact directly with the computer hardware, thus, giving desktop apps high performance and easy access to hardware components such as CPU and memory [36,37]. Consequently, this makes it a good choice for building data analytics and ML apps that will need to take direct advantage of the processing power of a computer’s Control Processing Unit (CPU) cores. Desktop apps are usually packaged in executable files (.exe for Windows OS and .app for Mac OS) [38], with the main source code bundled together with other external resources. External resources could be images, icons, or GUI filesseparate from the source code- that make the program function as expected [39].
With powerful computers becoming common these days, it can be incredibly beneficial to miners, and data enthusiasts, without coding skills to have a data analytics and ML application tool with user-friendly features. This can potentially ease mining workforce adoption and utilization of these powerful techniques. Therefore, in this project, we capitalized on Graphical User Interface (GUI) programming to develop an executable Windows OS desktop application to allow users with little or no coding skills to perform data analytics and apply machine learning to any structured data.
Materials and Methods
Programming language and libraries
The Python [40] programming language was chosen for this research because it has built-in libraries for developing desktop applications and building ML models, aside from having a friendly syntax for object-oriented programming [41]. PyQt5 library, a set of Python bindings for version 5 of the Qt application framework [42], was used to build all GUIs. Qt is a set of C++ libraries for building GUIs and it’s owned by the Qt Company. However, the PyQt5 library is owned by Riverbank Computing and is available under the GPL v3 and the Riverbank Commercial License. Multithreading, which allows multiple codes to be executed in parallel [43], was employed to speed up the application when handling large datasets and building ML models. This improved user experience and maintained the app’s responsiveness even when ML models were being processed in the background. Ute Analytics leverages many machine learning and plotting tools from scikit-learn, seaborn, and Matplotlib [44-46]. The source code and resource files were packaged in Qt Creator, an Integrated Development Environment (IDE) [47], which allows users to build GUI applications and package them into executables for subsequent deployment.
Communications within app
The backend of the desktop application has a combination of signals and slots, coupled with several custom-built methods or functions that provide functionality as the user interacts with the program. Widgets (also called objects and includes buttons, labels, views, selection boxes, etc.) are the core objects in the GUI and provide the access through which the user interacts with the program. Each user interaction, known as an “event”, causes a function or method to execute in response to the event. A signal, which is emitted whenever an event is triggered, is connected to a slot to cause program response or functionality. A slot can be a Python callable or function(s) [48].
App features
There is a data Import feature, which allows a user to import a dataset of their choice. Currently only excel (.xlsx or .xls) and CSV file formats are supported. Before importing a dataset, the user has to select a folder directory that will be used as the default file directory. Data cleaning features, available under the Data Edit menu, allow the user to clean the dataset. The user can handle missing data, filter out data outliers, change column data types, etc.-some of which are under development. The Analysis menu has options to enable the user to perform EDAs on the data. The user can get data information such as shape, data types, and the number of missing data. The user can get descriptive statistics about the data. Data visualization tools can be used to plot line charts, histograms, boxplots, data distribution charts, etc. The Models menu has ML tools for building regression and classification models. There are options for linear models (linear, lasso, and ridge regression), random forest models, and neural network models. In a typical workflow, the user imports a dataset into the app, explores the data with EDA tools, cleans the data, visualizes the data, builds ML models, and views the model report, which can be saved onto the computer.
Results and Discussions
Ute Analytics, which is still under development, was tested on two datasets, as shown in the following demonstration (sections 5.1 and 5.2). EDA demonstration was done using a dataset from the plant operations of an active gold mine. Additionally, a dataset from the froth floatation process of a mine [49] was used to build an RF model to predict silica content in iron concentrate.
Welcome screen window
Figure 3: Welcome screen to UteAnalytics.
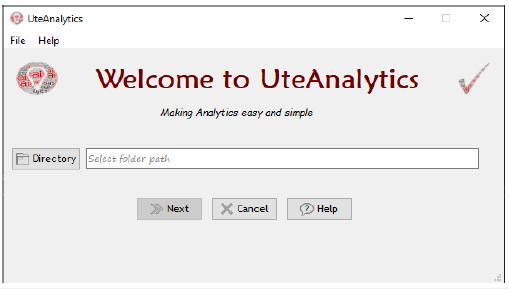
The welcome screen is the first GUI to the program (Figure 3). The Directory button allows the user to select a folder directory. This folder is where all models and cleaned data sets are saved. When clicked, the Next button is activated once a folder is selected and opens the “Import Data File” window (Figure 4). The “Import Data File” window allows the user to select a file. The user can select data columns of interest from the drop-down list and preview the first five (5) rows. Clicking the Forward Arrow pops up the Data Analysis window shown in Figure 5.
Figure 4: Import data file window.
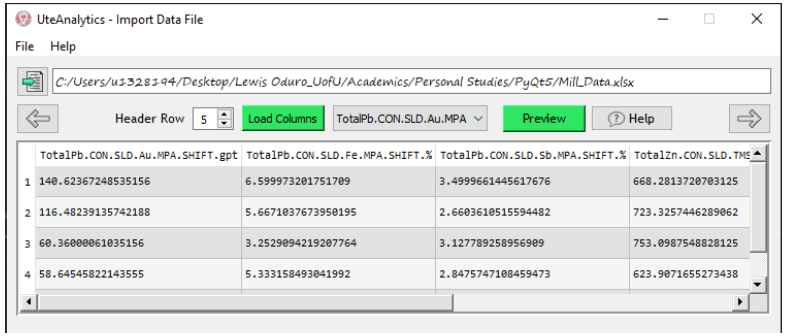
Figure 5: Data analysis window.
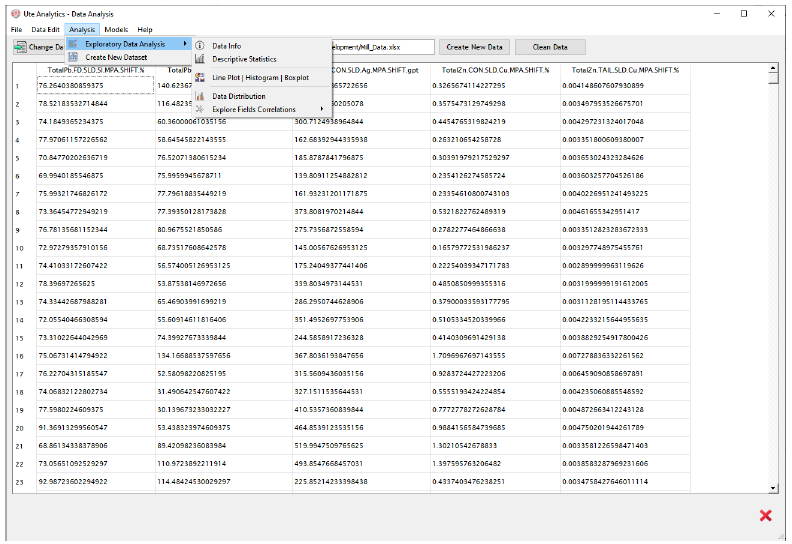
Data analysis window
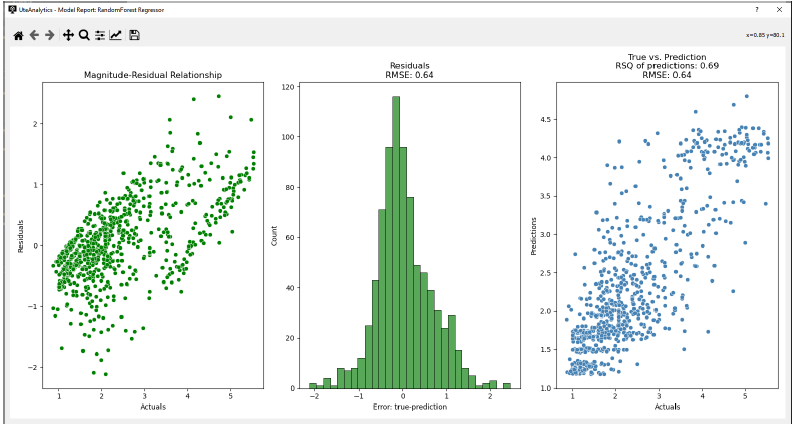
This interface allows the user to view all rows of the previewed data. The Analysis menu has built-in EDA functions that allow the user to explore the dataset, find trends, and know the relationships between the data fields. The user can also clean the data and save the cleaned dataset in the working directory. Figure 6 shows a distribution and correlation plot for selected columns of the mill dataset. The Models menu contains built-in ML algorithms for building linear models (linear, lasso, and ridge regression), Neural Network (NN) models, and Random Forest (RF) models. In building an RF regression model, as shown in Figure 7, the program asks the user for the model’s input and output features. The user can choose to use the default parameters provided by the program or change them. Clicking the Run button will execute the model’s algorithm based on the user’s selections, and the “Model Report” window pops up after building the model, as shown in Figure 8. The Model Report window gives all the critical details about the model. The window title shows the type of model (in this case, Random Forest Regressor). From Figure 8, the first scatter plot shows the correlation between the observed and residual values. The histogram plot of the residuals shows how the model errors are distributed. The “True vs. Predicted” plot shows the correlation between the true and predicted values. The proportion of variance explained by the model (RSQ) and the model performance metric (root mean square error – RMSE) are also shown in the Model Report window.
Figure 6: Plotting distribution and correlation plots in UteAnalytics.
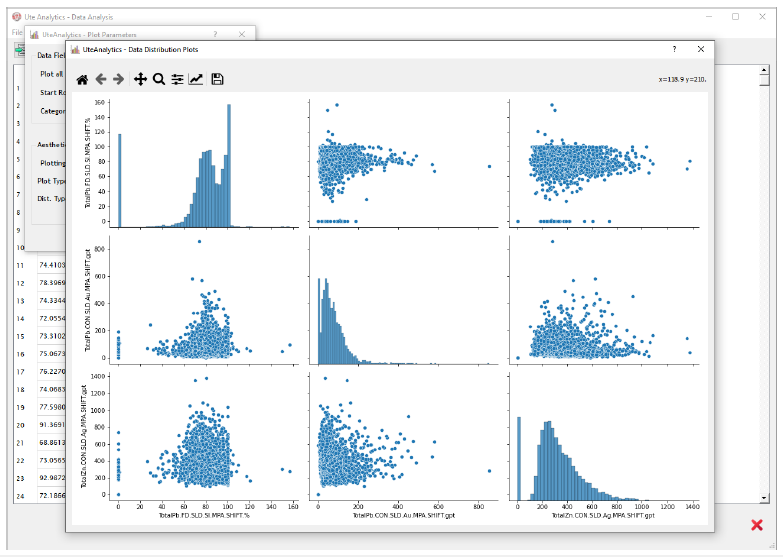
Figure 7: Regression models dialog box.
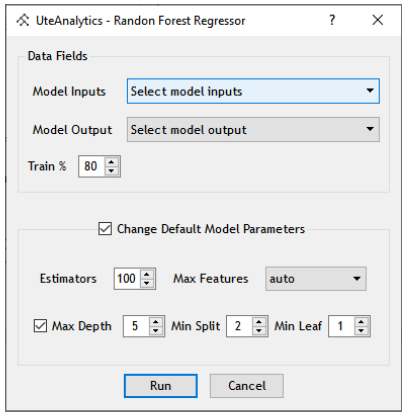
Figure 8: Model report window.
Conclusion
A desktop application, Ute Analytics, is being developed to enable data analytics and ML accessible to mining personnel and data enthusiast without ML knowledge or programming skills. The app offers a user-friendly GUI that could allow users to import relational datasets, perform exploratory data analysis and build ML models. These features and functionalities of Ute Analyticssome of which have been demonstrated-show that people without programming knowledge can benefit from data analytics without the need to write computer codes.
Acknowledgment
The ai.sys lab at the University of Utah’s Mining Engineering Department provided all the support needed for this research. Thanks to our industrial partners for their contribution.
References
- Data Analytics for the Mining Industry.
- Martins F (2022) What the mining and metals industry can gain from predictive analytics.
- Sánchez F, Hartlieb P (2020) Innovation in the mining industry: Technological trends and a case study of the challenges of disruptive innovation. Mining Metall Explor 37: 1385-1399.
- Gregorio J, Pujol F, Sellschop R, Zuniga D (2020) Engaging employees in mining to adopt analytics. McKinsey Co, USA.
- Das P (2022) Data and advanced analytics are fuelling the mining industry.
- Daly A, Valacchi G, Raffo J (2019) Mining patent data: Measuring innovation in the mining industry with patents with patents. P. 62.
- Bartos PJ (2007) Is mining a high-tech industry? Investigations into innovation and productivity advance. Resour Policy 32: 149-158.
- Ali D, Frimpong S (2020) Artificial intelligence, machine learning and process automation: existing knowledge frontier and way forward for mining sector. Artif Intell Rev 538(53): 6025-6042.
- (2017) World economic forum digital transformation industry mining and metals. Word Econ Forum, p. 36.
- Ganguli R, Dessureault S, Rogers P (2022) Introduction to the special issue advances in computational intelligence applications in the mining industry. Minerals, p. 12.
- Talebi E, Rogers WP, Morgan T, Drews FA (2021) Modeling mine workforce fatigue: Finding leading indicators of fatigue in operational data sets. Minerals 11(6): 621.
- Ganguli R, Miller P, Pothina R (2021) Effectiveness of natural language processing-based machine learning in analyzing incident narratives at a mine. Minerals 11: 1-13.
- Sarantsatsral N, Ganguli R, Pothina R, Tumen-Ayush B (2021) A case study of rock type prediction using random forests: Erdenet copper mine, Mongolia. Minerals, p. 11.
- Sarantsatsral N, Ganguli R (2022) Gaining insight from semi-variograms into machine learning performance of rock domains at a copper mine. Minerals, p. 12.
- de Carvalho JP, Dimitrakopoulos R (2021) Integrating production planning with truck-dispatching decisions through reinforcement learning while managing uncertainty. Miner 11(6): 587.
- Dutta S, Bandopadhyay S, Ganguli R, Misra D (2010) Machine learning algorithms and their application to ore reserve estimation of sparse and imprecise data. J Intell Learn Syst Appl 2(2): 86-96.
- Samanta B, Banopadhyay S, Ganguli R, Dutta S (2005) A comparative study of the performance of single neural network vs. adaboost algorithm-based combination of multiple neural networks for mineral resource estimation. J South African Inst Min Metall 105: 237-246.
- Dutta S, Mishra D, Ganguli R, Samanta B (2003) Investigation of two neural network ensemble methods for the prediction of bauxite ore deposit. In Proceedings of the Proceedings of the 6th International Conference on Information Technology, pp. 22-25.
- Dutta S, Bandopadhyay S, Samanta B (2006) Support vector machines-An emerging technique for ore reserve estimation. In Proceedings of the Proceedings of the Sixth International Symposium on Information Technology Applied to Mining (CD).
- Bhatawdekar RM, Armaghani DJ, Azizi A (2021) Applications of AI and ML techniques to predict backbreak and fly rock distance resulting from blasting. Springer Briefs Appl Sci Technol, pp. 41-59.
- Li D, Koopialipoor M, Armaghani DJ (2021) A combination of fuzzy delphi method and ANN-based models to investigate factors of flyrock induced by mine blasting. Nat Resour Res 30: 1905-1924.
- Ghasemi E, Amini H, Ataei M, Khalokakaei R (2014) Application of artificial intelligence techniques for predicting the fly rock distance caused by blasting operation. Arab J Geosci 7: 193-202.
- Guo H, Zhou J, Koopialipoor M, Jahed Armaghani D, Tahir MM (2019) Deep neural network and whale optimization algorithm to assess flyrock induced by blasting. Eng Comput 37: 173-186.
- Nguyen H, Drebenstedt C, Bui XN, Bui DT (2020) Prediction of blast-induced ground vibration in an open-pit mine by a novel hybrid model based on clustering and artificial neural network. Nat Resour Res 29: 691-709.
- Bayat P, Monjezi M, Mehrdanesh A, Khandelwal M (2022) Blasting pattern optimization using gene expression programming and grasshopper optimization algorithm to minimise blast-induced ground vibrations. Eng Comput 38: 3341-3350.
- Srivastava V, Akdogan G, Ghosh T, Ganguli R (2018) Dynamic modeling and simulation of a SAG mill for mill charge characterization. Miner Metall Process 35: 61-68.
- Pothina R (2017) Automatic detection of sensor calibration errors in mining industry.
- Pothina R, Ganguli R (2020) Detection of subtle sensor errors in mineral processing circuits using data- mining techniques. Mining Metall Explor 37: 399-414.
- de Melo EP, Ganguli R, Pothina R (2020) Modification and enhanced testing of data mining-based algorithm to detect subtle errors in temperature sensors in gold stripping circuit. Mining Metall Explor 37: 459-466.
- Savaram R (2022) Skills need to become a machine learning engineer.
- Gillis A (2022) What is an application?
- Pedamkar P (2022) What is desktop software? | How It Works |
- Halwai S (2022) What is system software – features, and types | OpenXcell.
- Nagathan M (2022) What is web application?
- Gellersen HW, Gaedke M (1999) Object-oriented web application development. IEEE Internet Comput 3: 60-68.
- Desai J (2022) Web application Vs desktop application: Pros and Cons.
- Gavrysh O, Dominguez MA (2022) Why Modern Desktop Applications | Microsoft Docs.
- Application Definition.
- Fitzpatrick M (2022) Using the Q Resource System to Bundle Icons and Data with Your PyQt5 Apps.
- Welcome to Python.Org
- Why python for machine learning? - Python tutorial.
- PyQt5 · PyPI.
- Kirvan P (2022) What is multithreading?
- Waskom ML (2021) Seaborn: statistical data visualization. J Open Source Softw 6: 3021.
- Pedregosa F, Varoquaux G, Gramfort A, Michel V, Thirion B, et al. (2011) Scikit-learn: Machine learning in python. J Mach Learn Res 12: 2825-2830.
- Hunter JD (2007) Matplotlib: A 2D graphics environment. Comput Sci Eng 9: 90-95.
- Embedded software development tools | Cross platform IDE | Qt Creator.
- PyQt - Signals & Slots.
- Froth flotation | Kaggle.
© 2022 Lewis Oduro and Rajive Ganguli. This is an open access article distributed under the terms of the Creative Commons Attribution License , which permits unrestricted use, distribution, and build upon your work non-commercially.
 a Creative Commons Attribution 4.0 International License. Based on a work at www.crimsonpublishers.com.
Best viewed in


.jpg)


 Editorial Board Registrations
 Submit your Article
 Refer a Friend
 Advertise With Us
.jpg)


.jpg)


.bmp)
.jpg)
.png)
.jpg)


.jpg)


.png)

.png)


.png)


