- Submissions

Full Text
Aspects in Mining & Mineral Science
Directional Geospatial Interpretation of CO2 Injection at the Citronelle Field, Alabama, Using Truth Table Analysis
Shen-En Chen1*, Yangguang Liu2 and Peng Wang3
1University of North Carolina at Charlotte, USA
2School of Resources and Environment, Henan Polytechnic University, China
3China University of Mining Technology, China
*Corresponding author: Shen-En Chen, University of North Carolina at Charlotte, 9201 University City Boulevard, Charlotte, North Carolina, USA
Submission: June 23, 2022;Published: July 08, 2022

ISSN 2578-0255Volume9 Issue3
Opinion
Carbon dioxide (CO2) is a greenhouse gas and has been recognized as a key element causing global warming and climate change [1]. Since there is a continued rise in the atmospheric CO2 concentration, there is an urgent need to develop technologies that can reduce carbon emissions. Carbon Capture and Geologic Storage (CCGS) has been recognized as a promising method for reducing the concentration of CO2 in the Earth’s atmosphere [2]. The technology involves collecting CO2 from emission-heavy sources, compressing and transporting the CO2 to a qualified site and injecting the CO2 at high pressure into a reservoir [3]. Since 2010, CO2 injection has been deployed at the depleted oil fields in Citronelle, Alabama, for both carbon storage and Enhanced Oil Recovery (EOR). Citronelle is a small township with a population of 3,946 (2020 census) and most of the oil wells at Citronelle are integrated into the townscape. Hence, any possible geohazard from the injection activities can be detrimental to the local citizens, live stocks and the environment. In order to detect changes in the geological formation (geomorphology) and the migration of CO2 within the storage reservoir, a surface geophysical testing method (micro-seismicity tests) using wireless sensors and passive seismic technique has been deployed to monitor the injection process [4]. Due to access restrictions, the non-intrusive measurements were made at well sites along only two linear arrays. The shear-wave velocity profiles that are then correlated to the strata stresses during different injection stages. The challenging question is: “What is the implication of the geophysical test results to Citronelle?”
Citronelle Field Geological Setting and Geophysical Testing
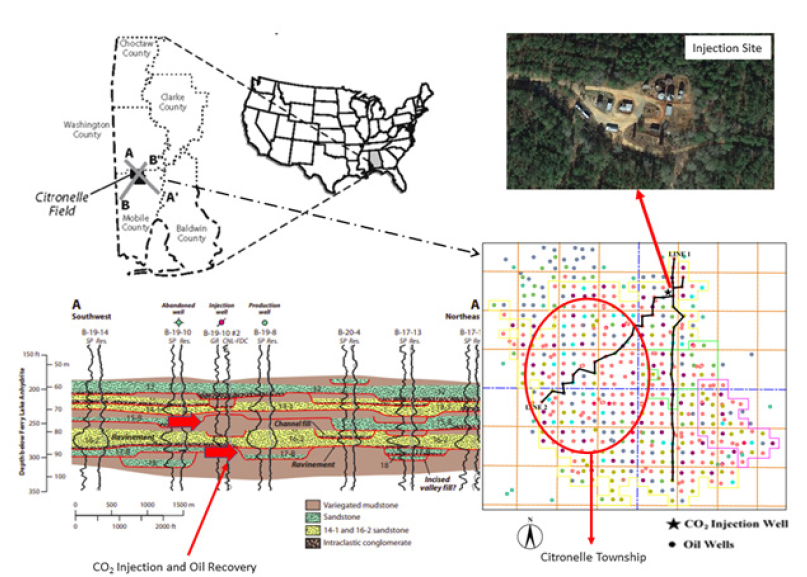
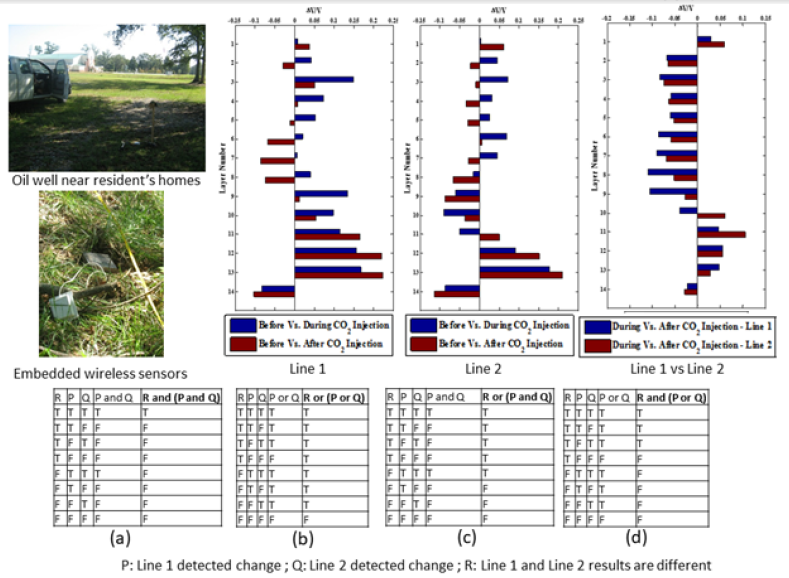
Discovered in 1955, the geology of the Citronelle Oil Field (COF) indicates that the field consists of fluvial-deltaic sandstone reservoirs in a structural dome with an anhydrite seal that trapped the oil in a four-way structural closure; thus, established the field as a naturally stable site for CCGS [5]. Oil has been produced from the Upper and Lower Donovan Sands in the Rodessa Formation with an Original Oil In Place (OOIP) estimated at 378.6 million bbl. The cumulative production from COF to-date is approaching the ultimate oil recovery that can be achieved using conventional recovery methods. Assuming 10% of OOIP can be economically recovered (38 million bbl) using CO2-EOR and with a production rate at 1.2 million bbl/year, the productive life of the field can be extended by 30 years [6]. Figure 1 shows the CCS injection location at the Citronelle Oil Field and the concentration of residence (the Citronelle township). The geology of the heterogeneous siliciclastic rocks in COF is quite challenging for the CO2 injection because of the rock segregations and makes it difficult to establish a clear understanding of the migration of the CO2 flooding in the oil producing sands. The geophysical testing used a DoReMi (Derivative of Refractive Microtremor) technique, which processes the captured data using slantstack analysis and forward modeling in the spectral domain [4]. The monitoring scheme suggests correlating the wave speed to the strata pressure at different injection stages. Each of the test arrays consisted of 24 measurement points and are shown in Figure 1, where Line 1 is aligned in the north-south direction and Line 2 is in the northeastsouthwest direction. Figure 2 shows the geophysical testing results of wave speed changes before, during and after a “huff and puff“ injection test with 10,000 ton CO2. Also shown in Figure 2 is a monitoring site near a residential area. This is truer for Line 2 than Line 1 and Line 2 penetrates throughout the downtown area (Figure 1).
Figure 1:Schematic of the CO2 injection scheme at citronelle for enhanced oil recovery and carbon sequestration.

Since the monitoring process involved the three injection stages, namely, water injection (before), CO2 injection (during), and post injection (after), the results are analyzed according to the different stages. The CO2 injection process instigated a continuous hydrostatic stress building within the oil-bearing layers resulting in an increase in wave speed. Due to the presence of the anhydrite layer, the CO2 would remain within the oil-bearing rock and resulting in the stress-built up throughout the oil-bearing layer. As long as the anhydrite retains its integrity and that there is no breakthroughs within the rock medium, the pressure at the oil-bearing layer should be consistently higher than in the strata above. Thus, the stress wave velocity at the oil-bearing layer should be higher than in the strata above. This is shown in Figure 2, where the stress change ratio (as a function of wave speed changes, Δv/v) is shown to be in compression at the oil-bearing layer (layer 14). The stress change ratio is shown to increase from before-during and beforeafter CO2 injection indicating that the continued built up of stresses in the oil-bearing strata throughout the entire injection history.
Figure 2: Results of surface wave monitoring and truth table analysis: a) R and (P and Q); b) R or (P or Q); c) R or (P and Q); and d) R and (P or Q).

Truth Table Analysis
To establish the directionality of the geophysical test results, a
simple truth table analysis is performed to establish the plausible
directionality of the test results. Four truth tables are created and
are shown in Figure 2 for different logical inference scenarios. Only
three variables are considered:
1. Line 1 detected changes during the injection process;
2. Line 2 detected changes during the injection process; and
3. Line 1 and Line 2 results are different.
The difference between the two test lines (third variable) would
indicate the presence of directionality of the CO2 migrating with the
oil-bearing strata (north-south versus northeast-southwest). Only
the conjunction (“and”) and disjunction (“or”) cases are considered
in the study. The four truth tables represent four different
propositions that may be true or false [7]:
a) R and (P and Q)
b) R or (P or Q)
c) R or (P and Q)
d) R and (P or Q).
The analysis results indicated that P is true (Line 1 has detected a change due to the CO2 injection), Q is true (Line 2 has detected a change due to the CO2 injection) and R also appeared to be true (Line 1 and Line 2 results are different). Hence, based on the four tables, the test results matched Case a). This concludes that the test results are directional. Since Line 2 results are more severe than Line 1 results, it is likely that the CO2 is migrating in the northeastsouthwest direction rather than the north-south direction. Since Line 2 penetrates through the township, a likely CO2 outbreak along Line 2 would imply a geo-risk for the township. The rational approach using tools such as the truth table is essential because of the challenges in interpreting geophysical testing results and of our confidence level in the surface wave measurements in detecting changes in strata stress [8]. Recent studies by Barone [9] suggested using norm damping regularization constraints to ensure a smooth solution for wave speed determination, which can significantly improve the sensitivity of the surface wave measurement technique. The truth table analysis should be performed for future geophysical monitoring strategies to help determine the CO2 leakage risks at Citronelle or other carbon sequestration sites. Although the analysis is simple, it can be expanded to include other site monitoring schemes such as the detection of surface CO2 gas fluxes and ground water quality measurements.
References
- IPCC (2013) AR5 WG1 Summary for Policymakers. International Panel for Climate Change.
- Balat M, Balat H, Acici N (2003) Environmental issues relating to greenhouse carbon dioxide emissions in the world. Energy Exploration & Exploitation 21(5): 457-473.
- Bachu S (2008) CO2 storage in geological media: Role, means, status and barriers to deployment. Progress in Energy and Combustion Science 34(2): 254-273.
- Chen SE, Liu Y, Wang P (2011) DoReMi-A passive geophysical monitoring technique for CO2 Proceedings, SPE Eastern Regional Meeting 2011, Society of Petroleum Engineers (SPE), Columbus, OH, United states, pp. 254-266.
- Esposito R, Pashin J, Hills D, Walsh P (2010) Geologic assessment and injection design for a pilot CO2-enhanced oil recovery and sequestration demonstration in a heterogeneous oil reservoir: Citronelle Field, Alabama, USA. Environmental Earth Sciences 60(2): 431-444.
- Esposito RA, Pashin JC, Walsh PM (2008) Citronelle dome: A giant opportunity for multizone carbon storage and enhanced oil recovery in the mississippi interior salt basin of alabama. Environmental Geosciences 15(2): 53-62.
- Mendelson E (1987) Introduction to mathematical logic, Wadsworth and Brooks, Monterey, California, USA.
- Mahvelati S, Coe TJ (2020) Numerical comparison of rayleigh and love full waveform inversion in characterizing soil spatial variability in near-surface engineering applications. Near Surface Geophysics 18(5): 497-513.
- Barone I, Boaga J, Carrea A, Flores OA, Cassiani G (2021) Tackling lateral variability using surface waves: A tomography-like approach. Surveys in Geophysics 42: 317-338.
© 2022 Shen-En Chen. This is an open access article distributed under the terms of the Creative Commons Attribution License , which permits unrestricted use, distribution, and build upon your work non-commercially.
 a Creative Commons Attribution 4.0 International License. Based on a work at www.crimsonpublishers.com.
Best viewed in


.jpg)


 Editorial Board Registrations
 Submit your Article
 Refer a Friend
 Advertise With Us
.jpg)


.jpg)


.bmp)
.jpg)
.png)
.jpg)


.jpg)


.png)

.png)


.png)


