
- About Us
- Information
-

The Author ensures that the research has been conducted responsibly and ethically with adherence to all relevant regulations. read more..
- For Authors
- For Reviewer
- Manuscript Guidelines
- Membership
- Publication Ethics
-
- Journals
- Reprints
- e-Books
- Videos
- Policies
- Contact Us
 COVID-19
- Submissions


Full Text
Aspects in Mining & Mineral Science
Excavation of 160 KW Pilot Scale Si Furnace
Haley Hoover*, Vegar Andersen, Gudrun Sævarsdóttir and Merete Tangstad
Department of Materials Science and Engineering, Faculty of Natural Sciences, Norway
*Corresponding author: Haley Hoover, Department of Materials Science and Engineering, Faculty of Natural Sciences, Norway
Submission: May 02, 2022;Published: May 19, 2022

ISSN 2578-0255Volume9 Issue2
Abstract
single-phase pilot furnace was run with a target load of 160kW for approximately 80 hours of total continuous operation. Coal, coke, charcoal, and woodchips provided the carbon. The furnace was cooled, filled with epoxy, and core drilled. Characterization of the cores allowed for the recreation of the zones and materials found in the Si process. The furnace contained Si and some slag. Si was found in droplets as high as 5cm from the top of the furnace and above the top cavity, likely from condensation reactions. SiC was seen throughout the furnace from both conversion of carbon materials by SiO gas and through gaseous reactions. Slag tended to wet the SiC and was found at almost all levels in the furnace. Brown, SiO2+Si, and white, SiO2+SiC, condensate was found. The condensate contained alumina (18%), K2O (5%), and Na2O (2%). No cavity was seen directly under the electrode. There was however evidence of a metal pool that appeared to have eroded into the lining. No evidence of a large SiC crust was found.
Keywords: Coal; Silicon; Materials; Furnace; Drilling; Quartz
Introduction
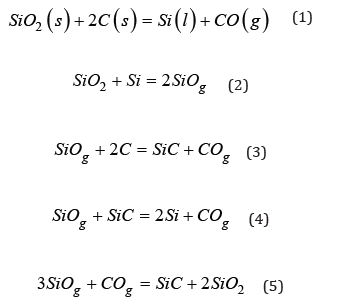
Silicon is produced from the carbothermic reduction of quartz, and the overall mass balance equation is shown in Equation 1 [1]. However, the process is in practice more complex, with various intermediate and side reactions. Many previous excavations have been done on various industrial and small-scale Si/FeSi furnaces [2-7]. The results from these excavations are useful for studying the various zones and reactions that are expected from the theory. The main chemical reactions in the Si furnace are found in Equations 2-5 [8]. Each furnace excavation is unique, as the zones in the furnace will depend on the history of the operations, but commonalities exist among most of them regarding the SiC formations, condensates, and Si production.
SiC is an important intermediate in the silicon process. It is found in four forms in the furnace. The first is solid β-SiC that has formed as a result of carbon reacting with SiO gas via reaction 3. The original structure of the particle is maintained, and it appears green in color [9-13]. The second is dense β-SiC that is found mixed in liquid slag [14]. The third is SiC whiskers formed as a result of reaction 5. The fourth is α-SiC, also called black SiC, which can be formed at high temperatures from solid β-SiC or through the gas phase [12]. This type of SiC is usually found around the crater forming a SiC-crust [5]. Some excavations see no SiC crust formation [2], whereas others see larger amounts. For example, Tangstad’s [5] excavation of a 40MW Si furnace noted that SiC crust comprised almost half of the furnace space. An example showing the various zones of SiC can be seen in Figure 1 [3], where the results from a 150kW pilot scale Si furnace excavation are shown. Areas of black SiC are deep in the furnace around the liquid pool and electrode. The liquid pool contains both liquid Si and SiC. Higher up in the furnace green SiC from charcoal was reported. No cavity was seen directly around the electrode tip, but a top cavity was seen higher up in the furnace. Si is usually found in the pores of the SiC due to reaction 4. This is seen in SiC particles from the bottom to the top of the furnace [7]. Reaction 4 is the primary metal producing reaction in the furnace. The Si forms a liquid pool in the furnace crater beneath the electrode. Si can also be formed from the reverse of reaction 2, where SiO gas condenses to SiO2 and Si.
Figure 1: Recreated cross section with various material zones defined by color (left) and a picture of the cross section (right) from Myrhaug’s pilot scale excavation, used with permission from [3].

SiO gas and CO gas are the two main gas species in the furnace [14]. SiO gas may condense to form Si and SiO2 via the reverse of reaction 2. It may also react with CO gas to form SiC and SiO2 via reaction 5. These two reactions provide the basis for condensate formation in the furnace [15]. Condensates can vary in composition, but two main forms have been seen in the furnace, called white and brown condensate based on their respective colors. White condensate is SiO2 and SiC. Brown condensate is SiO2 and Si [15]. Condensates are typically seen higher in the furnace and are often mixed with loose charge [2-5,7]. However, condensate can also be found outside the crater walls, as was the case in a 17.5MW FeSi75 furnace at Finnfjord [6]. However, there are cases where little to no condensate is found such as the 18MW FeSi50 furnace at Bjølvefossen [2]. The results from another previous 160kW pilot scale Si furnace excavation [7] are shown in Figure 2, showing the phenomena described above. This work emphasized condensate formation and metal production. Samples 1-12, indicated in the figure, contained brown condensate with droplets of Si as high as position 5. Samples 13 and 14 represent the metal pool below the electrode, which consisted of mainly silicon with some SiC. They also divided the cross section into zones. In zone 1, which is the area above the cavity, the charge is consumed from the bottom and up, and the condensation of SiO gas forms a cavity roof that is stoked and sends additional charge deeper in the furnace. Zone 3 is the area around the electrode in the so called “hot zone” which will consume charge in the direction of the arrow shown on the figure. Zone 2 is towards the outer edge of the furnace and represents the inactive region of the furnace. Zone 4 is the silicon bath region. Pilot scale experiments simulating industrial processes are useful tools to increase the knowledge of said processes. A silicon pilot scale experiment was performed to investigate recycling off-gas [16], as well as the materials and zones in the furnace. This paper presents the excavation of the charge and results obtained regarding the zones and materials found.
Figure 2: Left side cross section of the pilot scale furnace with sample locations labeled (left) and zones labeled (right) from Vangskåsen’s pilot scale experiment, used with permission from [7].

Experimental Methodology
Figure 3: Schematic of pilot scale furnace from NTNU/SINTEF, used with permission from [16] Copyright © 2022 by The Minerals, Metals & Materials Society. Used with permission.

The pilot furnace was run using a single electrode with 1 phase current and target load of 160kW. Operations lasted for approximately 80 hours of total continuous operation. The more detailed discussion of the operation will be discussed in [16]. A schematic and physical picture of the pilot scale furnace is shown in Figures 3 & 4. The carbon materials were similar to that used in industrial operations, with the analysis and composition of the raw materials summarized in Table 1. The furnace was tapped discontinuously and shut down approximately halfway through the tapping cycle, including stoking and charging, and the electrode was left in position. Each tapping was estimated to last around 90 minutes including tapping, stoking, and charging which in practice led to approximately 60 minutes of uninterrupted operation. After the furnace was cooled, epoxy was added and left to cure for approximately 1 week. Vertical core drilling was done according to the Figure 5, where a total of nine cores were drilled, two in each compass direction and one through the electrode. As typically most of the production is occurring close to the electrode, the cores were focused close to the electrode. The inner diameter of the furnace was 80cm with a height of around 70cm. The diameter of the electrode was 15cm. For cores 1 and 2, samples were taken from the cores using a water-cooled cutter approximately every 5cm. The remaining cores has samples taken every 10cm. The samples were recast in epoxy if needed, and polished. The diameter of the samples was 3- 3.6cm. EPMA and WDS was used to examine the different phases present in each of the samples from each zone.
Figure 4: Photo taken by Haley Hoover of furnace tapping during pilot scale furnace operations.

Table 1: Composition and amounts of carbon materials and quartz.

Figure 5: Diagram of core drilling samples taken from the pilot scale furnace where the circle represents the inner lining, core samples are numbered and colored, and the taphole is shown in red.

Results and Discussion
The resulting cores were visually examined and characterized into 5 material zones based on physical appearance. The height of each material zone was used to create an estimated cross section in the two compass directions. These cross sections can be seen in Figures 6 & 7. These estimated zones include:
a. Charge with condensate (dark blue) b. Top gas cavity (gray) c. Partly reacted charge materials (yellow) d. Metal and slag (light blue) e. Lining (green)
Figure 6: Diagram of various materials in the furnace based on cores 1, 2, 7, and 8. Opaque colors describe the cores and transparent shading is an extrapolation.

Figure 7: Diagram of various materials in the furnace based on cores 3, 4, 5, and 6. Opaque colors describe the cores and transparent shading is an extrapolation.

In addition, there were some holes due to the drilling process, shown in orange. The condensate and charge layer was around 10cm high and relatively even throughout. The glassy condensate acts as a glue which keeps the charge in place. There was a cavity directly below this layer, referred to as a top cavity. This is consistent with Myrhaug’s [3] work which also saw the cavity higher up in the furnace. This would typically be an example of how the furnace will form top cavities if the furnace is not stoked, as this furnace was not stoked after the last tapping. The top cavity was uneven across the cores. Cores 1 and 2 had a cavity size of 10 and 15cm, respectively. Across the electrode in the same axis, cores 7 and 8 saw cavities of 40 and 35cm respectively. In the other direction, cores 3-6 are similar in their depth, but cores 3 and 4 saw little to no condensate/charge layers above the top cavity, whereas cores 5 and 6 saw similar results to the other cores. Cores 3 and 4 are the furthest from the taphole, and cores 5 and 6 are the closest. Below the top cavity was partly reacted charge material. This layer is also relatively small, with some cores only having a couple of centimeters. This is in contrast with Vangskåsen’s [7] work, which saw a large layer of partly reacted materials both high and low in the furnace. Myrhaug’s [3] work seems to be in closer agreement, as there is not a lot of partly reacted material in that area and this layer is lower in the furnace. The largest material layer is the liquid silicon with some slag and SiC. The layer is mostly consistent, with a moderate spike in core 2. This layer appears larger than both Myrhaug [3] and Vangskåsen’s [7] results. In Myrhaug’s [3] work the area around the electrode tip is more complex, containing both SiC crust and a bottom cavity. Vangskåsen’s [7] silicon pool was not as large and separated from the electrode by both a cavity and a layer of partly reacted charge. No cavity was seen around the electrode tip in this work.
Charge with condensate
Due to the temperature gradient in the furnace, the top usually contains condensate and sometimes loose charge, depending on when the furnace is stopped in its stoking cycle. A top cavity was seen in this furnace, which was held in place by the glassy mixture of condensate and loose charge. This is consistent with other pilot scale experiments [3,7]. All three samples taken in this region (Figures 8-10) have a depth of 5cm from the top of the furnace. The loose charge consists of quartz, seen in all three samples with a cracked surface, and carbon materials. The charcoal may be distinguished from the coke and coke from its structure, visible in sample 2.1 (Figure 9). However, the coal and coke cannot be distinguished individually so they are labelled as “coal/coke.” In samples 1.1 and 2.1 (Figure 8 & 9) the carbon particles are lined with condensate. A WDS analysis was done on six points of the condensate in sample 2.1, and the results are shown in Table 2 that the condensate contained K2O (5.4±1%), Al2O3(18.3±3%), and Na2O (1.8±1%). It is believed that the alumina comes from the ash in the coal/coke, while the potassium mainly comes from the gas phase, as potassium will be vaporized in the high temperature part of the furnace. Sample 2.1 also contains visible brown condensate consistent with other excavations. As seen in previous investigations, the Si in the brown condensate will separate from the condensate over time and temperature, hence from excavations the enveloping layer is often only SiO2 [2,5,7,14,15]. Both in the EPMA picture and in the picture one can visually see that the condensate layer being several mm thick. Sample 6.1 (Figure 10) is the only sample in this region to show SiC, as the carbon particles have been fully converted, although their original structure is still visible. Gas blows could have provided the temperature and SiO pressure needed at this level in the furnace for reaction 3 to begin to form SiC. Additionally, the condensate in this sample is mixed with SiC and a band of Si droplets. The droplet structure implies the reverse of reaction 2 rather than the metal producing reaction (reaction 4) due to the low temperature this high in the furnace.
Figure 8: EPMA of sample 1.1 (left) and Image of sample 1.1 (right).

Figure 9: EPMA of sample 1.1 (left) and Image of sample 1.1 (right).

Table 2: Composition and amounts of carbon materials and quartz.

Figure 10: EPMA of sample 1.1 (left) and Image of sample 1.1 (right).

Partly reacted charge materials
Just below the top cavity, the material has been exposed to higher temperatures and has begun to react or melt. However, during stoking and charging, unreacted materials may also fall into this zone. Seven samples were taken from this region just below the top cavity with a depth range of 15-40cm (Figures 11-18). Partly reacted materials were found this low in the furnace, which is consistent with Myrhaug’s [3] pilot scale experiment, however Vangskåsen’s [7] results saw partly reacted charge in higher areas of the furnace. Areas of quartz were found in this region, but most of the areas where a carbon structure was visible had been converted to SiC. The only sample containing unreacted carbon was sample 1.3 (Figure 11). Samples 1.3 (Figure 11), 3.3 (Figure 15), and 4.3 (Figure 16) show SiC made from carbon. The SiC is green, which is consistent with previous works of SiC made from carbon materials [8,10,13]. Condensate is also present in this region as shown in sample 2.3 (Figure 13). The nature of the condensate was difficult to determine as two chemically similar phases are seen. Elemental mapping was done on two areas of the condensate in sample 1.3 (Figure 12) to show that the condensate contains some areas which are richer in SiO2 and some which are rich in SiC with SiO2. More substantial areas of Si are also seen in this region, such as with samples 2.5, 8.3 and 5.4. Sample 2.5 (Figure 14) shows an example where almost all SiC is transformed to Si according to reaction 4. Typically, one sees a thin rim of SiC according to the original C particle, while most of the interior is filled with Si. This is also seen in previous investigations [10-12]. The Si is surrounded by either condensate (sample 2.5) or slag (samples 8.3 and 5.4). Small white drops of FeSi are also visible throughout. Three areas of the slag in sample 8.3 were used for a point analysis to determine its composition. The results are shown in Table 3, where the majority is silica (65.4±1%), alumina (26.5±1%), and calcia (7.5±0.1%), with 0.8±0.1% K2O and trace amount of the other oxides.
Figure 11: EPMA of sample 1.1 (left) and Image of sample 1.1 (right).

Figure 12: Elemental mapping of two areas of the condensate in sample 1.3.

Figure 13: EPMA of sample 2.3.

Figure 14: EPMA of three different areas of sample 2.5.

Figure 15: EPMA of two different areas of sample 3.3.

Figure 16: EPMA of two different areas of sample 4.3 and image of sample 4.3.

Figure 17: EPMA of sample 8.3 and image of sample 8.3.

Figure 18: EPMA of sample 5.4 (left) and image of sample 5.4 (right).

Table 3: Mass percent results from the point analysis of the slag in sample 8.3.

Liquid silicon and slag
There was no small cavity or crater seen around the electrode tip position, but rather a lot of metal and slag. Below around 35cm in the furnace, all the samples appear metallic and was considered the liquid Si/slag region. A total of three samples were analyzed (Figures 19-21). All three samples contained large amounts of Si and slag. As the metal phase solidified upon cooling, Fe also precipitated out and formed FeSi upon the phase boundary, as is visible in Sample 1.7 (Figure 19). The slag appears mixed throughout the Si, and contains SiC along with alumina (22±0.8%) and calcia (9.3±0.3%), as shown by the point analysis results in Table 4. Sample 7.4 (Figure 21) also saw an area of SiO2 that appears to be a piece of quartz that fell down during stoking. No SiC crust was found in this region and all the SiC was distributed in the slag.
Figure 19: EPMA of sample 5.4 (left) and image of sample 5.4 (right).

Figure 20: EPMA of sample 5.4 (left) and image of sample 5.4 (right).

Figure 21: EPMA of sample 7.4 and image of sample 7.4.

Table 4: Mass percent results from the point analysis of the slag in sample 7.4.

Lining
Two samples (Figures 22 & 23) were taken in the region that appeared to be the SiC lining of the furnace. They are around 50- 60cm deep in the furnace. As expected, the samples were mostly SiC, with pockets of Si and FeSi throughout. Sample 6.5 (Figure 23) also contained some slag with the same composition seen in other areas of the furnace. The cores were taken close to the electrode, so the bottom lining appears to have eroded and metal and slag have penetrated the original lining.
Figure 22: EPMA of sample 5.6 (left) and image of sample 5.6 (right).

Figure 23: EPMA of two different areas of sample 6.5 and image of sample 6.5.

Conclusion
The results to the excavation of the 160kW pilot scale furnace were similar to those of other pilot scale experiments and excavations but had several unique points of interest. A top cavity was seen high up in the furnace and held in place by a layer of condensate and loose charge. The condensate contained alumina, K2O, and a small amount of Na2O, likely from pollutants in the carbon and quartz. Additionally, Si was found above the cavity in droplets, but more significant amounts of Si were seen at a depth of about 25cm, just below the top cavity. No cavity was seen around the electrode tip. No areas of SiC crust were identified, and it is believed to be absent because it would likely form close to the electrode tip. Other forms of SiC were found throughout the furnace from both solid-gas and gas-gas reactions. Slag of varying compositions, usually alumina and calcia with small amounts of trace oxides, were also found throughout the furnace, usually mixed with SiC.
References
- Schei A, Tuset JK, Tveit H (1998) Production of high silicon alloys. Trondheim: Tapir Forlag, Norway.
- Ksiazek M, Tangstad M, Ringdalen E (2016) Five furnaces five different stories, in Silicon for the chemical and solar industry XIII. Kristiansand, Norway.
- Myrhaug EH (2003) Non-fossil reduction materials in the silicon process-properties and behaviour. PhD Thesis, Department of materials technology, Faculty of Natural Science, Norwegian University of Science and Technology, Trondheim, Norway.
- Tangstad M (2021) The Si SAF process-An overview. Trondheim: Physical lecture, Norwegian University of Science and Technology, Norway.
- Tangstad M, Ksiazek M (2021) Picture book: zones and materials in Si/FeSi furnaces. Trondheim: Norwegian University of Science and Technology, Norway.
- Tranell G, Andersson M, Ringdalen E, Ostrovski O, Steinmo J (2010) Reaction zones in a FeSi75 furnace - results from an industrial excavation. The Twelfth International Ferroalloys Congress, Helsinki, Finland.
- Vangskåsen J (2012) Metal-producing mechanisms in the carbothermic silicon process. MSc Thesis, Department of materials science and engineering, Faculty of Natural Science, Norwegian University of Science and Technology, Trondheim, Norway.
- Bø SM (2016) Phases and zones in the silicon process. MSc Thesis, Department of Material Science and Engineering, Faculty of Natural Sciences, Norwegian University of Science and Technology, Trondheim, Norway.
- Hoover H, Pedersen T, Sævarsdottir G, Tangstad M (2020) Bulk Resistivity of SiC and Carbon Materials in the Silicon Furnace. Silicon for the Chemical and Solar Industry XV, Trondheim, Norway.
- Hoover H, Saevarsdottir G, Tangstad M (2021) Electrical resistivity of partially transformed silicon carbide made from coal. INFACON XVI, Trondheim, Norway.
- Hoover H, Sævarsdottir G, Tangstad M (2022) Electrical resistivity of transformed carbon materials in the silicon furnace. TMS Furnace Tapping, Anaheim, California.
- Jayakumari S (2020) Formation and characterization of B- and a- silicon carbide produced during silicon/ferrosilicon process. PhD Thesis, Department of Material Science and Engineering, Faculty of Natural Sciences, Norwegian University of Science and Technology, Trondheim, Norway.
- Norbø EA (2019) Interaction of SiO-gas and charcoal and the formation of SiC and Si. MSc Thesis, Department of Material Science and Engineering, Faculty of Natural Sciences, Norwegian University of Science and Technology, Trondheim, Norway.
- Sindland C, Tangstad M (2021) Production rate of SiO gas from industrial quartz and silicon. Metallurgical and Materials Transactions B 52: 1755-1771.
- Broggi A, Tangstad M, Ringdalen E (2019) Characterization of a Si-SiO2 Mixture Generated from SiO(g) and CO(g). Metallurgical and Materials Transactions B 50: 2667-2680.
- Andersen V, Solheim I, Gaertner H, Sægrov-Sorte B, Einarsund K, et al. (2022) Pilot scale test of flue gas recirculation for the silicon process. TMS, Anaheim, California, USA.
© 2022 Haley Hoover. This is an open access article distributed under the terms of the Creative Commons Attribution License , which permits unrestricted use, distribution, and build upon your work non-commercially.
Editor In Chief


.jpg)


Signup for Newsletter

Quick Links
 Editorial Board Registrations
 Submit your Article
 Refer a Friend
 Advertise With Us
Our Recent Edition

.jpg)


Top Editors


.jpg)


.bmp)
.jpg)
.png)
.jpg)


.jpg)


.png)

.png)


.png)


Financial Support

Sponsors

Latest e-Books

Latest Video

 a Creative Commons Attribution 4.0 International License. Based on a work at www.crimsonpublishers.com.
Best viewed in
a Creative Commons Attribution 4.0 International License. Based on a work at www.crimsonpublishers.com.
Best viewed in