- Submissions

Full Text
Aspects in Mining & Mineral Science
Commercial Machine Vision Systems in Flotation Circuit: A Mini –Review
Nad Alona*
Geological Survey of Finland GTK, Finland
*Corresponding author: Nad Alona, Geological Survey of Finland GTK, Circular Economy Solutions, Tutkijankatu 1, 83500 Outokumpu, Finland
Submission: April 21, 2021;Published: May 19, 2021

ISSN 2578-0255Volume6 Issue4
Abstract
This paper presents a review of current industrial applications of Machine vision systems. A comparative analysis of the existing commercial software from different providers is given. Significant aspects of the control and optimization strategies based on the visual froth features (froth color, bubble size and shape, froth velocity and texture) extracted from the froth images are described in the paper.
Keywords: Machine vision; Froth camera; Flotation; Froth features
Abbreviations: RGB: Red, Green, Blue; HSI: Hue, Saturation, Intensity; HSV: Hue, Saturation, Value; FFT: Fast Fourier Transform; CCM: Color Co-Occurrence Matrix; GLCM: Gray Level Co-Occurrence Matrix
Introduction
Currently, we stand on the brink of the 4th technological revolution, which means the presence of new interconnected technologies in plant operations. The digital flotation processing solutions are based on advances in our ability to instrumentally measure phenomena at several stages of the flotation circuit, manage the data real‐time, and to analyze these data using machine learning artificial intelligence to develop the next generation of process control. The Machine vision technology offers a viable means of monitoring and control of the flotation circuits by extracting valuable data from the froth digital images. As was point out by [1] this technology represents a form of artificial intelligence implemented into the higher level control strategies. Froth flotation is one of the most widely used separation technique across the minerals processing industry for the recovering of economically valuable minerals from nonvaluable gangue minerals by using the differences in the hydrophobic properties of the mineral components. It is well known that the froth appearance is a good indicative of the flotation performance and based on that experienced plant operators can detect with the naked eye the changes within flotation operation by observation of the surface of the froth. On the grounds that flotation is strongly disturbed and difficult to measure process machine vision systems have been developed with the aim of improving the control of froth flotation cells.
In last decades have been numerous recent studies investigating the potential application for machine vision technology [2-9]. The advantage of having a machine vision system is making consistently monitor and measured the froth visual features in real-time per 24 hours a day with no limitation to the number of flotation cells are observed, that is practically useful in terms of large scale size of industrial flotation plants with limited personnel resources [10]. Forbes mentioned that the system also has the potential to pick up small changes that are not noticeable even by experienced operators. Generally, measurements made by industrial machine vision systems include such forth features as: froth velocity, colour, bubble size distribution and bubble shape, froth texture and stability (collapse rate).
Machine Vision System
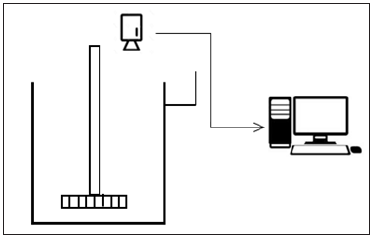
Machine vision system consists of a video camera and light, which are positioned above the flotation froth surface pointing directly at the froth surface (Figure 1). In order to protect a camera from light interference, dirt, dust, and impacts, that obviously occur during the run operation process at the concentrators, hood protection is applied. The images and video signals captured from the flotation cell are sent to a computer, which processes the video signal and returns a variety of measurements [10]. The live video is fed to the control room for general supervision, while the raw data processed through an algorithm within the special software to automatically extract the visual features from the froth images and infer the important measurements to control the process [1,11-16].
Figure 1:Froth vision system architecture.
Froth Visual Feature Extraction
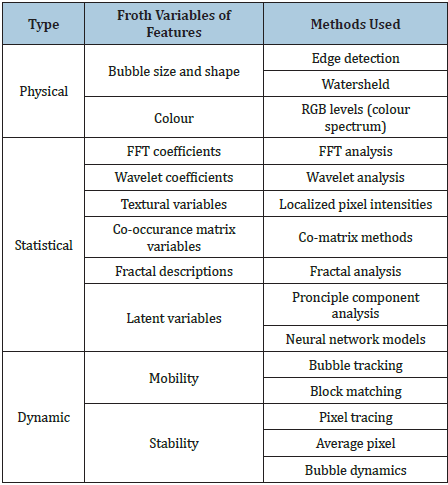
Machine vision systems are able to automatically extract the visual features (i.e. froth color, bubble size and shape, froth velocity and texture) from the froth images. The digitized froth image is characterized by a matrix of pixel intensities, three spectral features (Red, Green and Blue or RGB), as well as Hue, Saturation, and Intensity (HSI) or Hue, Saturation, and Values (HSV) [13]. Certain froth features can be extracted from froth images and analyzed by appropriate processing algorithms. Aldrich [13] categorized them into three types namely: physical (bubble size and shape, froth colour), statistical (FFT coefficient, wavelet coefficients, textural variables, co-occurrence matrix variables, fractal descriptors, latent variables), and dynamic (froth mobility and stability) properties. The (Table 1) presents the different methods within each category for extracting variables and/or features (detailed description for each category is given by Aldrich [13]).
Table 1:Somatic diseases and concomitant OMD.
Physical features of froth images
Physical features, that can be obtained by machine vision system are bubble size & shape and froth colour. Wills and Napier Minn [17] declared that one of the most critical components within the process in the science of flotation is the role of the bubbles. Both the bubble size and bubble shape can reflect the working condition of the flotation process. The bubble size can be extracted by using watershed algorithms or by detecting bubble edge. Withing these methods the image is segmented in order to identify individual bubble films on the froth surface. The shape of bubbles is commonly analyzed by edge detection algorithms, in which segmentation of the image is based on the detection of pixel intensities of the image. Watershed algorithms are morphological approaches based on a simulation of water rising from a set of markers [13]. This method was used by Zhang and all [18], where the froth image was segmented, and then the bubble size distribution was numerically expressed as histogram using statistical methods. Forbes [10] mentioned that the sampling of video footage for bubble size distributions is critical for froths that have rapidly changing bubble size distributions. The analyses were performed in the laboratory and on industrial flotation cells [19] showed that the froth colour showed a statistically significant relationship to concentrate copper grade in a chalcopyrite/pyrite system. However, the research that was done at Rio Tinto’s Kennecott Copper Concentrator [20] indicates that colour information only is not sufficient to predict copper grade accurately. There are other parameters such as per cent solids in the pulp and concentrate, and the amount of iron in the pulp which have significant relationships to the colour. Other visual physical features may also provide useful information on the flotation process. For instance, Kaartinen explained [15,16] that by visual inspection it was easy to detect bubbles that had a thick mineral cover from bubbles having a very thin mineral cover. Furthermore, the main indicator of a bubble having a very thin mineral load was the fact that it seemed much more transparent than a bubble having a high load of minerals. During the experiments run at the zinc flotation circuit of the Pyhäsalmi mine in Finland, the authors discovered that “if a suitable level of illumination is used, the transparent bubbles have a very distinctive total reflectance point”. Then, the numerical algorithm was created to measure the mineral coverage of the bubbles.
Statistical features of froth images
Statistical features of froth include such variables as: FFT coefficients, wavelet coefficients, textural variables, co-occurrence matrix variables, fractal descriptions and latent variables. Authors Gui [21] and He [22] declared that the visual froth features, such as surface texture appearance of the flotation froth provide crucial information on flotation process performances. They have suggested a texture feature extraction method based on Color Co-Occurrence Matrix (CCM) in compared to the Gray Level Co-Occurrence Matrix (GLCM). In the Gui [21] study the qualitative relationship between the texture complexity and the corresponding concentrate grade was investigated. Thus results can be useful with further research of the optimal control of the flotation process.
Dynamic features
Dynamic froth features are measured in corresponding to time
changes and calculated from an image pair based on detecting
the rate of change in the appearance of the images. The main
aim of measuring froth mobility and stability is the capture the
movement of the dynamic behavior of the flotation froth in order
to maintain the process performance at the desired level. Froth
mobility characterized by froth speed and direction of movement,
while froth stability can be described by bubble burst rate,
bubble coalescence, a fraction of air overflowing, or some notion
of the rate of change of the appearance of the froth [13]. Stability
measurements provide an indification of the appearance and
disappearance of bubbles from the froth. Bubble count refers to
the total number of bubbles present in a consecutive frame. The
result of this counting algorithm indicates of froth stability when
continuous video is analyzed. A bubble count that exhibits dramatic
variations in sequences of consecutive images indicates that the
froth is unstable [23]. The authors [24] reported, that due to the
instability of the bubble, the froth appearance changes quickly. In
their work, the series of consecutive froth images in three different
production conditions with the sampling period 1 s were carried
out. The authors highlighted, that some bubbles disappear or reform
with time-varying, and the froth features extracted from a
randomly selected image cannot describe the working conditions
accurately. In comparison to the sampling campaign, which in
mineral processing operations is essential to proper control, a
sample should be represented as possible, the selection froth
image from the video is a critical moment, and those images should
be most represent the current working conditions. The study
performed by Neethling and Brito [25] indicated, that theoretical
understanding of froth behaviour can be used to link stability to
performance. The authors presented interactions between bursting
flux and gas flux and how this influences the relationship between
the gas flux and the water recovery.
The froth speed is determined by the two-element vector
describing by the horizontal and vertical differential motion pair.
An increase in froth velocity results in a decrease in the concentrate
grade. This is due to the increase of entrained gangue particles at
high froth velocity. However, it should be highlighted, that froth
velocity varies at different parts of the cell surface, it is stagnant in
the center of flotation cell, while moving rapidly where it overflows
into the launder [13].
Commercial systems
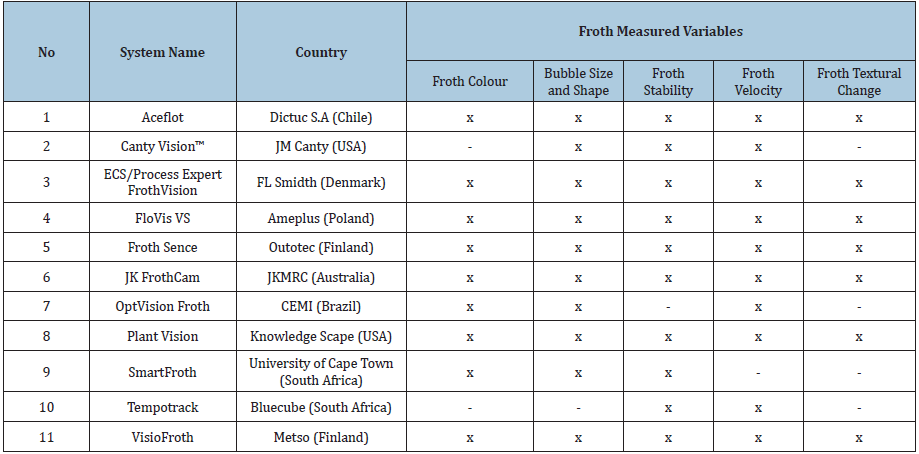
The machine vision system based on the observation of froth behavior is already applied over the world and its application is increasing as computer vision technology continues to advance [13]. Measured variables include froth velocity, bubble size distribution, stability and colour. Expert systems are used to manipulate variables such as pulp level, air addition rate, reagent addition and/or water addition in a bid to increase recovery at a set (or improved) concentrate grade. In commercial installations, these systems are often integrated with plant-wide process control software. (Table 2) gives a review commercial machine visionbased software for froth analysis [26-31]. It should be noted, that more commercial froth analyses software were mentioned by Jovanovic´ & Miljanovic´ [1] such as Froth image analyzer IMSOC (Sweden), Froth Sensor Stone three (South Africa); ITS Flotation visualization package, Manchester (United Kingdom); MetCam, SBS (Switzerland); WipFroth, WipWare. Tempo track, Bluecube doesn’t produce this type of system anymore. The Froth Sense software, Outotec, is combined with VisioFroth, Metso and a new company Matso: Outotec was established in 2020.
Table 2:Machine vision based commercial froth analysis software.
Control and Optimization of Froth Flotation
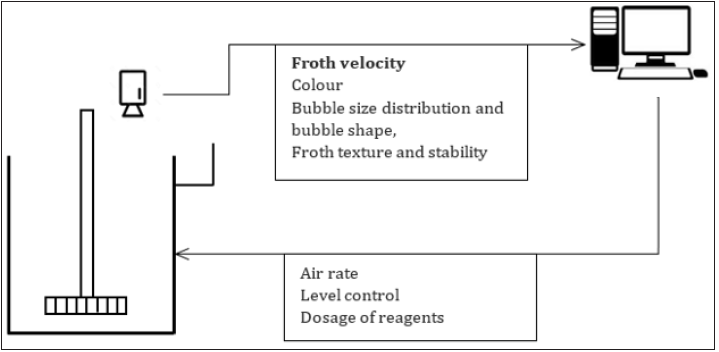
Information about the process states is the main factor for the control procedure. To be able to provide an effective control strategy it is essential using the appropriate measurement instrumentation and applying a deep knowledge of understanding the flotation phenomena. In mineral processing operation, the grade and recovery are the two common output variables of the flotation process. Through analyzing control variables, the machine vision system tends to optimize the recovery circuit based on different control strategies. For instance, the FloVis system [31], Poland, consists of two master control strategies: process stabilization or its optimization. In the stabilization mode all optimization loops are off. Optimization enables to either minimize % Cu in the final waste or maximize % Cu in the concentrate, as a result of setting the machine’s optimal point which is fixed in a recipe. Knowledge Scape company presents its solution Plant Vision [29] in combination with the intelligent control Expert System for increasing rougher and scavenger recovery by using froth velocity together with froth depth and pulp level. The system implementation to the flotation chain can increase recovery even up to 2-4% and reducing the reagent usage by as much as 40%. The commercial machine vision systems for flotation optimization are typically managed to maintain a froth velocity by varying such parameters as air rate, froth depth, and dosage of reagents (Figure 2). Before any optimization is performed, the software algorithms usually analyzes the flotation circuit for overloaded components. After this the specific optimization strategy can be applied. However, it should be noticed, that besides that all froth flotation processes are using the same principles, there are major differences in the characteristics of the froth at different plants. It is caused either by different ore bodies and specific operating conditions [10]. Morar [32-33] in his study presented a summary of the relationships showing that froth stability parameters and operating variables are required to change to effect a consistent increase in the solids recovery and concentrate grade within the flotation cell under solid regimes, across a wide range of operating conditions. The author highlighted, that relationship between froth velocity and flotation performance is not robust and only works under a narrow range of the conditions (based on result obtained from copper plant and platinum plant).
Figure 2:Froth vision system control algorithm architecture.
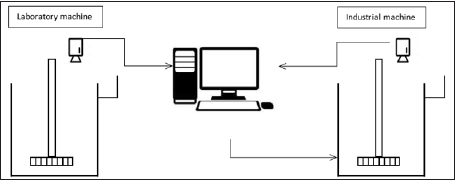
Nevertheless, it should be mentioned, that differences between the average features of froth images captured over a very short time period may be very large because a camera can only capture a small area of the entire flotation cell and the froth may not be uniform. Additionally, taking into account the variability of the ore characteristics within even one orebody, the laboratory examinations of the ore are commonly used by plants over the world. From this point of view, it could be useful to compare the froth images and calculated froth parameters from the laboratory results and mini-pilot, pilot-scale tests with industrial ones. Especially it can be helpful for personnel, who visually inspect the state of the froth either in industrial plant and research centers. Moreover, the system can provide valuable information about the differences in both measurements, that can be applied to the next study of flotation performance and understanding the process of scaling the results. The literature examination as well as contact with machine vision-based software producers showed, that there is no commercial system for laboratory tests was developed so far. Most of the applications are oriented for industrial scale flotation machines (Figure 3). The main problem with laboratory examination is the camera’s dimensions (it is too big for installing on the laboratory small flotation cell). Therefore, this is open topic for future cooperation with commercial companies.
Figure 3:Froth vision system for comparing results from laboratory and industrial scales tests.
Conclusion
In terms of leading the beneficiation process to a state of optimal performance, come into smooth stable operation, achieve greater productivity, and improving quality the new intelligent control system is required. Intelligent control combines a range of process control techniques to tackle the bottlenecks of the process and optimize operations. The current form of artificial intelligence, that can be implemented into the higher-level control strategy is Machine vision technology, which offers a viable means of monitoring and control of the flotation circuits. To effectively manage a flotation system, performance measurements are essential. The system provides continuous real-time evaluations of froth velocity, colour, bubble size distribution and bubble shape, froth texture, and stability. Mainly, based on the froth velocity range the specific control strategy is applied (change the air rate, level control or/and add more frothers or collectors). The extension of using machine vision technology to laboratory-scale should be considered to compare the froth images and calculated froth parameters from the laboratory results (mini-pilot, pilot-scale tests) with industrial ones.
References
- Jovanović I, Miljanović I (2015) Contemporary advanced control techniques for flotation plants with mechanical flotation cells-A review. Minerals Engineering 70: 228-249.
- Jahedsaravani A, Marhaban MH, Massinaei M (2014) Prediction of the metallurgical performances of a batch flotation system by image analysis and neural networks. Minerals Engineering 69: 137-145.
- Jahedsaravani A, Massinaei M, Marhaban MH (2017) An image segmentation algorithm for measurement of flotation froth bubble size distributions. Measurement 111: 29-37.
- Fu Y, Aldrich C (2018) Froth image analysis by use of transfer learning and convolutional neural networks. Minerals Engineering 115: 68-78.
- Fu Y, Aldrich C (2018) Using convolutional neural networks to develop state-of-the-art flotation froth image sensors. IFAC-PapersOnLine 51(21): 152-157.
- Holtham PN, Nguyen KK (2002) On-line analysis of froth surface in coal and mineral flotation using JKFrothCam. International Journal on Mineral Processing 64(2): 163-180.
- Wang X, Song C, Yang C, Xie Y (2018) Process working condition recognition based on the fusion of morphological and pixel set features of froth for froth flotation. Minerals Engineering 128: 17-26.
- Zarie M, Jahedsaravani A, Massinaei M (2020) Flotation froth image classification using convolutional neural networks. Minerals Engineering 155: 106443.
- Zhang H, Tang Z, Xie Y, Gao X, Chen Q, et al. (2021) Long short-term memory-based grade monitoring in froth flotation using a froth video sequence. Minerals Engineering 160: 106677.
- Forbes G (2007) Texture and bubble size measurements for modelling concentrate grade in flotation froth systems. Phd Thesis, University of Cape Town, South Africa, p. 266.
- Kistner M, Jemwa GT, Aldrich C (2013) Monitoring of mineral processing systems by using textural image analysis. Minerals Engineering 52: 169-177.
- Laurila H, Karesvuori J, Tiili O (2002) Strategies for instrumentation and control of flotation circuits. Mineral Processing Plant Design, Practise and Control 1: 2174-2195.
- Aldrich C, Marais C, Shean BJ, Cilliers JJ (2010) Online monitoring and control of froth flotation systems with machine vision: A review. International Journal of Mineral Processing 96(1-4): 1-13.
- Gui WH, Yang CH, Xu DG, Lu M, Xie YF (2013) Machine-vision-based online measuring and controlling technologies for Mineral Flotation-a Review. Acta Automatica Sinica 39(11): 1879-1888.
- Kaartinen J, Koivo H (2002) Machine vision based measurement and control of zinc flotation circuit. Studies in Informatics and Control 11(1): 97-105.
- Kaartinen J, Hätönen J, Hyötyniemi H, Miettunen J (2006) Machine-vision based control of zinc flotation-A case study. Control Engineering Practice 14(12): 1455-1466.
- Wills BA, Napier Munn TJ (2006) Wills' mineral processing technology: An introduction to the practical aspects of ore treatment and mineral recovery. Elsevier/Butterworth-Heinemann, Oxford, UK.
- Zhang J, Tang Z, Liu J, Tan Z, Xu P (2016) Recognition of flotation working conditions through froth image statistical modeling for performance monitoring. Minerals Engineering 86: 116-129.
- Heinrich G (2003) An investigation into the use of froth colour as sensor for metallurgical grade in a copper system. MSc Thesis, University of Cape Town, South Africa, p. 141.
- Morar SH, Forbes G, Heinrich G, Bradshaw D, King D, et al. (2005) The use of a colour parameter in a machine vision system, Smart Froth, to evaluate copper flotation performance at Rio Tinto’s Kennecott Utah Copper Concentrator. In: Proceedings of the Centenary of Flotation Symposium. Brisbane, Australia.
- Gui W, Liu J, Yang C, Chen N, Liao X (2013) Color co-occurrence matrix based froth image texture extraction for mineral flotation. Minerals Engineering 46-47: 60-67.
- He M, Yang C, Wang X, Gui W, Wei L (2013) Nonparametric density estimation of froth colour texture distribution for monitoring sulphur flotation process. Minerals Engineering 53: 203-212.
- Núñez F, Cipriano A (2009) Visual information model based predictor for froth speed control in flotation process. Minerals Engineering 22(4): 366-371.
- Ai M, Xie Y, Xie S, Gui W (2019) Shape-weighted bubble size distribution based reagent predictive control for the antimony flotation process. Chemometrics and Intelligent Laboratory Systems 192: 103821.
- Neethling SJ, Brito Parada PR (2018) Predicting flotation behaviour-The interaction between froth stability and performance. Minerals Engineering 120: 60-65.
- jmcanty.com/product/froth-control-systems/
- outotec.com/products-and-services/technologies/analyzers-and-automation/frothsense-sensor-system/
- cemi.eng.br/eng/solucoes/71/71/optvision-froth
- kscape.com/frothflotationoptimization/
- bluecubesystems.com/industries/
- ameplus.pl/technology-processes/
- Morar SH (2010) The use of machine vision to describe and evaluate froth phase behavior and performance in mineral flotation systems. PhD Thesis, University of Cape Town, South Africa, p. 311.
- Morar SH, Harris MC, Bradshaw DJ (2012) The use of machine vision to predict flotation performance. Minerals Engineering 36-38: 31-36.
© 2021 Nad Alona. This is an open access article distributed under the terms of the Creative Commons Attribution License , which permits unrestricted use, distribution, and build upon your work non-commercially.
 a Creative Commons Attribution 4.0 International License. Based on a work at www.crimsonpublishers.com.
Best viewed in


.jpg)


 Editorial Board Registrations
 Submit your Article
 Refer a Friend
 Advertise With Us
.jpg)


.jpg)


.bmp)
.jpg)
.png)
.jpg)


.jpg)


.png)

.png)


.png)


