
- About Us
- Information
-

The Author ensures that the research has been conducted responsibly and ethically with adherence to all relevant regulations. read more..
- For Authors
- For Reviewer
- Manuscript Guidelines
- Membership
- Publication Ethics
-
- Journals
- Reprints
- e-Books
- Videos
- Policies
- Contact Us
 COVID-19
- Submissions


Full Text
Aspects in Mining & Mineral Science
Phase Transformation in Quartz at Elevated Temperatures
Jiali He, Karin Fjeldstad Jusnes and Merete Tangstad*
Norwegian University of Science and Technology, Norway
*Corresponding author: Merete Tangstad, Norwegian University of Science and Technology, 7491 Trondheim, Norway. Email ID: merete.tangstad@ntnu.no
Submission: December 18, 2020;Published: January 19, 2021

ISSN 2578-0255Volume6 Issue1
Abstract
Natural quartz is a raw material in Si production. During heating, it will go through a series of phase transformations before melting in the furnace, from quartz to an intermediate amorphous phase and further to cristobalite. The formation of the intermediate amorphous and cristobalite phases may affect the permeability and reaction rate in the furnace. Hence, it is crucial to know the quartz behavior. In this regard, the phase transformations in four different quartz types, named A, D, F, G, were investigated in the temperature range of 1500-1650°C. A numerical model was introduced to describe the kinetics of the phase transformations. The kinetic constant of k1 indicated the first-order reaction from quartz to the intermediate amorphous phase, which is in the range of 0.012-0.168min-1; while the rate constant k2 corresponds with the second-order reaction from the intermediate amorphous phase to cristobalite, is calculated in the range of 0.00036-0.0097min-1. The activation energies corresponding to k1 and k2 were calculated as positive(199 to 364kJ/mol) and negative values (-108 to -448kJ/mol), respectively, which indicated the different temperature dependence of these two reaction steps. The negative activation energy in the reaction from amorphous phase to cristobalite signifies that the amorphous phase is more stable at higher temperatures. The effect of impurities and grain size on the kinetics were also discussed in the article. It is verified that the numerical model was reliable to predict the reaction rates and activation energies in the quartz phase transformation at a temperature lower than 1600°C since there was already a soften/melting of quartz at 1650°C in some types.
Keywords: Quartz; Phase transformation; Intermediate amorphous silica; Cristobalite; Kinetics
Introduction
Quartz is, among other things, used as the raw material in the Si production by carbothermic reduction in semi-closed submerged arc furnaces. In this process, a wide temperature gradient is established from top to bottom in the industrial furnace, where the temperature is about 700-1300 ℃ at the top and is gradually increased to above 2000 ℃ at the bottom. Therefore, quartz experiences four different states in the furnace, depending on the temperature: solid, softening, melting, and molten state [1]. Moreover, quartz goes through several phase transformations before melting. The quartz phase transformation is accompanied by volume expansion [2], cracks [3], disintegration [4], and softening [5]. Simultaneously, it will affect the contact area of chemical reactions and also the gas permeability in the furnace and ultimately affect the Si yield. Therefore, researchers have shown an increased interest in the phase transition of quartz at high temperatures. Quartz is a mineral that exists in the form of a stable polymorph in nature. The quartz can transform into different polymorphs during heating. At atmospheric pressure, quartz is known as α-quartz at a low temperature. As the temperature increases to around 573 ℃, α-quartz will transform into β-quartz, and this transformation process is spontaneous and reversible [5]. Further increases to above 873 ℃, β-quartz will transform into tridymite phase [1,5]. However, the tridymite phase is reported that it could be stable only when certain impurities are present, such as alkali and alkali earth metal impurities [3]. At the temperature of higher than 1400 °C, the cristobalite phase will be produced by transforming from β-quartz, which is a reconstructive transformation process [5]. Moreover, it is found that there exists an intermediate phase transformation from β-quartz to cristobalite. First, the β-quartz phase will transform into an intermediate amorphous phase, and then the intermediate amorphous phase will transform into cristobalite phase [2,6,7]. At the melting point of 1713℃, the cristobalite phase starts to melt into a highly viscous liquid in the form of a terminal amorphous state.
The kinetics of quartz phase transformation has been investigated by several researchers, while the published results varied depending on quartz types. Wahl [8] and Labshtanov et al. [9] found that the speed of the phase transition to cristobalite was accelerated by using smaller crystal size, lower grade crystallinity, and high impurities crystal quartz. The grain size is another factor that will affect the phase transition. It is found that smaller grain size quartz would go faster in the transformation to cristobalite [10]. Moreover, impurities in the quartz also affect the phase transition. The effect of Al2O3 on the phase transformation was investigated by Chaklader [11]and Brown et al.[12]. The increase of Al2O3 content in the quartz had the ability to speed up the transformation to cristobalite up to a specific limit. Besides, the alkali and alkali earth elements were also reported to accelerate the cristobalite nucleation and growth [10]. Chaklader [13] assumed that the phase transformations from quartz to amorphous and further to cristobalite were first-order reactions. The first-order reaction model was then used by Jusnes [14], where the phase transformations of four different quartz types were investigated at 1600 ℃and 1700 ℃. It showed that the first-order reaction model was reliable and repeatable in the phase transformation from quartz to amorphous, while the fitting was not good in the phase transformation from amorphous to cristobalite. This could be due to the fact that the investigations were performed at a high temperature, close to the melting temperature. As a result, the following studies investigate the transformation rate at lower temperatures. The first-order reaction model was performed in the phase transformation from quartz to amorphous, and the secondorder reaction model was used from amorphous to cristobalite. This study aims to find a reliable model to investigate the phase transformation in different quartz types. It can then be used to calculate the kinetic rate constant and the activation energy in the phase transformation process.
Materials and Experimental Procedure
Four different quartz types used for the production of Si and FeSi were investigated and are labeled as A, D, F, G, with different geological origins, appearances, and impurities. The quartz has been described clearly by Jusnes [14], and their chemical compositions are listed in (Table 1). The chemical composition was performed by a collaborating company, and the method used is ICP-OES.The quartz was crushed and sieved before heating in the furnace, aiming to get lumps with a weight of ~10g. Then, it was placed in a rectangular Al2O3 crucible and heated in a Nabertherm LHT 04/08 rapid heating furnace at 1500 ℃, 1550 ℃, 1600 ℃, and 1650 ℃, respectively. It is noted that the maximum heating rate was set to be ~50°C/min. After that, a holding time of 0, 30, 60, and 120 minutes was held at the maximum temperature, respectively. In the end, the samples were taken out and placed on a brick to cool to room temperature. For each type of quartz, three lumps were heated together at the same condition in order to obtain more reliable and repeatable results. XRD measurement was performed to confirm the phase formation in the quartz samples. The cooled quartz samples were milled to silica powder using a tungsten carbide planetary disk for 15 seconds at 700rpm. The milling process had proven that it would not affect the phase composition of quartz [15]. Then, the silica powder was dried overnight at 250 ℃ to remove any moisture. The internal standard method [16] was introduced to determine the amorphous phase in the sample, which is the most common quantitative phase analysis method using XRD. In the internal standard method, an accurate mass of highly crystalline α-Al2O3 was added to a known amount of silica powder, which was scaled still hot. The weight fraction of the spiked α-Al2O3 was used as a reference to calculate the amount of other crystalline phases, such as quartz and cristobalite. Finally, the weight fraction of amorphous silica was calculated by subtracting the weight fraction of all the crystalline phases from 100 [17]. Moreover, each sample had three parallel samples to check its repeatability and reliability.
Table 1: The chemical composition of the trace elements in the quartz types used for phase transformation investigations. All the impurities are given in wt.%, except where ppm is stated [14].

The samples were analyzed by XRD after it was mixed in a mortar with acetone. A back-loading device was used to prepare samples to minimize the influence of crystal orientation during loading into the sample holder. Davinci 1 was carried out to analyze the samples, where two or three parallels were analyzed to ensure repeatability of the measurements. Moreover, Topas V5 software was used to quantitatively calculate the phases in each sample. Figure 1 is the XRD pattern of some samples. Three lumps are heated under each experimental condition, and three parallel samples are taken for each lump during the XRD test. Figure 1 shows two of the samples heated at 1600 °C for 0 min, lump 1 and lump 2, and the three parallel samples for lump 1 are exhibited simultaneously. It is easy to see that the scanning result of the three parallel samples are stable, while lump 2 is slightly different from lump 1 in peak strength, which is consistent with the expectation.
Figure 1:XRD patterns of part samples, the corresponding three main peaks of each phase have been indicated as different shapes.

Numerical Model Description
Numerical model is a mathematical representation of a physical (or other) behavior, based on relevant hypothesis and simplifying assumptions to obtain the relevant thermodynamic properties, which used to simulate and predict the behavior of rock mass, materials, and mechanical devices [18-21].
In the study of quartz phase transformation, the relationship is presented as follows.
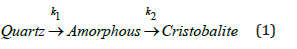
Where k1 and k2 are reaction rate constants for the phase transformation from quartz to the intermediate amorphous phase and from the intermediate amorphous phase to cristobalite, respectively. At present, the reaction from quartz to amorphous is assumed to be a first-order reaction, while the reaction from amorphous to cristobalite is considered to be a second-order reaction. The second-order reaction gave the best fit after investigating the following orders: 0.5, 1, 2, and 3. Hence, the following reaction rates are used.
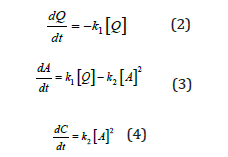
Where [Q], [A], and [C] are the concentration of quartz, amorphous, and cristobalite, separately. Assuming k1 and k2 are independent, the concentration of the formed phases after a timecan be expressed based on the equations mentioned above.
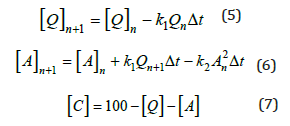
Hence, k1 and k2 can be obtained by fitting the experimental and calculated values. k1 and k2are then used to calculate the activation energy for the phase transformation from quartz to intermediate amorphous, and from intermediate amorphous to cristobalite based on the Arrhenius equation.
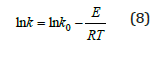
Where k0 is the preexponential factor, E represents the activation energy, R is the gas constant, and T is the reaction temperature.
Results and Discussion
Figures 2-5 show the evolution of the phase transformation of type D, A, F, and G, combined with the modeling results. The dots, triangles, and squares represent the measured amount of quartz, amorphous, and cristobalite, respectively. The experimental data measured by Jusnes [14] is also included. Finally, the calculated results based on the model are represented by lines. It should be noted that three parallel experiments were performed at a set temperature and at a constant holding time.
Type D
The type D quartz is a meta-sandstone with the highest impurity level in our research. It is reported that a significant amount of pores existed in this type of quartz filled with minerals [22]. The impurities for the quartz type D are summarized in Table 1.Figure 2 shows the time dependence of the amounts of phases measured by XRD for quartz type D. For the quartz type D at 1600 °C the quartz concentration was reduced to ~55 wt.% during heating and was found to decrease to 0 wt.% after 120min (Figure 2c). As a result, the phase amount of cristobalite increased to ~90 wt.% from ~30 wt.% with the increase of holding time from 0 to 120min (Figure 2g). However, the amount of amorphous phase increased in the first 20min, and then it decreased with the increase of holding time (Figure 2k). The phase transformation of type Dwas also measured by Jusnes [14] using the same experimental method. The rhombuses point in (Figures 1c, 1g, and 1k)are consistent with our measured results. The phase evolutions at 1500 °C, 1550 °C, and 1650 °C had the same trend as at 1600 °C.At a constant holding time, the transformation went faster as the temperature increased. For example, at the holding time of 0min, the amount of quartz decreased with the increase of temperature, from ~75 wt.% at 1500 °C(Figure 2a) to ~30 wt. % at 1650 °C for the quartz phase (Figure 2d). For amorphous and cristobalite phases, the case is the opposite. The amount of these two phases increased with the increase of holding temperature. This trend is also applied for the holding time of 30, 60, and 120min.
Figure 2: The evolution of phase transformation for quartz type D after heating to 1500 °C, 1550 °C, 1600 °C, and 1650 °C, the points represents the experimental results, and the lines represent the calculated curves.

Type F
The quartz type F consists of large-deformed grains with a size of 1-3cm. The contaminants mainly existed between quartz grain boundaries, and the fluid inclusions were relatively abundant and observed along with healed fractures [23]. The impurities for the quartz type F are summarized in Table 1.Type F has a similar transformation trend with type D, the amount of quartz was gradually consumed with the extension of hold time and increase of maximum temperature, and the amount of intermediate amorphous phase first increased and then consumed, while the amount of cristobalite phase gradually accumulate to as high as 100 wt.% (Figures 3k &3l).
Figure 3: The evolution of phase transformation for quartz type F after heating to 1500 °C, 1550 °C, 1600 °C, and 1650 °C, the points represents the experimental results, and the lines represent the calculated curves.

Type A
The quartz of type A is gravel quartz with a low amount of fluid inclusions and cracks. Two texture domains were observed in this type of quartz, where domain 1 has medium to coarse-grained quartz with the size in the range of micrometer to millimeter scale, and another domain has 10-200 micrometers thick and a few millimeters long grains [24]. The impurities in the quartz type A are given in Table 1.The evolution of phase transformation in quartz type A is shown in Figure 4. The phase transformation trend at and before 1600 °C was similar to type D and F. However, as the temperature increased to 1650 °C, the amount of quartz dropped sharply. At the holding time of 0 minutes (Figure 4d), the amount of quartz in the three samples was 1.8 wt. %, 1.9 wt. %, and 9.4 wt. %, respectively. At the same experimental condition, the amount of quartz was measured to be ~20 wt. % by Jusnes [14]. Then it went down to nearly 0 wt. % after 60 minutes. In addition, the amount of cristobalite did not increase with the increase of temperature. On the contrary, the amount of cristobalite was less than 100 wt.% at 1650 °C(Figure 4l), compared to the results at 1500 °C(Figure 4i), 1550 °C(Figure 4j), and 1600 °C(Figure 4k). It shows that the type A might have partially softened and melted at 1650 °C.Furthermore, the experimental data of type A has generally a high dispersion, it might be caused by its texture or the uneven grains.
Figure 4: The evolution of phase transformation for quartz type A after heating to 1500 °C, 1550 °C, 1600 °C, and 1650 °C, the points represents the experimental results, and the lines represent the calculated curves. The model is not used at 1650 °C as the sample then was partly softened/molten.

Type G
The type G is gravel quartz with large visual differences in the lumps. It is found that three different regimes were observed in the samples. Regime 1 contains the highest content of fluid inclusions and trace elements, and the size of the grains is a few centimeters. The fluid inclusion in regime 2 is less than regime 1, while it is the least in regime 3. Moreover, regime 3 shows recrystallization and strain-free grains. Roughly, the distribution of the regimes in the quartz type G is 74% regime 1, 22% regime 2, and 4% regime 3 [25]. The impurities in the quartz type G are given in Table 1.The evolution of phase transformation in quartz type G is shown in Figure 5. In general, the quartz type G shows a similar trend as the quartz type D, A, and F at the holding time lower than 1600 °C. The increase of holding time and temperature will improve the transformation of quartz to amorphous. However, at the holding temperature of 1650 °C(Figures 5d, 5h, and 5l), quartz was consumed, more amorphous and less cristobalite remained. Since the existence of impurities decreased the actual melting point of silica, it is difficult to distinguish the intermediate amorphous phase and soften or melted terminal amorphous phase. These anomalies might result in partial melting of quartz at 1650 °C.The measured values also had large variations at the same experimental conditions for the type G. As seen in Figure 5c, at the holding time of 0min at 1600 °C, the amount of quartz phase varied from 36 wt.% to 69 wt.%. Hence, it is believed that the transformation process of quartz type G was complex. It could be affected by the varied grain size, fluid inclusions, and degree of recrystallization.
Reaction rate of transformation
The lines in Figures 2-5 show the calculated results based on equations (5)-(7). It is seen that the agreement between the calculated and measured values based on XRD was varying; however, it describes the main trends of the transformations from quartz to cristobalite. The kinetic constants of k1 and k2 in the model are summarized in Table 2. The sum of the squared difference between the modeled and experimental values for each phase’s amount is also presented in the table. In general, the value of k1 was higher than k2 at a constant temperature for the same quartz type. Moreover, with the increase in temperature, the k1 value increased. In contrast, the k2value decreased except for the quartz type F. This means that the phase transformation rate from quartz to amorphous increased, and phase transformation speed from amorphous to cristobalite decreased as increased temperature. For quartz type F, the value of k2decreased from 0.0097min-1 at 1500 °C to 0.0024min-1 at 1600 °C, and then it increased to 0.0055min-1 at 1650 °C, which is not expected.The k1 values were also calculated by Jusnes [14] and Chaklader [13], in which the range of 0.002-0.13min-1 was obtained by Jusnes at 1600 °C for the quartz type D, A, F, and G, and the value of 0.0013min-1 was obtained by Chaklader at 1560 °C. Compared to our calculated values at the same temperature, the reported values were lower than the present results. Moreover, the k2 values were calculated by Jusnes [14] and Chaklader [13] by assuming the reaction from amorphous to cristobalite as the first-order reaction. The k2 value was calculated in the range of 0.004-0.046min-1 at 1600 °C by Jusnes, and 0.0029min-1at> at 1560 °C by Chaklader. Jusnes values were higher than our present values and Chaklader’s value had a good agreement with our results. However, as they used firstorder models, this cannot be directly compared.
Figure 5: The evolution of phase transformation for quartz type G after heating to 1500 °C, 1550 °C, 1600 °C, and 1650 °C, the points represents the experimental results, and the lines represent the calculated curves. The model is not used at 1650 °C as the sample then was partly softened/molten.

Table 2: Summary of the value of k1 and k2 values for four different quartz types at different temperatures. The relevant squared values are also listed in the table, where xm represents the modeled value, xe represents the experimental value, and n represents the number of measurements used for the optimization

Figure 6: Arrhenius plot for different quartz types in the temperature range 1500-1650 °C.

Figure 6 represents the Arrhenius plot for the four different quartz types, which is used to determine the apparent activation energy, Ea, of the phase transition process from quartz to intermediate amorphous and from intermediate amorphous to cristobalite. The calculated activation energies and the corresponding linear fitting coefficient of lnk1 and lnk2 to 1/T are summarized in Table 3. For the phase transformation from quartz to intermediate amorphous, type D had the highest activation energy (364kJ/mol), while type A had the lowest value of 199kJ/ mol. The transition ability from quartz to amorphous was increased as the order: D-F-G-A. For the transformation from intermediate to cristobalite, the calculated activation energies are all negative for the four quartz types. It indicates that the rate of the transition from amorphous to cristobalite decreased as temperature increased. The points in Figure 6 are not giving an equally good fit for all the types of materials, that may indicate not an optimal model used. However, to obtain a robust model that describes the main features of the phase transformations, these simplified first- and second-orders models were chosen in this work. This is especially the case for type F giving a very low R2 as shown in Table 3.The kinetics of the phase transformation in the quartz had been investigated by many researchers. The phase transformation rate was reported to mainly be affected by its impurities [10-12], grain size [10], and crystal size [13].
Table 2: Summary of the activation energy and the linear fitting coefficient R2 of lnk1 and lnk2 to 1/T, Ea, for the transformation from quartz to amorphous phase, Q→A, and from amorphous to cristobalite phase, A→C.
Impurities in the quartz would affect the phase transition. It is reported that the increase of alkali and alkali earth impurities could speed up the phase transformation process [10]. Moreover, the impurity of Al3+ has the ability to accelerate the phase transition from quartz to cristobalite [11,12]. As shown in Table 1, the content of alkali and alkali earth impurities is F>D>A>G, while the corresponding range of Al is D>A>F>G. As for the values of k1 and k2 calculated in the model based on a large amount of experimental data, there is no uniform tendency of their magnitude change. When the temperature is 1550℃, k1 changes as G>A>D>F, which is completely opposite to the tendency of alkali and alkali earth. That is to say, at 1550℃, the higher the alkali and alkali earth content, the lower rate of reaction from quartz to intermediate amorphous. Besides, at 1550℃, the level of k2 is D>G>F>A, so for A, F, and G three types, the rate of the reaction from intermediate amorphous to cristobalite is reduced as the increase of Al content. On the other hand, the values of k1 are at least one order of magnitude larger than k2, which is applicable for all types of investigated quartz, as shown in Table 3, so k1probably dominates the entire reaction process (from quartz to cristobalite). Then,considering the whole phase transition process from quartz to cristobalite, it is difficult to verify the promotion of alkali and alkali earth impurities and Al impurities, which is contrary to the previous studies[10-12]. The effects of these impurities still need further investigation. Grain size also can affect the quartz phase transformation. Schneider et al. [10] found that the transformation to cristobalite would be accelerated by using a smaller grain size. The grain size for the four different quartz types is decreased in the order: F-G-A-D. However, the ability for the phase transformation from quartz to amorphous is increased as D-F-G-A, which is not relevant to the grain size. If the fine-grained quartz type D (0.2-1mm) is not considered, the present observation is consistent with Schneider et al. [10]. The grain size will affect the phase transformation in the range of 1-3cm.
Conclusion
The phase transformations in the four different quartz types are investigated at temperatures of 1500 °C, 1550 °C, 1600 °C, and 1650 °C. With the holding time from 0min to 120min, it is found that four types of quartz show different rates for the phase transitions from quartz to amorphous and further to cristobalite. The rate from quartz to amorphous phase is calculated by a firstorder model and from amorphous to cristobalite as a secondorder model. The rate constant from quartz to amorphous phase, k1, is calculated in the range of 0.012-0.168min-1, while the rate constant from amorphous phase to cristobalite, k2, is calculated in the range of 0.00036-0.0097min-1. The activation energy from quartz to the intermediate amorphous is positive (199 to 364kJ/ mol), which indicates the increasing temperature can accelerate the transformation from quartz to the intermediate amorphous silica. The calculated activation energy from amorphous to cristobalite is negative (-108 to -448kJ/mol), which means that the amorphous phase is more stable at high temperatures compared to quartz and cristobalite. It is found that the increase of alkali and alkali earth impurity might slow down the phase transformation from quartz to amorphous; the rise of Al impurity may lead to a decrease of the reaction rate from amorphous to cristobalite. The phase transformation from quartz to amorphous can be modelled by a first-order reaction model and from amorphous to cristobalite by a second-order reaction model. Last but not least, type A and type G might be partially softened/melting at 1650 ℃. Before 1600℃, the numerical model fits well with the experimental values and can be used to predict the reaction rates and activation energies in the quartz phase transformation.
Acknowledgment
This paper is published by permission of Elkem AS. The Research Council of Norway and Elkem Technology are appreciated for their financial support through the project High Temp Quartz-Methods for characterization of quartz properties predicting performance in high-temperature applications with project number 252212.
References
- Nordnes E (2019) Softening and melting properties of quartz. Master Thesis, Norwegian University of Science and Technology, Norway.
- Ringdalen E (2015) Changes in quartz during heating and the possible effects on Si production. JOM 67(2): 484-492.
- Jusnes KF, Tangstad M, Ringdalen E (2018) Phase transformations from quartz to cristobalite. Extraction pp. 717-727.
- Jusnes KF, Tangstad M, Ringdalen E (2018) Shock heating test of quartz for Si and FeSi production.
- Jusnes KF (2016) Parameters affecting softening and melting of quartz. Master Thesis, Norwegian University of Science and Technology, Trondheim, Norway.
- Aasly K (2008) Properties and behavior of quartz for the silicon process. Ph.D Thesis, Norwegian University of Science and Technology, Trondheim, Norway.
- Chaklader ACD, Roberts AL (1961) Transformation of quartz to cristobalite. J Am Ceram Soc 44(1): 35-41.
- Wahl FM, Grim RE, Graf RB (1961) Phase transformations in silica as examined by continuous x-ray diffraction. Am Mineral 46(9-10): 196-208.
- Lakshtanov DL, Sinogeikin SV, Bass JD (2007) Phase transformations in silica as examined by continuous x-ray diffraction. Phys Chem Miner 34(1): 11-22.
- Schneider H, Majdic A, Vasudevan R (1986) Kinetics of the quartz-cristobalite transformation in refractory-grade silica materials. Mater Sci Forum 7: 91-102.
- Chaklader ACD (1961) Effect of trace Al2O3 on transformation of quartz to cristobalite. J Am Ceram Soc 44(4): 175-180.
- Brown SD, Kistler SS (1959) Devitrification of High-SiO2 Glasses of the System Al2O3-SiO2. J Am Ceram Soc 42(6): 263-270.
- Chaklader ACD (1963) X-Ray study of quartz-cristobalite transformation. J Am Ceram Soc 46(2): 66-71.
- Jusnes KF (2020) Phase transformations and thermal degradation in industrial quartz. Norwegian University of Science and Technology, Trondheim, Norway.
- Ringdalen E, Tolchard J, Thomassen E (2017) Evaluation of methods used to measure amount of phases in silica. Sintef Trondheim, Norway.
- Madsen IC, Scarlett NVY, Kern A (2011) Description and survey of methodologies for the determination of amorphous content via X-ray powder diffraction. Zeitschrift für Krist Cryst Mater 226(12): 944-955.
- Kjelstadli ME (2016) Kinetics and mechanism of phase transformations from quartz to cristobalite. Master Thesis, Norwegian University of Science and Technology, Trondheim, Norway.
- Zafarparandeh I, Lazoglu I (2012) Application of the finite element method in spinal implant design and manufacture. The Design and Manufacture of Medical Devices pp. 153-183.
- Brischke C, Humar M (2017) Performance of the bio-based materials. pp. 249-333.
- Sirois F, Grilli F (2015) Potential and limits of numerical modelling for supporting the development of HTS devices. Supercond Sci Technol 28: 4.
- Li CC (2017) Rockbolting: Principles and applications.
- Pevik JA (2015) Geological and mineralogical characterization of the upper part of the gamasfjell quartzite at the vaggecearu mountain. Master Thesis, Norwegian University of Science and Technology, Norway.
- Seljeset K (2018) Trace element study of quartz from nasafjell. Master Thesis, Norwegian University of Science and Technology, Trondheim, Norway.
- Veisal TB, Filipowicz A (2020) Develop new tools for exploration of quartz sources: Quartz textures significance for fines generation during handling and thermal fracturing and melting of quartz in furnace. Elkem ASA, Internal Project Report, USA.
- Filipowicz A (2018) Characterization of quartz raw material for ferrosilicon and silicon alloy applications. Master Thesis, Aarhus University, Denmark.
© 2021 Merete Tangstad. This is an open access article distributed under the terms of the Creative Commons Attribution License , which permits unrestricted use, distribution, and build upon your work non-commercially.
Editor In Chief


.jpg)


Signup for Newsletter

Quick Links
 Editorial Board Registrations
 Submit your Article
 Refer a Friend
 Advertise With Us
Our Recent Edition

.jpg)


Top Editors


.jpg)


.bmp)
.jpg)
.png)
.jpg)


.jpg)


.png)

.png)


.png)


Financial Support

Sponsors

Latest e-Books

Latest Video

 a Creative Commons Attribution 4.0 International License. Based on a work at www.crimsonpublishers.com.
Best viewed in
a Creative Commons Attribution 4.0 International License. Based on a work at www.crimsonpublishers.com.
Best viewed in