- Submissions

Full Text
Aspects in Mining & Mineral Science
Analysis Sources of Wheel Loader by the Visualization Methods
Miroslav Badida*, Marek Moravec, Tibor Dzuro and Miroslava Badidova
Technical University of Košice, Faculty of Mechanical Engineering, Department of Process and Environmental Engineering, Slovakia
*Corresponding author: Miroslav Badida, Technical University of Košice, Faculty of Mechanical Engineering, Department of Process and Environmental Engineering, Park Komenského 5, 042 00, Košice, Slovakia
Submission: October 28, 2020;Published: December 21, 2020

ISSN 2578-0255Volume6 Issue1
Abstract
The paper deals with analyses and diagnostics sound sources of wheel loader. Noise visualization tool is taking an image of the noise emitting object. At the same time are exactly computed by the special developed software sound map and combines the acoustical and the optical images of the sound source. Results of noise visualization enable diagnostics of critical components and provide background for constructors for noise reduction measures.
Keywords: Noise; Visualization; Frequency; Acoustic camera
Introduction
For the purposes of diagnostics and analysis and for the identification and localization of noise sources, a unique noise visualization device was used - an acoustic camera [1-3]. This modern tool is suitable for making complicated measurements of large noise sources in order to identify them and for subsequent quantitative and qualitative analysis. The set of devices constituting the acoustic camera is a revolutionary solution for the spatial localization of noise emissions and quantitative evaluation and frequency analysis of them on a dynamic basis. The amount of information obtained and analyzable is incomparable to all the methods used so far, which consisted in measuring noise emissions at emission points, the number of which is considerably limited. The acoustic camera offers the possibility of perfect frequency analysis of noise sources, over a distance from 1 meter to several tens of meters. The software supplied can effectively locate noise sources, perform qualitative and quantitative analysis, and thereby form the basis for measures aimed at reducing noise emissions [4]. The whole measurement process and subsequent analysis are characterized by [5,6]:
a. high accuracy,
b. high speed,
c. a dynamic style of work,
d. high efficiency,
e. clear processing of results (noise maps in color, videos, audio recordings).
An acoustic camera is a modular and flexible tool for visualizing, locating and analyzing noise sources. Through visualization, exact results and rapid results it reduces the development times for subsequent technical measures [7].
Procedure and Conditions for Measurement
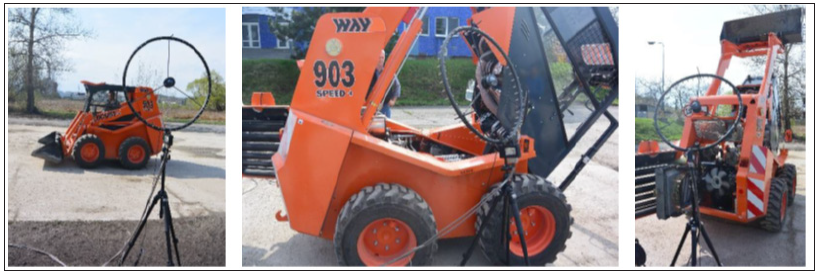
Measurements to visualize the sources of noise from the wheel loader were made using an acoustic camera. All the most important sources of noise on this structure were visualized using this device. Spectral analysis of these sources was also carried out to better understand the character and nature of the noise sources. Measurements were made with a focus on the front loader as a whole, from all sides. Subsequently, measurements were made focusing on the powertrain when the front loader was exposed from several sides and when lifting the shovel. The front loader’s movements were also visualized from both sides. Measurements were made at an engine speed of 2500rpm. During the measurements, all critical acoustic events were captured. Measurements were also made using an audio analyzer for recording other acoustic descriptors. Selected measurements are presented in the annex. The measurements were made outdoors on a flat reflective asphalt surface. The view of the wheel loader and the installed acoustic camera is shown in Figure 1.
Figure 1: View of wheel loader and the installed acoustic camera.

Results of Noise Measurement and Visualization
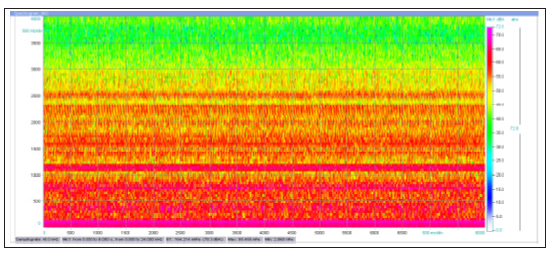
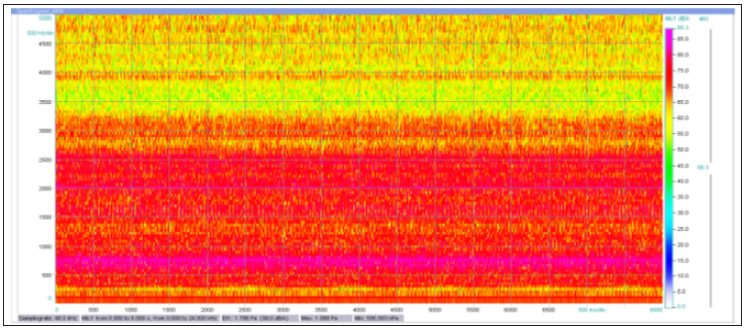
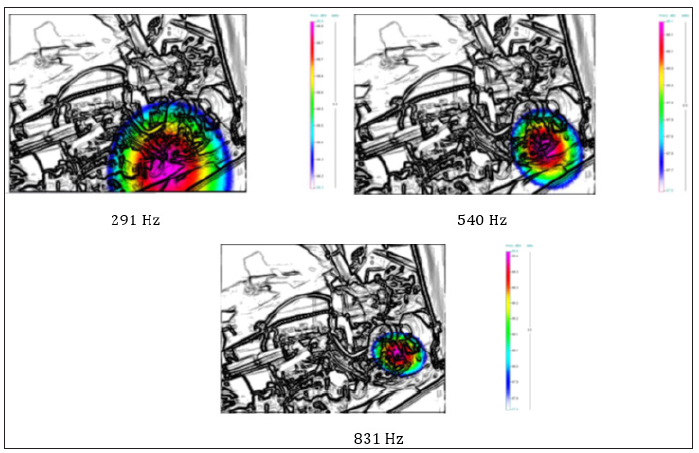
The following images present selected results from the measurement and visualization of the dominant noise sources on the wheel loader. The results from the visualization are presented as real images, in some cases for better viewing they are shown with contour representation. A spectrogram has been taken for each measurement to show which frequencies are dominant. Acoustic images have been produced for the entire spectrum and, where needed, on the basis of information from spectrograms and also for the individual dominant frequencies. (Figure 2) presents the results of the noise visualization with a side view of the wheel loader. Figure 3 shows the noise spectrogram when measuring from the side. The dominant frequency areas are evident from the spectrogram. It is then possible to create acoustic images at these frequencies, from which it will be apparent where the sound of a given frequency is emitted from. (Figure 4) presents the results of noise visualization from measurements focused on the wheel loader powertrain. Figure 5 shows the spectrogram of noise measured from the side. The dominant frequency areas are apparent from the spectrogram. Subsequently, the dominant frequency areas were identified on the basis of the spectrogram. Acoustic images were generated for those frequency bands, in order to locate and identify sound emission points for the corresponding frequencies. Figure 6 shows the sound emissions at 291Hz, 540Hz and 831Hz.
Figure 2: Noise visualization over the entire frequency band-side view (real and contour view).

Figure 3: Noise spectrogram from measuring the wheel loader from the side.

Figure 4: Noise visualization over the entire frequency band-powertrain (real and contour display).

Figure 5: Noise spectrogram from measuring the wheel loader-powertrain.

Figure 6: Noise visualization for selected frequency bands-powertrain.

Conclusion
Noise visualization makes it possible to diagnose critical points from the point of view of noise emissions. Its application is particularly appropriate for complicated noise sources. Visualization results in an acoustic image that can identify and locate critical areas. It is also possible to carry out quantitative and qualitative analyses of partial noise sources. From spectrograms it is possible to identify the dominant frequencies and by creating acoustic images it is again possible to locate the components that emit the given frequencies. During measurement of the wheel loader the points of noise transfer through the hood were identified, with measurements taken from all four sides. The decisive source of noise is, of course, the powertrain. For this reason, measurements were made with a focus on the individual parts of the system. The noisiest parts were identified from the measurements and subsequent frequency analysis identified the components that emit noise in the dominant frequency bands. Only selected measurements are presented in the article. The measurements that were made diagnosed critical points and components in terms of noise emissions and serve as a basis for developers and engineers. On the basis of these measurements, it is possible subsequently to implement measures to reduce noise (installation of noiseinsulating materials, change of hood structure, replacement of problem components).
Acknowledgement
This work was supported by project no. APVV 15-03217 Development and research of methods for optimization of acoustic properties and acoustic quality of noise emitting devices.
References
- Döbler D, Heilmann G (2005) Perspectives of the acoustic camera. Environmental Noise Control. Brazil.
- Miljko ME (2011) Some research challenges of acoustic camera. 19th Telecommunications forum TELFOR 2011. Serbia, Belgrade.
- Liptai P, Badida M, Lumnitzer E, Moravec M (2010) Application of acoustic camera in industrial site-2010. Journal of Production Engineering 13(1): 73-76.
- Moravec M, Badida M, Piňosová M, Dzuro T, Badidová A (2019) Innovative application options of sound visualization tools. In: ICTEP 2019: Proceedings of International Council on Technologies of Environmental Protection. Danvers, USA.
- Moravec M, Liptai, P (2007) Application of an acoustic camera in solving the problem of industrial noise. In: Novus Scientia 2007, 10th National Conference of Doctoral Students of Engineering Faculties of Technical Universities and Colleges with International Participation, Košice, Slovakia. pp. 401-405,
- Liptai P (2007) Dynamic noise Visualization by the acoustic camera. In: Environmental Management And Engineering, TU Košice, Slovakia. pp. 269-276.
- Moravec M, Lumnitzer E, Lukáčová K (2011) Application of acoustic camera for machine dynamic noise visualization and diagnostic and quality. Annals of Faculty of Engineering Hunedoara, Romania. pp. 31-32.
© 2020 Miroslav Badida. This is an open access article distributed under the terms of the Creative Commons Attribution License , which permits unrestricted use, distribution, and build upon your work non-commercially.
 a Creative Commons Attribution 4.0 International License. Based on a work at www.crimsonpublishers.com.
Best viewed in


.jpg)


 Editorial Board Registrations
 Submit your Article
 Refer a Friend
 Advertise With Us
.jpg)


.jpg)


.bmp)
.jpg)
.png)
.jpg)


.jpg)


.png)

.png)


.png)


