- Submissions

Full Text
Aspects in Mining & Mineral Science
The Disruptive Role of Process Mineralogy in Geology and Mineral Processing Industry
Grammatikopoulos T* and Downing S
SGS Canada, Canada
*Corresponding author: Tassos Grammatikopoulos, SGS Canada Inc. 185 Concession Street, Lakefield, Canada
Submission: July 03, 2020;Published: July 15, 2020

ISSN 2578-0255Volume5 Issue2
Abstract
Most ore deposits are complex and display a high degree of variability, arising from their inherent geological and mineralogical characteristics, which impact their beneficiation. Process mineralogy has been disruptive in the last two decades for geological exploration and for the mineral processing industry. Minerals are multicomponent elemental systems. Therefore, it is crucial and fundamental to understand the distribution of both minerals and metals they carry. Process mineralogy provides critical quantitative data i.e., mineral mass, liberation, and association of the minerals. Data can be used to determine variability of the ore, help to design, and develop the flowsheet to avoid extensive and time-consuming bench testing, and act as diagnostic to the beneficiation process. Automated mineralogy is commonly coupled with other advanced mineralogical techniques and can be implemented on projects throughout the mining chain, from initial stages of exploration to production. In this paper, we discuss concepts and examples of automated mineralogy applied to exploration and feasibility level.
Keywords: Process mineralogy; QEMSCAN; TIMA-X; Mineral liberation; Base; Critical; Precious metals
Abbreviations: QAM: Quantitative Automated Mineralogy; REE: Rare Earth Elements; EPMA: Electron Probe Micro Analysis; LA-ICP-MS: Laser Ablation Inductively Coupled Plasma Mass Spectrometry; D-SIMS: Dynamic Secondary Ion Mass Spectroscopy
Introduction
Quantitative automated mineralogy (QAM) using SEM based instrumentation such as QEMSCAN and TIMA-X is now routinely applied to the study the ore deposits for geometallurgical and mineral processing. QAM, coupled with geological, geochemical, mineral chemistry and data analysis, is used to solve specific problems for mining and processing (e.g. [1]). A large number of publications and case studies in the last two decades deal with applications of various forms of QAM in geology and geometallurgy, but more critical in the mineral processing industry. QAM can be used in the better understanding of the geometallurgy of the ores (e.g., [2]) which has developed over the past 20 years to deal with the variability in metal recovery encountered in large tonnage base metal deposits (i.e., copper porphyries to interpret variations in hardness that affect grinding or the presence of clays that impact flotation processing). QAM provides mineralogical parameters which can be used to map the degree of variability of the ore (textures, mineral speciation, metal hosts, hardness, grain size, recoverability), or investigate the performance of a flotation plant to understand copper, gold losses, and predict and forecast throughput and grade controls. Metallurgists have been aided in this by the availability of new tools and concepts in process mineralogy [1, 3-13] that allow fast and thorough characterization of the ores that can substantially define and help the metallurgical process(es). These tools reduce considerably the need for the traditional trial and error processes using bench testing for flowsheet development, resulting in savings of time and money. Speciation, liberation and monitoring of ore minerals is crucial. Thus, the distribution of copper and nickel minerals has been used to understand the behavior and recovery of minerals and associated metals in the plant (e.g., [14]), but also define geometallurgical domains where the nickel recovery is linked to degree of ore serpentinisation [15].
Quantification of mineralogical parameters for a variety of ores including precious (Au, Pt) [16,17]), and base metals and critical elements such as rare earth elements (REE), Li, Nb-Ta [18], can be applied to exploration, or lead to the identification of distinct zones with specific metallurgical properties to domain the deposit [19]. For example, domains can be defined based on the heavy (HREE) or light rare earth element (LREE) mineral carriers, or Nbphases (e.g., pyrochlore, columbite or Nb-bearing Fe-Ti-oxides), Li-carriers (e.g., spodumene, petalite and Li-bearing micas), Cu species (sulphides, oxides), or chemical forms of gold (microscopic and submicroscopic). Furthermore, grain size, exposure, liberation and association, mass distribution by size, of critical element and associated gangue minerals can indicate: the optimum liberation size and possible grinding effects; potential recovery methods such as flotation using the exposure of the minerals, or gravity upgrading using the specific gravity characteristics of the minerals. Rare earth mineral (REM) speciation (e.g., monazite, xenotime, REE silicates and others) can dictate the recovery process i.e., flotation, gravity, magnetic separation or a combination of the above, and inform on leaching potential of such phases. This speciation is important to understand the mining geology and design a mine plan because minerals which will carry different concentrations of the element of interest and will affect both grade and recovery. The elemental deportment becomes essential to the resource evaluation of an orebody as each mineral may have a different economic value [20]. Therefore, the mineralogical information can delineate the deposits based on specific inherent mineralogical features and be linked to different metallurgical responses, rather than be used purely to describe geological features. These are some of the parameters that can be used to predict metallurgical response. Data from analytical techniques such as Electron Probe Micro Analysis (EPMA), Laser Ablation Inductively Coupled Plasma Mass Spectrometry (LA-ICPMS), Dynamic Secondary Ion Mass Spectroscopy (D-SIMS) and others can be integrated to further link the automated mineralogy to geology, mining and processing. This paper discusses some key parameters that can be used for the interpretation of mineralogical data for process mineralogy, geometallurgy and beneficiation.
The Significance of Bulk Mineralogy
The proper mineral identification is critical for all projects because (i) not all minerals are recoverable using the same method; (ii) metals are hosted by a number of minerals; (iii) certain minerals might be deleterious (e.g., arsenopyrite), or host harmful elements (e.g., Hg). Copper can be hosted by sulphides and sulfosalts such as chalcopyrite, cubanite, bornite, chalcocite, but also carbonates (malachite) and silicates (i.e., chrysocolla), or oxides, native Cu etc. Nickel in magmatic deposits is typically hosted by sulphides such as pentlandite, millerite, heazlewoodite, gersdorffite but also ferromagnesian minerals (i.e., olivine, serpentine), Cr-Fe-oxides, and pyrrhotite, while nickel in lateritic ores may have different hosts including Fe-oxyhydroxides, chlorites, clays and others. Lithium is typically hosted by spodumene and petalite in hard rock pegmatites, but also micas such as lepidolite group, phosphates (amblygonite) and others. REE deposits can be even more complicated with the presence of minerals such as phosphates e.g., monazite, xenotime, allanite, fluorocarbonates such as bastnasite and synchysite, oxides such as fergusonite, and other potential REE-Y minerals such as zircon, apatite and titanite. The mineral speciation can provide guidance to the zonation of the ore, and recoverability of minerals and metals. For example, deposits can be mapped based on the ratio of the sulphides e.g., chalcopyrite/cubanite in magmatic deposits, chalcopyrite/bornite/chalcocite in porphyry deposits, pentlandite/pyrrhotite in magmatic deposits, HREM /LREM or REE Silicates/phosphates/fluorocarbonates/oxides in carbonatites and alkaline granites.
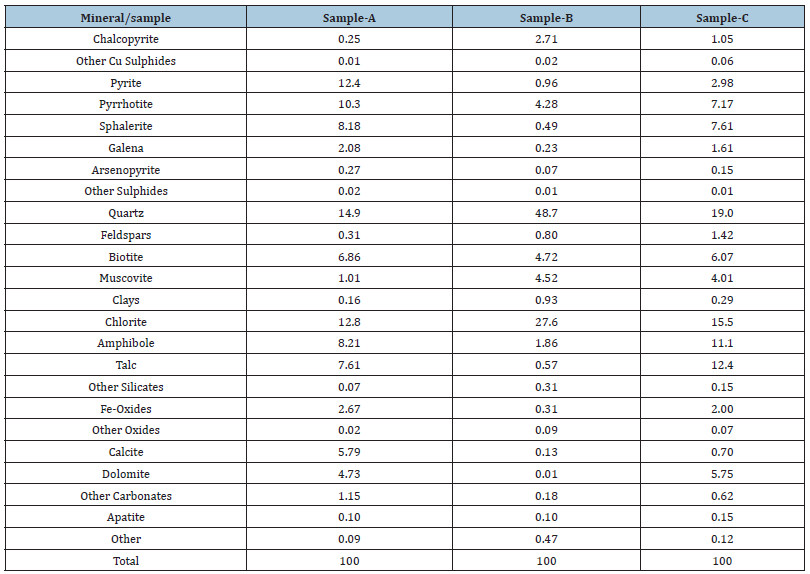
This leads to proper metal/element speciation and deportment (Cu, Ni, REE), and potentially domaining of a deposit which will also reflect the recovery potential. Thus, Cu sulphides would be recovered together. However, the ratio of the sulphides e.g., chalcopyrite/cubanite in magmatic deposits, chalcopyrite/ bornite/chalcocite in porphyry deposits will dictate the final Cu grades. REE phosphates and silicates float differently and rejection of either one of them during flotation can lead to low REE grades of concentrates. Geochemical analyses cannot alone be used to calculate the type of minerals and the metal distribution in the deposits due to the multiple hosts of the minerals. For example, Cu speciation by chemical analyses is always reliable to separate CuS from non-secondary Cu minerals such malachite and chrysocolla. High oxide copper values from geochemical analysis can include Cu derived from chalcocite, and therefore classify large reserves of the ore as oxide and non-recoverable. Table 1 shows the bulk mineral abundance of three feed samples from three different parts of a Zn deposit. It is clear from the mineralogy that the deposit displays variability with regards to the main economic (Cu, Zn and Pb) and gangue sulphides (pyrite, pyrrhotite and arsenopyrite). However, phyllosilicates such as talc and micas, and clays also vary among the samples. The importance of understanding phyllosilicate gangue mineralogy is also crucial. These minerals exist as common gangue minerals and present challenges during ore beneficiation with issues arising throughout the processing circuit [21]. Talc readily reports to the flotation concentrate due to its natural hydrophobicity, and can increase the viscosity in the froth phase, resulting in a reduction in both grade and recovery [22,23]. Chlorite and amphibole are a major source of magnesium and can affect the Zn/Cu/Pb grades if not rejected. Identification of clays (i.e., swelling) requires additional investigation because their presence can be detrimental in flotation. In gold deposits, the early identification of cyanicides (e.g., copper minerals), iron sulphides, and oxygen consumers (e.g., pyrrhotite, marcasite), is rather critical during mineral processing [17]. The ratio of carbonates to potentially acid generating sulphides (e.g., pyrite and pyrrhotite), coupled with their liberation, locking characteristics and grain size, provides an early diagnostic tool to identify environmental attributes. Therefore, the bulk mineralogy of the ore offers a variety of evidence that can be properly utilized depending on the nature of the project.
Table 1: Bulk mineralogy of three feed samples.
Mineral Chemistry and Elemental Distribution
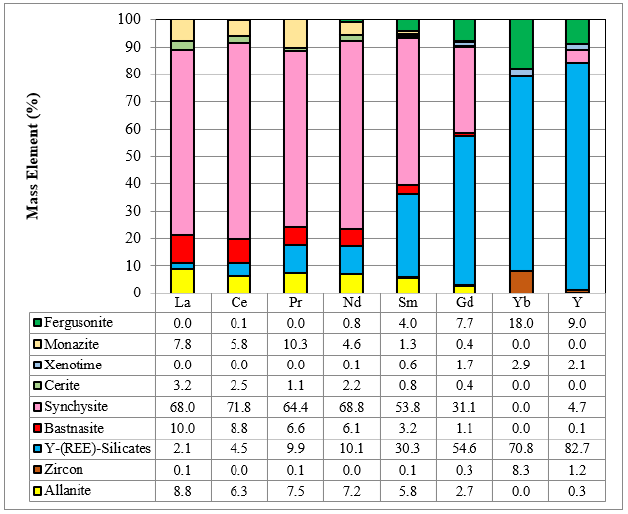
A variety of ore minerals commonly display a wide-range of solid solution compositions that vary among and across deposits. Both the major and trace element concentrations are important for exploration and downstream processes. Mineral chemistry is determined by EPMA (major and trace elements such as Zn, Fe, Cu, Ni, As in sulphides) LA-ICP-MS (trace elements such as Ga, Cs, In, and light elements such as Li in micas, spodumene etc.) and D-SIMS (gold concentration in sulphides). For example, REM such as monazite, xenotime, and fluorocarbonates do not have a fixed composition. Thus, Ce, La, Sm, Y, and also Th and U can vary significantly. In addition, commonly occurring phosphate and silicate minerals (e.g., apatite, zircon, fluorite, titanite) can carry significant REE in their matrices or as minute inclusions. Total REE concentrations can reach 7% in titanite and 12% in apatite and are widely variable in zircon (up 10%) in some ores [19]. Therefore, the elemental distribution can be calculated based on the mineral mass and elemental concentrations from the EPMA. The distribution of the REE is critical because it provides insights to the main LREE and HREE carriers. It enables mass balance calculations to predict potential concentrates and tailings losses. Figure 1 illustrates an example of the deportment calculated for a feed sample from a REE deposit. Synchysite accounts for most of the LREE whereas the Y-REE silicates for most of the HREE. Given the fact that minerals are multi component element systems, mineralogical analysis is mandatory to determine the elemental distribution. The presence of Th and U is rather critical and will have to be dealt with in the downstream processes. For Li ores, mineral chemistry is important to determine the Li and trace elements, Cs, Rb, Ta, Nb in the spodumene, micas and other associated minerals. The Li content in spodumene might vary among deposits due to geological effects (e.g., alteration). Micas can contain Li which will affect the overall Li distribution in the sample. On the other hand, Fe in the spodumene will dictate its final saleable grade. Furthermore, it has been shown [20] that the natural spodumene crystals have lattice defects, including isomorphous substitution of Fe, Mn, and Cr. Such substitutions affect surface features, such as hydrophobicity of minerals and collector adsorption on mineral surfaces. Microflotation experiments, FTIR analysis, and contact angle results showed that higher Fe contents favored the oleate adsorption on spodumene surface [20]. Therefore, proper analytical methods and accurate determination of elemental substitutions in the spodumene lattice can be further evaluated in flotation response of the mineral.
Figure 1: REE-Y deportment in a feed sample.
Mineral chemistry can also determine potential unwanted and deleterious elements that affect the concentrate. Similarly, in base metal deposits, common deleterious and penalty elements do not always occur as discrete minerals that can be removed (e.g., arsenopyrite or bismuthinite) but are part of the crystal lattice of the minerals (e.g., Bi in chalcopyrite, Hg in Cu-sulfosalts, Cd in sphalerite etc.). Identification of minerals that carry the ore elements is impossible to determine with geochemical analyses alone. The understanding of the mineral and metal distribution is critical for beneficiation processes. Nickel in pentlandite, pyrrhotite, and Fe- Mg-silicates vary widely, and the Ni distribution will affect not only the final grades, but the economics of the deposits. For example, Ni in Fe-Mg minerals and pyrrhotite is considered refractory and non-recoverable.
Liberation and Association
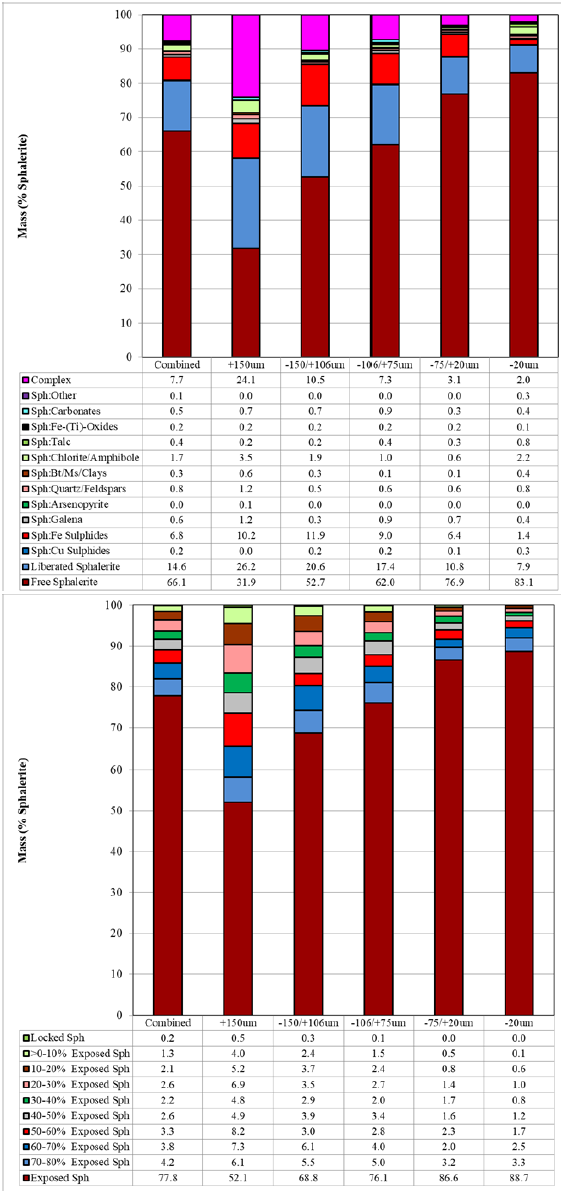
Liberation of the minerals is also crucial because it indicates the grinding energy required to liberate the ore minerals for beneficiation, flotation or gravity. (Figure 2) illustrates an example of sphalerite from a feed sample screened into four size fractions with a P80 of 150μm. For the purposes of this analysis, particle liberation is defined based on 2D particle area percent. Particles are classified in the following groups (in descending order) based on mineral-of-interest area percent: free (≥95% of the total particle area) and liberated (≥80%). The non-liberated grains have been classified according to association characteristics, where binary association groups refer to particle area percent greater than or equal to 95% of the two minerals or mineral groups. The complex groups refer to particles with ternary, quaternary, and greater mineral associations including the mineral of interest. Liberation of sphalerite calculated for the head sample is ca. 81%, while the remainder of the sphalerite occurs as complex particles (8%), middlings with Fe sulphides (7%), and minor associations with chlorite and amphibole (2%) and other minerals (Figure 2a). The liberation of the mineral increases from 58% to 73% to 80% to 88% and 91% from the +150μm to 20μm size fraction. Sphalerite is well exposed; 89% of the sphalerite mass has an exposure surface of greater than 50%, 7% between 20% and 50% exposure, and only 4% below 20% exposure (Figure 2b). Empirically, and assuming ideal flotation conditions and recovery regardless of grain size, the well exposed sphalerite should be recovered in the Zn concentrate, moderately exposed could be recovered but will result in a grade decrease, while poorly exposed particles will likely be rejected. The data clearly indicates that flotation of the sphalerite at this P80 will likely yield low grades and recoveries, or impure rougher concentrates. For example, the association of sphalerite with Fe sulphides remain strong (ca. 9-12%) above 75μm and decreases to 6% in the +20μm to 1% in the -20μm fractions. Therefore, it is certain that some contamination of the concentrate will occur if such middling particles are recovered. Therefore, fine grinding would be required to improve liberation and further recover sphalerite. The additional grinding, either on a feed or a rougher concentrate, will depend on the desired grades and recoveries. Such relations can be further modelled for flotation purposes. However, very fine-grained sphalerite (<10μm) might be lost to the tailings if flotation conditions (e.g., retention times) are mot adjusted. Sphalerite shows negligible variations with regards to the Zn, Mn and Fe variations. Therefore, variations in the final Zn concentrates will be strongly dependent on the liberation and association of the sphalerite.
Figure 2: REE-Y deportment in a feed sample.
Grade and Recovery
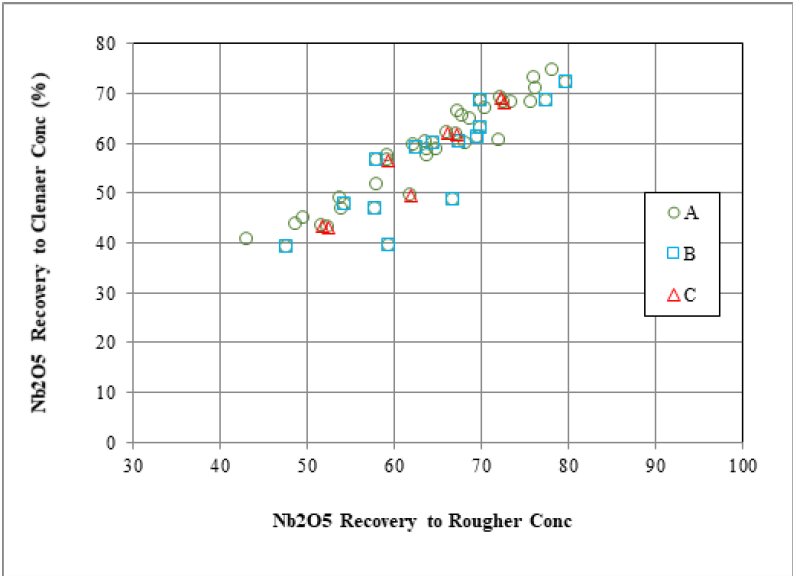
Mineralogically limited grade-recovery analyses provide an indication of the theoretical maximum achievable elemental (or mineral) recovery and concentrate grade and are based on individual particle liberation and grade data. The achievement of ideal recovery and concentrate grade in real metallurgical results is nearly impossible, and in the case of a system containing multiple valuable minerals, ideal grade-recovery results of the first valuable mineral may necessitate complete rejection of a second valuable mineral. Figure 3 illustrates the theoretical grade-recoveries generated from the QEMSCAN analysis compared to the actual metallurgical values from a niobium project. Pyrochlore was the main niobate in the deposit. Liberation and grain size of the pyrochlore greatly affected its recovery. Overall, the metallurgical recoveries fall between 60% and 80% of the total Nb in the samples. In cases, where the mineralogically predicted Nb2O5 grade is higher, than the one achieved (Figure 3, QS-1 and MET-1, respectively). This is attributed to both mineralogical and process related parameters (i.e., flotation reagents). For example, pyrochlore is fine-grained (<20μm) and is lost as entrainment into the tailings. Coarser particles with both poor and good exposure are also lost. The theoretical grade-recovery calculations assume that every single grain, regardless of size, could be recovered. Furthermore, changes must be implemented to recover the fine particles (i.e., higher retention flotation time), flash flotation to recover the coarse and liberated pyrochlore particles, and re-grind the coarser middling particles to increase liberation and surface exposure for flotation. On the other hand, many samples have harmonic relations between the theoretical and metallurgical grades and recoveries. Figure 3 shows that the maximum metallurgical grades are achieved as they plateau those from the QEMSCAN, although the latter shows a range of recovery values (QS-2 and MET-2, respectively). The grain size of pyrochlore is about 10-20μm coarser than that in the previous sample, and middling particles contain pyrochlore with higher surface exposure. Thus, they are better recovered from those in the previous sample. Therefore, the mineralogical information can explain the grade and recovery relations, enhance the understanding of liberation and grain size, and assist the flotation process to improve the final niobium recovery. Figure 4 illustrates a positive correlation (R2=0.84) of niobium recovery in the Ro Conc and Final Conc as a function of pyrochlore exposure (>20% exposed particles) for three different feed samples. An overall positive but empirical trend showing a correlation between Nb rougher recovery and exposure of pyrochlore in the overall process was established [24]. This might indicate that most of the poorly liberated/exposed pyrochlore never make it into the final niobium concentrate. Therefore, such relations can explain the reasons of low or high recovery and further enhance the final niobium recovery.
Figure 3: Grade-recovery curves calculated from the QEMSCAN (QS) and actual metallurgical (MET) values.
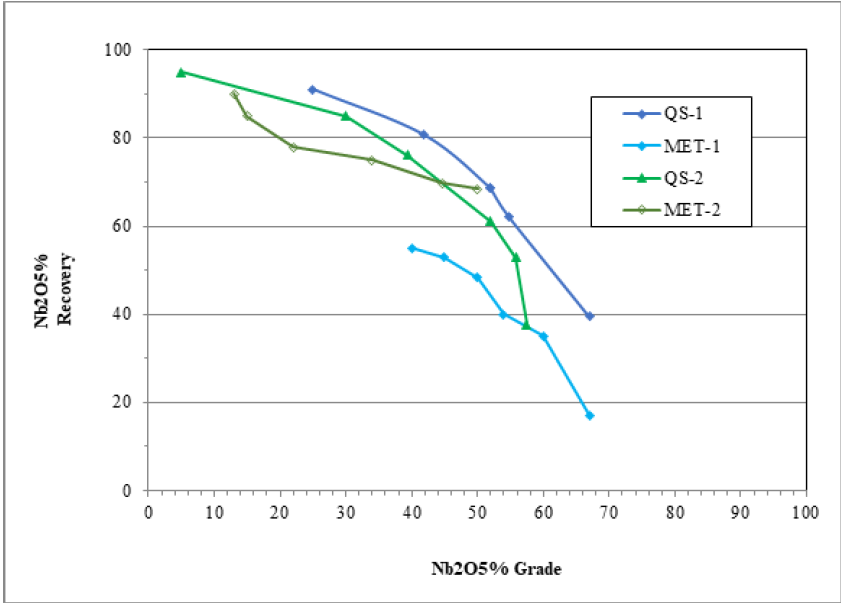
Figure 4: Nb2O5 recovery between cleaner and rougher concentrates using the QEMSCAN data (after Grammatikopoulos et al. [24]).
Gold Deportment
Accurate, detailed information about the gold grade and distribution in feed samples and process products (i.e., tails) is importance in order to identify potential losses and optimize the gold recovery process [25]. Mineralogy of gold deposits (feeds, tails) is highly critical to understand the chemical forms of gold; quantification of both forms is important. A gold deportment study aims to determine the complete gold mineralogical distribution in which all forms and carriers of gold (microscopic and submicroscopic) [17] are identified and quantified. Other forms of gold such as preg robbing and surface bound gold can complicate the gold deportment. Quantification of submicroscopic gold in sulphides is critical because it is refractory and not amenable to cyanidation. The type of microscopic gold minerals is a key factor because some of them leach fast (e.g., native gold), others leach slower (gold-silver tellurides such sylvanite) and some remain refractory (aurostibite).
However, QAM coupled with analytical techniques (e.g., D-SIMS) provides an insight into the potential causes for the gold losses. Each form and carrier of gold must be independently assessed, and the completeness of the gold mineralogical distribution is measured by the final mass and gold balance. Mineralogy of gold is not limited to the gold minerals, but also includes the attributes of submicroscopic gold and its carriers, and gangue minerals and other species that may affect gold processing, such as cyanicides as described earlier.
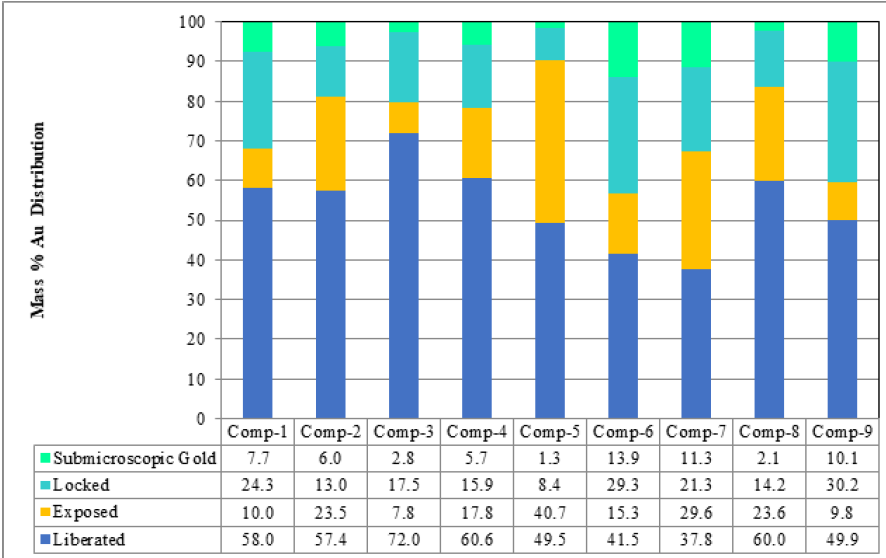
(Figure 5) illustrates the total grade of submicroscopic gold for composite samples which is calculated based on the sulphide mineral mass from the QEMSCAN analysis and average submicroscopic gold concentrations from the D-SIMS. Liberated and exposed microscopic gold is amenable to cyanidation. Microscopic gold inclusions locked in different host minerals are typically fine grained and are considered refractory unless the host minerals are re-ground to liberate or expose the inclusions. The submicroscopic gold, considered refractory, and accounts for 1% to 14% of the total grade of the gold in the composites. Refractory sulfide ores must be processed with an autoclave pressure oxidation and subsequent cyanidation to recover the submicroscopic gold. The mineralogical data show that there will be an expected degree of variability in the gold recovery for these samples. Gold minerals include both native gold and electrum but also a number of Bi and Te based alloys. Therefore, the recovery of the gold will be even further variable. Overall, the gold distribution provides insights of how to process the gold ores.
Figure 5: Microscopic (locked, exposed, liberated) and submicroscopic gold distribution in feed samples.
Conclusion
QAM is increasingly playing a significant role in geology, mining and mineral processing. It essentially sets realistic targets for final grades and recoveries and identifies the roots of the metal losses and is an absolute measure of metallurgical performance. There are numerous applications of data in daily processes, from variability studies, metallurgical test work support and plant optimization. It is expected that the role of process mineralogy will increase given the low-grade ores, need to determine the inherent mineralogical variability of the ores both multi mineral and multi element, and improve the final grades and recoveries. QAM provides mineralogical information for geometallurgy which encompasses quantitative data from geology to mineral processing. Inherent mineralogical parameters, when properly quantified, point to potential variability of an ore and must be taken into consideration. Mineral attributes, as discussed herein, can be effectively integrated in mineral processing and flowsheet development, process optimization but also mine planning.
References
- Baum W (2014) Ore characterization, process mineralogy and lab automation a road map for future mining. Minerals Engineering 60: 69-73.
- Lund C, Lamberg P (2014) Geometallurgy-A tool for better resource efficiency. European Geologist 37: 39-43.
- Jordens A, Marion C, Grammatikopoulos T, Hart B, Waters KE (2016) Beneficiation of the nechalacho rare earth deposit: Flotation response using benzohydroxamic acid. Minerals Engineering 99: 158-169.
- Díaz GF, Ortiz JM, Silva JF, Lobos RA, Egaña AF (2020) Variogram-based descriptors for comparison and classification of rock texture images. Mathematical Geosciences 52: 451-476.
- Lotter NO, Bradshaw DJ, Barnes AR (2016) Classification of the major copper sulphides into semiconductor types, and associated flotation characteristics. Minerals Engineering 96-97: 177-184.
- Whiteman E, Lotter NO, Amos SR (2016) Process mineralogy as a predictive tool for flowsheet design to advance the kamoa project. Minerals Engineering 96-97: 185-193.
- Vos CF (2016) The effect of mineral grain textures at particle surfaces on flotation response. The University of Queensland- Sustainable Minerals Institute, Australia, p. 389.
- Kupka N, Tolosana Delgado R, Schach E, Bachmann K, Heinig T, et al. (2020) R as an environment for data mining of process mineralogy data: A case study of an industrial rougher flotation bank. Minerals Engineering 146: 106111.
- Fosu S, Pring A, Skinner W, Zanin M (2015) Characterisation of coarse composite sphalerite particles with respect to flotation. Minerals Engineering 71: 105-112.
- Vos CF, Stange W, Bradshaw DJ (2014) A new small-scale test to determine flotation performance-Part 1: overall performance. Minerals Engineering 66-68: 62-67.
- Aylmore MG, Merigot K, Rickard WDA, Evans NJ, McDonald BJ, et al. (2018) Assessment of a spodumene ore by advanced analytical and mass spectrometry techniques to determine its amenability to processing for the extraction of lithium. Minerals Engineering 119: 137-148.
- Vinnett L, Marion C, Grammatikopoulos T, Waters KE (2020) Analysis of flotation rate distributions to assess erratic performances from size-by-size kinetic tests. Minerals Engineering 149.
- Thorpe R, Gottlieb P, Mermillod Blondin R, Niiranen A, Ruokanen J, et al. (2017) Metallurgy, process control and mineralogy integration at the Kittila mine, Finland. p. 6.
- Little L, Mclennan Q, Prinsloo A, Muchima K, Kaputula B, et al. (2018) Relationship between ore mineralogy and copper recovery across different processing circuits at Kansanshi mine. The Journal of the Southern African Institute of Mining and Metallurgy 118: 1155-1162.
- Sciortino M, Muinonen J, Korczak J, Jean A (2013) Geometallurgical modelling of the dumont deposit. Second AUSIMM International Geometallurgy Conference, Brisbane, Australia, pp. 93-100.
- Ford FD, Wercholaz CR, Lee A (2011) Predicting process outcomes for sudbury platinum-group minerals using grade-recovery modeling from mineral liberation analyzer (MLA) data. Canadian Mineralogist 49(6): 1627-1642.
- Chryssoulis SL (2016) Mineralogical investigation of gold ores. In book: Gold Ore Processing. pp. 57-93.
- Mackay DAR, Simandl GJ, Ma W, Redfearn M, Gravel J (2016) Indicator mineral-based exploration for carbonatites and related specialty metal deposits-A QEMSCAN® orientation survey, British Columbia, Canada. Journal Geochemical Exploration 165: 159-173.
- Grammatikopoulos T, Mercer W, Gunning C (2013) Mineralogical characterization using the QEMSCAN of the Nechalacho heavy rare earth metal deposit, Northwest Territories, Canada. Canadian Metallurgical Quarterly 52(3): 265-277.
- Zhu G, Cao Y, Wang Y, Wang X, Miller JD, et al. (2020) Surface chemistry features of spodumene with isomorphous substitution. Minerals Engineering 146.
- Ndlovu B, Farrokhpay S, Bradshaw D (2013) The effect of phyllosilicate minerals on mineral processing industry. International Journal of Mineral Processing 125: 149-156.
- Becker M, Harris PJ, Wiese JG, Bradshaw DJ (2009) Mineralogical characterisation of naturally floatable gangue in Merensky Reef ore flotation. International Journal of Mineral Processing 93(3-4): 246-255.
- Wiese JG, Harris P, Bradshaw DJ (2007) The response of sulphide and gangue minerals in selected Merensky ores to increased depressant dosages. Minerals Engineering 20(10): 886-995.
- Grammatikopoulos T, de Souza H, Gunning C (2017) Geometallurgical applications of process mineralogy for the recovery of critical elements. Mineral Resources to Discover-14th SGA Biennial Meeting. 1205-12008.
- Dimov SS, Har BR (2017) Applications of microbeam analytical techniques in gold deportment studies and characterization of losses during the gold recovery process. Surface and Interface Analysis 49(13): 1404-1415.
© 2020 Grammatikopoulos T. This is an open access article distributed under the terms of the Creative Commons Attribution License , which permits unrestricted use, distribution, and build upon your work non-commercially.
 a Creative Commons Attribution 4.0 International License. Based on a work at www.crimsonpublishers.com.
Best viewed in


.jpg)


 Editorial Board Registrations
 Submit your Article
 Refer a Friend
 Advertise With Us
.jpg)


.jpg)


.bmp)
.jpg)
.png)
.jpg)


.jpg)


.png)

.png)


.png)


