
- About Us
- Information
-

The Author ensures that the research has been conducted responsibly and ethically with adherence to all relevant regulations. read more..
- For Authors
- For Reviewer
- Manuscript Guidelines
- Membership
- Publication Ethics
-
- Journals
- Reprints
- e-Books
- Videos
- Policies
- Contact Us
 COVID-19
- Submissions


Full Text
Aspects in Mining & Mineral Science
Persistency in Fracture Tendency of Subsurface Biogenic Siliceous Rocks
Qianru Qi and Iraj Ershaghi*
University of Southern California, USA
*Corresponding author: Iraj Ershaghi, University of Southern California, USA
Submission: October 11, 2019;Published: December 09, 2019

ISSN 2578-0255Volume4 Issue2
Abstract
Characterizing fracture content of subsurface siliceous rocks susceptible to fracturing is a complex process. We have experimented with the use of the Hurst coefficient and have noted the autocorrelated nature of particular subterranean intervals that contain biogenic silica in various stages of diagenesis. We examined the nature of lithology signals from well logs and have ascertained the existence of long-range dependence and persistency. We based our analysis on gamma-ray and neutron logs vs. depth and examined the autocorrelation of the sequential appearance of highly cherty intervals. The Hurst coefficient is used as a measure of the autocorrelation of the log readings vs. depth as verified by Power Spectrum Density plots. Our analysis detects a persistency in the lithology data in the intervals significantly affected by the silica diagenesis.
Introduction
In subsurface chert formations containing biogenic silica that have undergone silica diagenesis, both the gamma ray log and the neutron logs are sensitive in detecting intervals with high concentration of shale bearing intervals sandwiched between the laminated chert intervals. Our objective was detecting any systematic organization in an otherwise chaotic system. Subsurface well log data for clastic sediments resemble fΒM (fractional Brownian motion) type time series [1-4]. A prior analysis using the power spectrum for estimation of β can help in the R/S analysis of the Hurst coefficient. If β≥1, the data is considered as fΒM-like.
Silica Diagenesis in the Monterey Formation
In subsurface fractured biogenic siliceous rocks, the highest permeability is in organic rich siliceous mud rocks with occasional inclusion of phosphatic or calcareous sequences. A highly complex sequence of diagenetic alteration during burial diagenetic can affect the transformation of heterogeneous mixture of silica phases, hydrated clay, organic matter and authigenic carbonates. In biogenic silica environments, certain transformations occur at temperatures below 100 °C. Fractures formed during the diagenesis or tectonic related causes, affect hydrocarbon migration and production. Compositional variations especially the detrital content can be detected via gamma ray and neutron logs from wells penetrating these intervals. We cross checked our method to detect the cherty intervals by examining cutting analysis in mud logs.
Methodology
As shown by Hewett [1]; Goggin et al. [2]; Perez & Chopra [3] and Beier & Hardy [4], various models have been used for reservoir description. Here, we use the Hurst coefficient as an indication of autocorrelation or randomness of geology. We apply the method on the recorded downhole well log data, which maps the geological variation and reservoir heterogeneity. Hurst [5] first introduced this empirical relationship in 1951 while studying the long-term discharge variation of River Nile. The methodology was later discussed and used by Mandelbrot & Wallis [6]. The essence of the method is examining the variation of ratio between R and S. R represents the difference between the maximum and minimum of accumulated departure from the mean Xm.
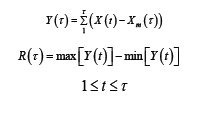
where:
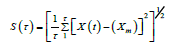
is the standard deviation serving as a scaling factor?
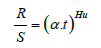
and α is a constant. Hurst coefficient can be obtained from a log-log plot of R/S vs t. The rescaled range technique introduced by Hurst has been applied to several types of time series data including signal processing applications, stock markets forecasting, network traffic, to bioengineering. Some limited publications have appeared in the application of the Hurst coefficient in subsurface geology and geophysical mapping. We developed cumulative R/S plots and conducted various sets of analysis by including first chert intervals as products of diagenetic processes and then included intervals of detrital content above chert interval. We noted that the productivity of the individual wells in an actual field under study correlate with the prevalence of fractured cherts.
The persistency and autocorrelationBelow we show the analysis of well log responses tested using a power spectral density analysis method. Figure 1 shows a comparison of histograms and power spectral densities of the raw and normalized gamma ray for well A010. With and without normalization, the autocorrelation is obvious. All indicate the nature of signals analyzed are fΒM. We developed an algorithm to estimate the Hurst coefficients for the cases under our study. These coefficients all showed values above 0.7, indicating that indeed there seems to be persistence in the rock compositional variation in the diagenetically affected sections as depicted by well log data. Figures 2-6 show the power spectral density and corresponding R/S analysis of neutron and gamma ray data for three wells, A010, A013, A015 and A03. According to Du & Ershaghi [7], for combinations of two fΒM series one could see slope changes in the R/S analysis.
Figure 1: Comparison of histograms and power spectral densities of the gamma ray data for well A010 using raw and normalized data

Figure 2: Power spectral density and corresponding R/S analysis for gamma ray and neutron recordings of a cherty section in well A010

Figure 3: Power spectral density and corresponding R/S analysis for gamma ray and neutron recordings of a cherty section in well A013

Figure 4: Power spectral density and corresponding R/S analysis for gamma ray and neutron recordings of a cherty section in well A015

Figure 5: Power spectral density of the cherty interval with and without the shaly section for well A003.

Figure 6: R/S plots of the cherty interval with and without the shaly section for well A003.

Conclusion
Our studies show that well-logging data in the diagenetically altered cherty sections can generally be analogous to fΒM, and we can use the data to estimate the Hurst coefficient by applying the R/S analysis. For the first time we are offering the results of a study that has demonstrated that applying the R/S analysis and spectral density in the cherty intervals highly subjected to diagenesis and perforated on the producing wells can indeed indicate a persistency and autocorrelation.
Nomenclature
Hu = Hurst coefficient, or Hurst Exponent, dimensionless
R=range of the data, in same unit of analyzed data
S = standard deviation of the data, in same unit of analyzed data
t = tth data point in the data set, dimensionless
τ = size of sampled data, dimensionless
X = value of single data point, in same unit of analyzed data
Xm = mean of the data, in same unit of analyzed data
Note: when marked as ‘in same unit of analyzed data’, it refers to API unit (for GR data), or 1 (for Neutron Porosity data or any normalized data).
References
- Hewett TA (1986) Fractal distributions of reservoir heterogeneity and their influence on fluid transport. Society of Petroleum Engineers.
- Goggin DJ, Chandler MA, Kocurek G, Lake LW (1992) Permeability transects of eolian sands and their use in generating random permeability fields. Society of Petroleum Engineers 7(1).
- Perez G, Chopra AK (1997) Evaluation of fractal models to describe reservoir heterogeneity and performance. Society of Petroleum Engineers 12(1).
- Beier RA, Hardy HH (1994) Comparison of 2D and 3D fractal distributions in reservoir simulations. Society of Petroleum Engineers 9(3).
- Hurst HE (1951) Long-term storage capacity of reservoirs. Transactions of the American Society of Civil Engineers 116(1): 770-799.
- Mandelbrot BB, Wallis JR (1969) Some long-run properties of geophysical records. Water Resources Research 5(2): 321-340.
- Du C, Ershaghi I (1996) A critical evaluation of short and long range correlation methods for heterogeneous rocks. Society of Petroleum Engineers 1(2).
© 2019 Iraj Ershaghi. This is an open access article distributed under the terms of the Creative Commons Attribution License , which permits unrestricted use, distribution, and build upon your work non-commercially.
Editor In Chief


.jpg)


Signup for Newsletter

Quick Links
 Editorial Board Registrations
 Submit your Article
 Refer a Friend
 Advertise With Us
Our Recent Edition

.jpg)


Top Editors


.jpg)


.bmp)
.jpg)
.png)
.jpg)


.jpg)


.png)

.png)


.png)


Financial Support

Sponsors

Latest e-Books

Latest Video

 a Creative Commons Attribution 4.0 International License. Based on a work at www.crimsonpublishers.com.
Best viewed in
a Creative Commons Attribution 4.0 International License. Based on a work at www.crimsonpublishers.com.
Best viewed in