- Submissions

Full Text
Aspects in Mining & Mineral Science
Demo-Testing Facility of Gamma-Activation Analysis for Gold Ores
Demsky MI1, Sokolov AD2, Moshkov VA3 and Gostilo VV2*
1Corad Ltd, Russia
2Baltic Scientific Instruments, Latvia
3Atomredmetzoloto, Russia
*Corresponding author: Vladimir Gostilo, Baltic Scientific Instruments, Riga, Latvia
Submission: October 11, 2019;Published: November 25, 2019

ISSN 2578-0255Volume4 Issue2
Abstract
We present the metrological characteristics and technical features of a gamma-activation analysis (GAA) method at a demo-testing facility, where methods for determining the concentrations of noble metals and other elements in rocks, ores, and their technological processing products are developed. Applying this installation, we can analyses samples from various mineral resources under various simulation conditions and optimize the measurement conditions of their samples. Such laboratory tests will provide clients with the real limits of detection of the elements being determined and the accuracy of their determination well in advance of their investment in their own GAA installations.
Keywords: Gold ore analysis; Gold ore processing; Gamma-activation analysis
Abbreviations: GAA: Gamma-Activation Analysis; LINAC: Linear Electron Accelerator; HPGe: High-Purity Geranium
Introduction
Assays have been applied for hundreds of years and remain the standard methods for analyzing samples containing noble metals [1,2]. However, gamma-activation analysis (GAA) is expected to penetrate the market of gold-bearing ore analysis in the coming years [3-5]. The GAA method involves the irradiation of the studied samples with high-energy gamma rays (bremsstrahlung radiation) from a linear electron accelerator (LINAC) and measurement of the induced activity of the excited gold nuclei (isomers) using a gamma-ray spectrometer. The advantages of gold GAA, such as high sensitivity and accuracy of the analysis, ability to assay representative analytical samples (500g), and high expressivity and productivity, have been repeatedly discussed and are well known [3-6]. Unfortunately, the development of the GAA method for gold analysis has been limited by the higher cost of primary investment than in standard assay analysis [7]. The total cost of a GAA laboratory, including construction work, can reach $4-5 million $US, approximately 2 million $US more than the initial investment in an assay laboratory. According to economic calculations, this initial investment gap between GAA and standard assay laboratories will close after one year of operating the GAA facility; nevertheless, investors must understand the outcome of investing in a GAA facility [7].
In this work, we present the metrological characteristics and technical features of the GAA demo-testing facility, which we created and put into operation at the production site of Corad Ltd. in St. Petersburg [8], to develop methods for determining the concentrations of noble metals and other elements in rocks, ores and their technological processing products. The commissioned installation allows to simulate various conditions for analyzing various objects of subsoil use, and optimize the measurement conditions for the samples of each mining enterprise. Having results of such laboratory tests, clients will understand the real limits of detection of the elements being determined, and the accuracy of their determination, long before investing in their own GAA installations. Creating a low-throughput demo-testing facility with the same volume as a high-performance industrial facility is economically infeasible. For this reason, while developing industrial systems and possessing the equipment for producing all the main components of such systems [8,9], we have developed a demo-testing facility following a simplified scheme that minimizes our own investment in the facility. The facility accurately determines the gold concentration in samples and clearly demonstrates the GAA technology.
Demo-Testing Facility
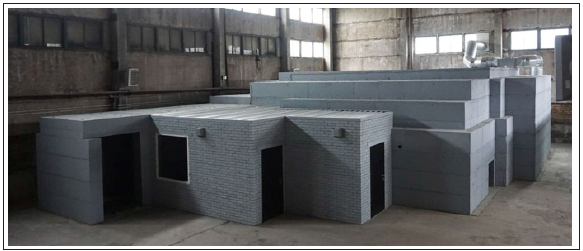
The demo-testing facility is located inside a concrete biological shielding, designed to test more powerful accelerators with energies up to 10MeV and beam powers up to 10kW. Concrete shielding itself is located within an industrial hangar (Figure 1).
Figure 1: Concrete shielding with a GAA demo-testing facility inside an industrial hangar.
LINAC
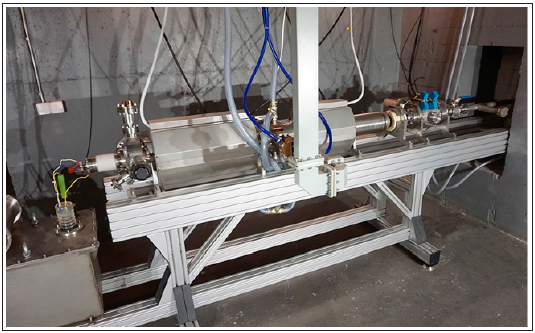
Industrial laboratories of gold GAA require LINACs with energies of 7-9MeV and operating powers of up to 10kW [7,10]. Such LINACs were used in our previous industrial works [7, 10-12]. The demo-testing facility is based on a 7-9MeV LINAC and a power of 2kW (Figure 2). In this accelerator, the microwave source was an MИ-456A magnetron with an average power of 5kW operated at 2856MHz. The magnetron is powered by a modulator based on insulated gate bipolar transistors and is constructed as a Marx generator circuit. Owing to the high efficiency of this modulator and the short fronts of the voltage pulses, the power consumption of this accelerator was reduced to ~12kW at a beam power of 2kW.
Figure 2: LINAC of the GAA demo-testing facility.
Measuring system
To measure the spectra of gold-bearing ores, one requires precision spectrometers with high energy resolution and maximum gamma-ray detection efficiency. Under industrial conditions, we increased the detection efficiency of the radiation from excited gold nuclei with two-channel spectrometers based on three-crystal assemblies of high-purity geranium (HPGe) detectors, which achieved a gold detection limit below 0.05g/t [11,12]. The demotesting facility uses a single-channel spectrometer based on a coaxial HPGe detector with a gamma radiation detection efficiency of 38%. The spectra are processed by a digital multichannel analyzer equipped with analytical software for calculating the peak intensities and gold contents in the measured samples.
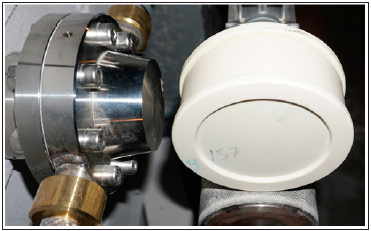
Measurement collectionIn the sample preparation room, the crushed ore is manually packed into a research cylindrical container of diameter 100mm and height 35mm (Figure 3). It should be noted that in contrast to assay analyses, which generally require micron-sized (74μm) particles in the sample material, the GAA analyses coarse samples with particle sizes of up to 2-4mm [3-6]. The operator manually fixes the container on the holder opposite the accelerator target (Figure 4), exits the irradiation zone, and turns on the accelerator beam for 8-12 seconds. Once arranged in the irradiation position, the round sample container rotates around its axis at several revolutions per second, ensuring uniform irradiation of the container contents. Immediately after exposure to gamma rays, the sample is carried to the spectrometer that measures the radiation (the measurement zone) by a movable rod. If necessary, the sample can be repeatedly moved between the irradiation and measurement zones during subsequent irradiation-measurement cycles. The irradiation and measurement zones are separated by shielding of the structural elements. The time of moving the sample from the irradiation zone to the measurement zone can be adjusted from 1.5 to 5 seconds.
Figure 3: Open container packed with the sample to be analyzed.

Figure 4: Container with sample opposite the accelerator target.
The measured spectra are processed and stored in computer, and the measurement results are presented on the monitor screen. After carrying out the required number of exposures-measurement cycles, the operator manually replaces the sample. The time of replacing the sample and returning the accelerator to the mode of operation is approximately 5 minutes.
Calibration
Figure 5: Dependence of gold content on the gold peak area of the reference samples.
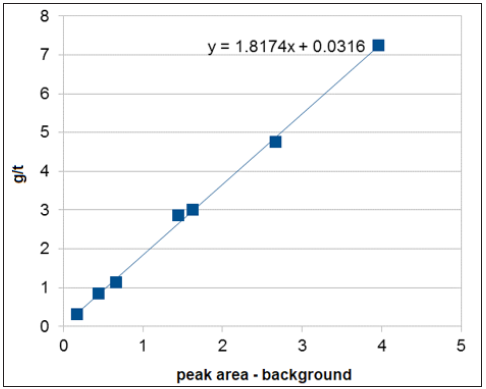
Calibration of the demo-testing facility and preliminary assessment of the metrological characteristics of the GAA were carried out on sequentially measured reference samples provided by STC Min Standart [13]. The measurement results are displayed in Table 1. The measurement error, calculated as the relative standard deviation, did not exceed 10.1% over the entire concentration range. Figure 5 regresses the gold content against the gold peak area of the reference samples. The detection limit of the gold content under 10- fold irradiation of the sample, calculated from the spectrum of the MST Gq 158e sample (1.13g), was 0.063g/t. After multiple (8-10) irradiation cycles, the gold content was determined in the range 0.1 to 10g/t. As each sample consumed approximately 10 minutes of analysis time, the productivity of the facility after 8-10 irradiations is approximately 40 analyses in eight hours. A single ore irradiation at this facility measures the gold concentration in the range 0.75 to 100g/t, and the gold detection limit was 0.19-0.25g/t, depending on the properties of the sample matrix. The analysis time, including the time of changing the samples and switching on the accelerator, was approximately 5-6 minutes. Thus, the single-irradiation productivity of the facility is 80 analyses in eight hours.
Table 1: Measurement results of the reference samples.

The First Research Results
Real samples from two gold mining enterprises have been measured at the calibrated facility. These enterprises provided 23 samples whose gold contents had been predetermined by assay analysis. All measurements were carried out under the same conditions: sample weight 300-400g, accelerator energy 8MeV, accelerator power 2kW, 10 irradiation-measurement cycles, irradiation time 9s, sample cooling time 2s, and spectrum measurement time 15s. The gold concentrations of seven samples were within 3.5% of the assayed concentrations, but nine, five and two samples were discrepant by 15%, 30% and 60%, respectively. It is important to note that the presented samples belong to the gold-quartz type and incorporate free and large (> 0.6mm) gold particles. Figures 6 & 7 show the gamma spectra of samples with gold concentrations of 3.3 and 0.69g/t, respectively, extracted from two different mines. Almost no natural radionuclides of uranium and thorium (the main interfering elements) presented in the spectra of the gold samples from these mines.
Figure 6: Gamma spectrum of an ore sample with a gold content of 3.3g/t (10 cycles, irradiation time 9s, sample cooling time 2s, spectrum measurement 15s).
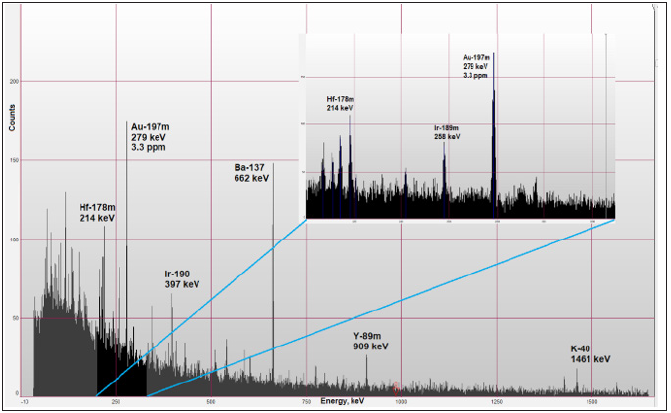
Figure 7: Gamma spectrum of an ore sample with a gold content of 0.69g/t (10 cycles, irradiation time 9s, sample cooling time 2s, spectrum measurement time 15s).
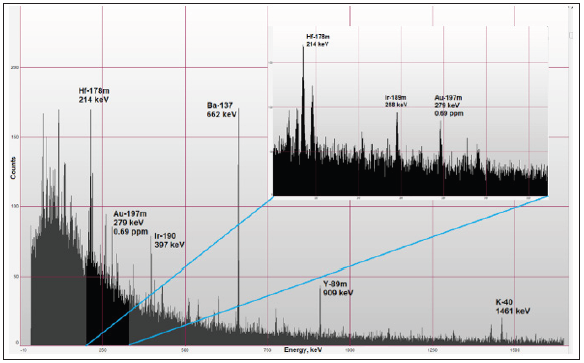
The clear peak of the Au-197m isomer at 279keV is the main peak in gold analysis by the GAA method. Additionally, considering the gold line at 130keV would increase the accuracy of calculating the gold concentration by another 2-3% [12], but this peak is obscured by the high background in the spectrum. The spectra also show peaks of Hf, Nb, Ir, Ba, Y and other elements. The concentrations of these elements could be calculated by appropriate measurement procedures.
Conclusion
Our projects aim is to develop and implement basic principles for the creation of industrial gamma-activation laboratories, in which clients from mining enterprises can analyses gold and related elements in samples with various compositions. The principles and technologies under development should provide a GAA method with high sensitivity, low relative error, and high productivity. Our demo-testing GAA facility, which has begun operation, serves the same purposes. By carrying out laboratory measurements of real samples at the facility, clients will understand the specific limits of gold detection, and the gold determine accuracy of their samples, which can be expected in their own GAA installations.
References
- Haffty J, Riley LB, Goss WD (1977) A manual on fire assaying and determination of the noble metals in geological materials. Geological Survey Bulletin 1445, USA Government Printing Office, Washington, US.
- Blyth KM, Phillips DN, Bronswijk W (2004) Analysis of gold ores by fire assay. J Chem Educ 81(12): р. 1780.
- Hoffman EL, Clark JR, Yeager JR (1998) Gold analysis-fire assaying and alternative methods. Explor Mining Geol 7(1-2): 155-160.
- Morse JG (1977) Nuclear methods in mineral exploration and production. Elsevier.
- Bourmistenko YN (1986) Photonuclear analysis of the composition of the substance. - M.: Energoatomizdat,.-200 с.
- Tickner J, Ganly B, Lovric B, Dwyer JO (2017) Improving the sensitivity and accuracy of gamma activation analysis for the rapid determination of gold in mineral ores. Applied Radiation and Isotopes: Including Data, Instrumentation and Methods for Use in Agriculture, Industry and Medicine 122: 28-36.
- Sokolov A, Gostilo V, Demsky M, Hasikova E (2018) Optimization of an industrial gamma-activation assay system for the analysis of gold and rare earth metal ores. ALTA 2018 Gold-PM Proceedings, Perth, Australia, pp. 61-71.
- http://www.corad.pro/linacs.aspx
- http://bsi.lv/en/products/hpge-detectors-spectrometers/
- Sokolov A, Gostilo V, Demsky M, Hasikova E (2019) Performance optimization of an industrial gamma-activation assay system for analysing gold and rare earth metal ores. The Journal of the Southern African Institute of Mining and Metallurgy (SAIMM) 119(5): 509-513.
- Sokolov AD, Burmistenko YN, Gostilo VV, Titov VL (2018) Industrial gamma-activation assay system for gold ore analysis. Minerals Engineering 116: 179-181.
- Sokolov AD, Demsky MI, Gostilo VV, Hasikova EI, Titov VL (2017) Gold ore analysis using industrial gamma-activation assay system. ALTA Au 2017, Perth, Australia, pp.146-153.
- STC MinStandart.
© 2019 Gostilo VV. This is an open access article distributed under the terms of the Creative Commons Attribution License , which permits unrestricted use, distribution, and build upon your work non-commercially.
 a Creative Commons Attribution 4.0 International License. Based on a work at www.crimsonpublishers.com.
Best viewed in


.jpg)


 Editorial Board Registrations
 Submit your Article
 Refer a Friend
 Advertise With Us
.jpg)


.jpg)


.bmp)
.jpg)
.png)
.jpg)


.jpg)


.png)

.png)


.png)


