- Submissions

Full Text
Aspects in Mining & Mineral Science
Simulation of Electrical Current Paths in a Mn- Ferroalloy Furnace
Hartvedt Olsen HA* and Merete Tangstad
Jafar Safarian, NTNU, Material Science and Engineering, Norway
*Corresponding author: Håkon Aleksander Hartvedt Olsen, Jafar Safarian, NTNU, Material Science and Engineering, Norway
Submission: September 25, 2019;Published: October 22, 2019

ISSN 2578-0255Volume4 Issue1
Synopsis
The stability of the operation in a submerged arc furnace is dependent on the electrical current paths in the process. The goal of this paper has been to better understand where the electric current runs through the ferromanganese furnace as a function of coke bed shape and size. Simulations of the current through a tri-electrode setup at a single point in time were done. The amount of electricity passing through various areas of the model was calculated using the modelling software “COMSOL multiphysics 5.0”. The simulations show a strong correlation between coke bed size and shape, and the electrical current concentration in the various paths of the FeMn-furnace. An almost linear proportionality between the total coke bed volume and the percentage of current flowing straight down to the metal, instead of through the sides, was found. The percentage went from above 95% for the smallest coke beds, to around 50% for the largest ones. The electrode tip position was shown to be dependent on the coke bed size and shape, generally sticking deeper into the coke in more narrow beds. The percentage of current going through the charge varies from below 1% to over 8%, while the heating effect generated through joule heating in the charge varies from about 1% to 9% of the total effect, both decreasing with larger coke beds. These numbers indicate that there is more joule heating in the charge than previously believed, especially in narrow coke beds.
Keywords:Coke beds; Materials; Electrode; Mn-ferroalloy
Introduction
In Mn-ferroalloy production, as in other submerged arc processes, the electrical energy is provided through ohmic heating of a coke bed. Raw materials, such as Mn-ores, fluxes and metallurgical coke are added from the top of the furnace [1]. The raw materials (the charge) will descend in the furnace during production and are heated as they descend. As the charge reaches the melting temperature, the ore and fluxes will melt to a slag. The carbon particles, however, will remain solid. The mix of liquid slag and coke is called the coke bed. In t coke bed the electrical resistivity is relatively low there, while the resistivity in the solid ore-coke mixture will be 10-100 times higher according to Miyauchi et al. [2,3]. Consequently, the main part of the electrical current will run through the coke bed.
Slag and metal will continuously flow through the coke bed, and the lower part of the coke bed will be immersed in the accumulated slag all the way to the metal layer due to the weight of the charge [4-6]. As the metal density, 6-7kg/l, is high compared to the coke bed density 1.5-2 kg/l [7] the coke particles will not be immersed into the metal bath. While the metal density is mainly dependent on the composition, the bulk coke bed density is dependent on both the type of carbon material used and the packing of the bed. The furnace may be described by three distinct zones; as a low temperature zone where all the particles are solid, a coke bed zone with solid coke particles and some slag and metal, and in the bottom of the furnace a metal layer. This is illustrated in Figure 1. As the current runs from electrode to electrode, it has three potential paths. As illustrated in Figure 2, it can run through the solid charge materials, or it can run into the coke bed and then through the charge materials into the next coke bed. If the coke beds are too large, they may overlap, and the current will only run through the coke beds. The current may also run through the coke bed into the metal bath and up through the next coke bed. In the two first cases the energy will be produced mainly within the periphery of the three electrodes, while in the last case the energy will be more distributed throughout the whole coke bed, both on the inside and outside of the electrodes. In this case, the energy production will take place lower down in the furnace. It is believed that under stable operation, the main part of the electrical currents will run through the metal bath and the electrode tip position should be low [8]. Although it is believed that the main part of the electrical current is produced by Ohmic heating, there is a discussion whether a minor part is also produced by arcing in ferroalloy production processes [9].
Figure 1:Illustration of the materials surrounding one of the electrodes.

Figure 2:Potential current paths..
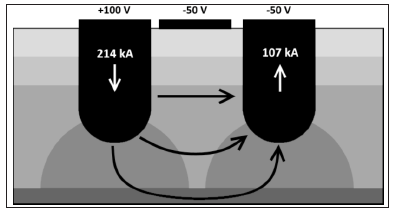
The electrical current paths will be determined by the resistivity of the various zones in the furnace, as well as their geometry. Through excavations, one has seen that the geometry may vary from flat coke beds [6] to bell shaped [4] and even cylindrical coke beds [10]. The resistivity will vary with type of raw materials, especially type and particle size of carbon materials, as well as temperature. Eidem [5] found that the metallurgical cokes usually have a lower electrical resistivity than petroleum coke, anthracite and charcoals; however, within the group of metallurgical cokes, the resistivity could also vary with a factor of 2. The sizing is also important, and a smaller sizing will increase the bulk resistivity. A third factor will be the resistivity of the slag filling up the voids between the carbon particles. The most important factor affecting the stability of the furnace operation is the electrical current paths. Electrical current paths high up in the furnace will make the operation unstable, and typically deep current paths is the desired state of operation. This paper will investigate where the electrical current paths run depending on the coke bed size and shape. The coke bed size and shape is depending on the history of the raw materials mass balance and hence this paper will correlate the carbon mass balance with the furnace stability through the electrical current paths Modelling was used to simulate the furnace currents. The purpose of this simulation was to investigate how the geometry of the coke bed will affect the electrical current distribution.
The simulated furnace was assumed to operate on a fixed resistance set point, to illustrate how most industrial furnaces is operated.
Modelling Setup
For the simulations, the modelling software “Comsol multiphysics 5.0” was used. The furnace was modelled at a point in the three-phase AC system where one of the electrodes was at a maximum of 100V potential, while the two others were at -50V. This can be considered a good approximation of the complete AC system except for the current details inside the electrodes and the metal [11]. These are of little importance, as this model focuses on conductivity through the charge and coke bed, hence the system was considered to be stationary. The currents and effects were calculated by the software using equations 1 to 3:
∇J =Qj (1)
J =σ E + Je (2)
E = −∇V (3)
Where σ is the material conductivity, V the potential, Qj the current source, E is the local electric field, J the current density, and Je an externally generated current density. Ohm’s law was used to calculate the total resistances, following equation 4:
R = V/I (4)
Where R is the resistance, V is the potential, and I is the current. By adjusting the electrodes height in each model, the total resistance was kept at 0.7mOhm, similar to how it is done in an industrial ferromanganese furnace [1]. This also kept the output effect constant at just above 32MW. All borders of the model was considered insulating, except the circular top surfaces of the electrodes which were considered to be held at a constant potential of +100V, -50V and -50V respectively. Current conservation is assumed in the entire furnace. The furnace was modelled with a charge diameter of 10.3m, a wall thickness of 1m, a total height of 5m, a metal bath height of 0.5m, electrode diameter of 1.9m, electrodes placed at the half-point between the wall and the center, and electrodes shaped as a cylinder with a half-sphere at the tip.
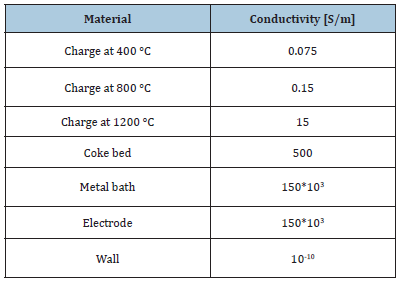
Dimensions and conductivities were taken from [12] but using coke beds of varying size and shape in place of a purely flat layer. In most of the simulations, the coke beds were shaped as three half-ellipsoids, one centered underneath each electrode, but three simulations using a single flat bed of varying height were also added to the project. In several simulations, the coke beds overlapped, which was taken into consideration when calculating the total volume of coke. Additionally, the three topmost layers of charge, at 400 °C, 800 °C and 1200 °C respectively, were modelled by taking the cylindrical volume from the top of the coke bed to the top of the furnace in three equally high cylinders. The charge surrounding the coke beds were also considered to keep a temperature of 1200 °C like the layer above it, as most of the heat produced by the current is considered to be spent in the reaction inside and on the edge of the coke beds [1]. Around the furnace, a layer of non-conducting material was added to simulate the walls. Table 1 shows the numerical values of each material as used in the model. It was noticed however, that using a conductivity of 150S/m for metallurgical coke leads to unrealistic electrode tip positions, the electrode standing much closer to the metal bath than what found in excavations. The value is almost a whole order of magnitude lower than what can be found in [5] and closer to that of SiMn coke beds. Because of this, simulations were done using a coke bed conductivity of 500S/m. Using the higher conductivity also gives us models with electrode heights that are closer to the values we see in furnaces and excavations. The simulations use the middle integrals. For each simulation, a different sized or shaped coke bed was used. In this work, the coke bed was generated as a half-ellipsoid with the b value equal to the width and length measured from the center, a value equal to the coke bed height, and the center at the top of the metal layer straight below the center of the respective electrode. In the simulations with a flat coke bed width (Figure 3), the coke bed was modelled as a cylinder, filling the entire width of the furnace up to the corresponding height. The electrode tip height was adjusted to achieve a total resistance of 0.7mOhm, and the coke bed volume was calculated by taking into account both the electrode and eventual coke bed overlap so that neither was added to the volume.
Figure 3:The meaning of “a” and “b” in the coke bed modelling. “b” is the distance from the center to the two edges along the surface of the half-ellipsoid. The “a” value is the distance from the center to the top of the half-ellipsoid. This value represents the height of the coke bed, although because of the electrode taking the place in the center, the highest point of the coke bed will actually be slightly lower and around the edges of the electrode
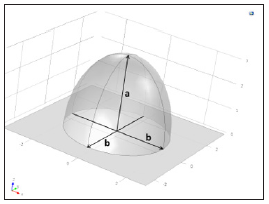
Table 1:Material mixtures and their respective conductivities and relative permittivity. The relative permittivity was assumed to be almost equal to one, this is within reasonable range of possible values and as it does not alter the results even if it is changed by several orders of magnitude. The conductivity of the charge mixture at different temperatures, the metal bath, and electrode, are all from Dhainaut [12]. The coke bed conductivity is from Eidem [5].
One of the things that can be commented on from the modelling is that even if a resistance set point of 0.7mOhm is used in the furnace, the size and geometry of the coke bed can vary considerably. In this example, the coke bed sizes vary from 5m3 to 250m3 for the three coke beds. This also means that there is no correlation between the total resistance of a furnace and the coke bed size. Another important factor, assuming a bulk density of 2kg/l and three optimal coke bed totaling about 10-15 tons of coke, one can have several examples where one have over coked the furnace with more than 100 tons. This also means that cutting 10 tons of coke if you have a too large coke bed will not help, but that real measures must be done. The coke bed shape may go from flat to cylindrical [4,6,10] as previously mentioned. The size and especially the shape of the coke bed a product of the carbon mass balance. Most of the production is close to the electrode. If more carbon is added than consumed, the coke bed will grow close to the electrode. However the width will not change a lot and the coke bed will become pointier. If, on the other hand, less carbon is added than consumed, the main part of the carbon cut will be close to the electrode. Again, the width of the coke bed will not change dramatically. This coke bed will be wide and flat. It is hence believed that the over and under coking history of the furnace will determine both the size and the shape of the coke bed. To find the numerical values shown in the results section, several different integrals were calculated over different volumes and surfaces of the model for each simulation. For each simulation, both surface integrals of the currents and volume integrals of the joule-heating effect were calculated. The current integrals were done over the flat surfaces along the middle plane as shown in Figure 4. The integrals for the joule heating were done over the volumes with the corresponding conductivity. For the current integrals, each component (x,y,z) of the current is multiplied with the normal vector of the plane and added together in each instance, while for the joule-heating integrals the effect is calculated from the resistance and the current in each instance.
Result and Discussion
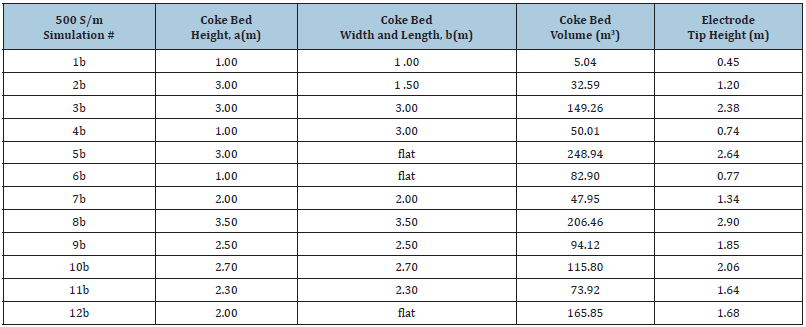
The only parameters that change between the simulations are the coke bed size and shape [13], followed by the adjustment of electrode height to achieve the correct total resistance. For each simulation, current integrations were calculated along the surfaces shown in Figure 4. Joule-heating integrals were also calculated for the volumes with different conductivities. In addition to the current and effect values, percentages of the total value were calculated using the measured integrals. These values are listed in (Table 2 & 3), along with the simulation number corresponding to the ones in Table 4. The data presented in these tables represent the main raw results. It can be noted from the graph in Figure 5 that there is an almost linear dependency between current percentage passing through the entire coke bed and down through the metal and the size of the coke bed. The bigger the coke bed, the more current passes from coke bed to coke bed instead of flowing down to the metal. It should further be noted that all the small “tops” on the graph (around 50, 83, 166 and 250m3) stems from the simulations in which the coke bed was either flat, or nearly so. This hints towards the effect of the coke bed shape; that a flatter bed allows for more of the current to flow down through the coke and to the metal instead of through the side of the coke beds and straight to the exit electrodes compared to a taller coke bed. The graph illustrates that the amount of coke in a coke bed is one of the major issues that will determine the electrical current paths in the furnace.
Figure 4:The furnace model with 2m high and 2m wide coke beds. Highlighting the surfaces for the current integrals: 400 °C -red, 800 °C -blue, 1200 °C -green, Coke -yellow, Metal -orange. The three axes are numbered in meters.
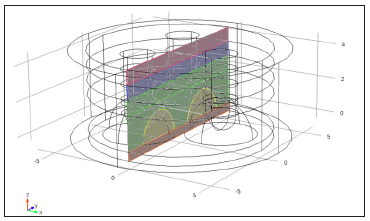
Figure 5:Graph of the current percentages over the coke bed volume for the metal, coke and lowest charge layer (1200 °C). Simulations 1b-12b: coke bed conductivity of 500S/m.
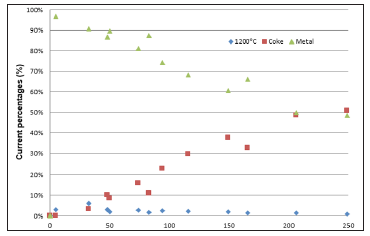
Table 2:Percent of accumulated current over the center surfaces of each mixture with a coke bed conductivity of 500S/m, the total current being 214kA for all simulations. The percentages are calculated by comparing the respective value with the sum of the five integrals that cover a complete surface that all the current must flow through to reach the exit electrodes. The five columns correspond to the areas shown in Figure 4.
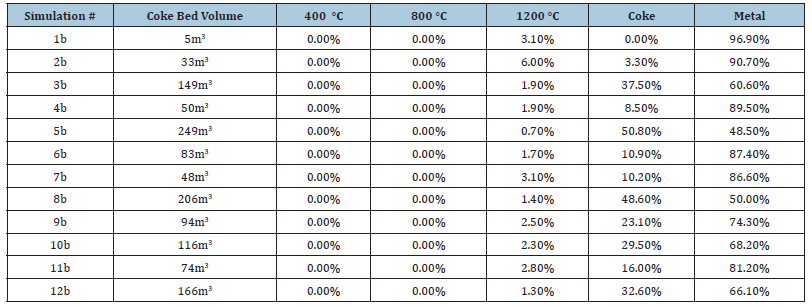
Table 3:Percent of joule heating over the different volumes with a coke bed conductivity of 500S/m. The percentages are calculated by comparing the respective value with the effect calculated from the total current and voltage, which was also within 0.1% of the effect when integrating over the entire model in each of the simulations. The five columns correspond to the volumes containing materials of different conductivity as shown in Table 1.

Table 4:The values used for the coke beds in the different simulations where the coke bed had a conductivity of 500S/m. The coke bed height and width correspond to a half-ellipsoid’s width, length, and height respectively. The volume of the coke bed was calculated for each simulation, with the electrode and potential overlap taken into account. The electrode tip height is the distance from the metal layer to the tip of the electrode.
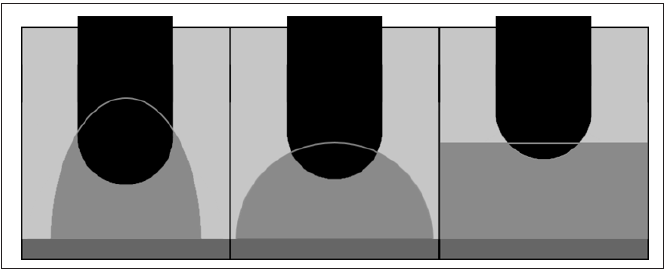
Another thing that these graphs point towards is that the bigger the coke bed, the less current goes through the charge and the less effect is generated there. Especially the tall bed (2b) has a notably high percentage of current going through the charge at 1200 °C, and a correspondingly high resistive effect generated in the charge. The electrode position will naturally change with the coke bed size, as the resistance set point is constant. The electrode position in the coke bed will, however, also change with the shape of the coke bed. The shape decides how submerged the electrode is into the coke bed, which is an important factor. (Figure 6 & 7) show how the electrode tip is submerged further into the coke bed when the coke bed is pointier. This means that when the coke bed is growing (over coking) the electrode tip will be well into the coke bed giving a good transfer of energy to the coke bed. On the other hand, when the coke bed is being reduced (cutting coke or under coking), the electrode tip position will be higher up in the coke bed and the operation may be more unstable. Note that this will be the case for both small and large coke beds.
Figure 6:Electrode length submerged into the coke bed versus shape of coke bed. Shape is given as height/ area=h/(πr2). In the flat coke beds, the radius was assumed to be 6m.
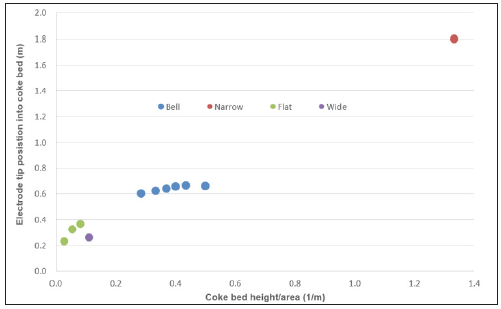
Figure 7:Sketch of the three coke bed archetypes and their respective electrode positions.
Conclusion
By simulating the electrical current paths within coke beds of different size and shape, and using a constant resistance set point, one can see possible current paths; 1) from the coke bed to the metal bath, 2) from coke bed to coke bed directly or 3) in the charge material close to the coke bed. None of the simulations showed the current running higher up in the charge. Looking at the percentage of current going straight down to the metal, which is arguably the more interesting result, we see a very clear correlation with the coke bed size. There is a near linear proportionality between the total coke bed volume and the percentage of current flowing down through the metal, going from above 95% for the smallest coke beds, to around 50% for the largest ones. The shape of the coke bed will also have some effect. The flatter beds give a higher percentage of current going straight down to the metal through the bed instead of leaving through the sides of the electrode or the bed.
It should be noted that the electrode tip height needed to maintain the required total resistance over the furnace also varies greatly based on the coke bed. The flatter the bed, the electrode will be less immersed into the coke bed. Comparing differently shaped coke beds with a height of 3m, the flat bed had an electrode depth into the coke bed of 0.36m, while the spherical bed had a depth of 0.62m and the tall bed had a depth of 1.8m. This may have a major effect on the difference in stability during the addition and cutting of coke, as the shape of the coke bed will change. Finally, in these simulations less than 10% of the current runs in the charge close to the coke bed. Taller beds with a narrow bottom area lead to a higher current flowing through the charge. Almost 7% of the current passes through the charge in the simulation with the tallest coke bed, compared to 2-3% for a flat bed of similar volume. There is also a slight decrease in percentage of current passing through the charge in regards to purely the coke bed volume, going from 2% to 1% when changing a flat bed’s height from 1m to 3m.
References
- Olsen S, Tangstad M, Lindstad T (2007) Production of manganese ferroalloys. Tapir Academic Press, Norway.
- Miyauchi Y, Mochida M, Fuchi Y (2001) High thermal electrical property of manganese ore in production of high carbon ferromanganese. Proceedings of the Ninth International Ferroalloy Congress, Canada.
- Miyauchi Y, Nishi T, Saito K, Kizu Y (2004) Improvement of high temperature electric characteristics of manganese ores. Proceedings of the Tenth International Ferroalloy Congress, Transformation through Technology South Africa, pp. 155-162.
- Barcza NA, Koursaris A, See JB, Gericke WA (1979) The dig-out of a 75MVA high carbon ferromanganese electric smelting furnace. 37th Electric Furnace Conference Proceedings, Detroit AIME, pp. 19-33.
- Eidem PA (2008) Electrical resistivity of coke beds. PhD thesis, Norwegian University of Science and Technology, Norway.
- Olsen SE, Tangstad M (2004) Silicomanganese production-process understanding. Proceedings of the Tenth International Ferroalloy Congress, Transformation through Technology, South Africa.
- Jayakumari S, Tangstad M (2015) Carbon materials for silicomanganese reduction. Proceedings of the Fourteenth International Ferroalloy Congress, Energy efficiency and environmental friendliness are the future of the global Ferroalloy industry, Kiev Ukraine, pp. 374-381.
- Lee YE, Tangstad M (2010) Electric parameters for an efficient smelting performance of HCFeMn alloy. Proceedings of the Twelfth International Ferroalloy Congress, Sustainable Future, Finland, pp. 569-578.
- Steenkamp JD, Hockaday CJ, Gous JP, Nzima TW (2017) Dissipation of electrical energy in submerged arc furnaces producing silicomanganese and high-carbon ferromanganese. The Journal of The Minerals, Metals & Materials Society 69(9): 1712-1716.
- Ringdalen E (1999) The high carbon ferrochromium process, reduction mechanisms. PhD thesis, Norwegian University of Science and Technology, Norway.
- Halvorsen SA, Olsen HAH, Fromeide M (2016) An efficient simulation method for current and power distribution in 3-phase electrical smelting furnaces. International Federation of Automatic Control 49(20): 167-172.
- Dhainaut M (2004) Simulation of the electrical field in a submerged arc furnace. Proceedings of the Tenth International Ferroalloy Congress, Transformation through Technology, South Africa, pp. 605-613.
- Eidem PA, Tangstad M, Bakken JA (2009) Electrical conditions of a coke bed in SiMn production. Canadian Metallurgical Quarterly 48: 355.
© 2019 Hartvedt Olsen HA. This is an open access article distributed under the terms of the Creative Commons Attribution License , which permits unrestricted use, distribution, and build upon your work non-commercially.
 a Creative Commons Attribution 4.0 International License. Based on a work at www.crimsonpublishers.com.
Best viewed in


.jpg)


 Editorial Board Registrations
 Submit your Article
 Refer a Friend
 Advertise With Us
.jpg)


.jpg)


.bmp)
.jpg)
.png)
.jpg)


.jpg)


.png)

.png)


.png)


