
- About Us
- Information
-

The Author ensures that the research has been conducted responsibly and ethically with adherence to all relevant regulations. read more..
- For Authors
- For Reviewer
- Manuscript Guidelines
- Membership
- Publication Ethics
-
- Journals
- Reprints
- e-Books
- Videos
- Policies
- Contact Us
 COVID-19
- Submissions


Full Text
Aspects in Mining & Mineral Science
Weight of Evidence Spatial Quantification of Gold Mineral Systems Components in Southern Part of Kelantan
Mathew TG, Newton SS and Ariffin KS*
Mineral Resources Engineering School of Materials and Mineral Resources Engineering, Malaysia
*Corresponding author: Kamar Shah Ariffin, Mineral Resources Engineering School of Materials and Mineral Resources Engineering, Pulau Pinang, Malaysia
Submission: August 10, 2019;Published: September 30, 2019

ISSN 2578-0255Volume3 Issue5
Abstract
Investigation of the spatial relationships between mineral systems factors and mineralization occurrence is not only significant for modelling ore genesis processes but also helpful in providing mineral exploration guide (potential maps). Despite the gold mining activities in Malaysia Peninsular, no study has applied the mineral systems approach to generate a potential map in the region. And as such, only a little is known about the spatial association of the mineralization with ore controlling factors. In this regard, this remote sensing and GIS-based research, aimed at quantifying the spatial association between the ore formation factors and the mineralization in southern part of Kelantan. The approach had developed a conceptual framework model that linked the mineralization factors (critical element) to their mappable criteria and further linked them to the available datasets. The plausible evidence maps were subsequently quantified by means of the weights of evidence integration method to determine the optimum proximity distance between each of the factors and the mineralization. The spatial quantification revealed that lineaments patterns controlled the gold deposits, and the NE-SW orientation has a stronger correlation with gold mineralization than NW-SE orientation. Hydrothermal alteration zones and igneous rocks distributions also revealed a robust spatial relationship with the deposits. Sedimentary rocks and boundary contacts of rocks types displayed a feeble spatial relationship with the mineralization. The generated map highlighted 68.25% of the total area as favorable zones, and this area has been recommended for further exploration.
Keywords: GIS; Weight of evidence; Prediction map; Gold mineralization; Spatial analysis; Malaysia
Introduction
Most metalliferous deposits have been mined to growth the economic income of both developed and developing nations. In the last few years, a reduction in the prices of most metals have been reported [1]. However, the prices of gold and platinum group metals have always remained high compared to other such as iron, tin and copper [2]. Thus, the exploration of gold remains a good option for several mining companies. A company that deals with mineral exploration programs usually carries out work at different scales (from large to small) with the objective of demarcating and retaining the potentially mineralized areas from the initially acquired exploration fields. Exploration ordinarily ends up with areas worthy enough for drilling. Mineral exploration programs usually involves the integration of datasets of different sources, such as geochemical surveys, geological mapping and remote sensing techniques (including Ariel photographs and satellite images) [3]. Before now (up to the late 80s) such integration of multiple datasets are done traditionally, by overlaying layers of information on the light table in an attempt to discover relationships between them [4]. The traditional approach of generating mineral potential maps consume a lot of time and in most cases produce inefficient maps that could leave some deposits hidden. The major problem of these traditional methods is the widely variability of datasets such as the difference in scale, thus, putting a limit to the utilization of spatial information from the datasets. Today the light table has been replaced by the GIS platform [5]. The increasing computing power of GIS software now make it possible to carried more sophisticated data integration, that utilizes more information from traditional datasets such as remote sensing satellite imagery, geological and geophysical maps. These powerful GIS programs allow the quantification of spatial relationships between mineralization and their ore genesis factors (mineral system components). In this regard, this research demonstrating the spatial quantification the relationship between the ore controlling factors and the gold mineralization occurrence in Kelantan. This idea is to synthesis the critical processes of the gold mineralization, and thereafter translate and integrate them into mappable units, which are subsequently combined into a single the potential gold map.
Mineral Systems Components
The basic idea of mineral systems concepts were reviewed and summarized by Wyborn et al. [6] and recently improved by researchers including [7-9]. Perceiving the ideas from the different review works, Hagemann et al. [7] concluded that the mineral systems concepts deals with; (i) The tectonic event that initiates (trigger) a mineralization event, and consequently fixed a border to its spatial distributions extent on the critical architectural framework of the mineralization windows. In most cases, these tectonic triggering events occur in a fast and brief period, they mostly represent series of geodynamic reorganization of plates such as compressional and subduction processes within a tectonic environment, (ii) The plates tectonic activities that result in creating ‘source regions’ that are generally endowed with metals and the mineralizing fluid that has the ability to transport these metals. These mechanized processes almost always kick-start before the mineralizing events, however, in some few cases, it can extend to early stages of deposition (metal extraction). The amount of fluids and metal embellishment can vary from regions to region depending on the presence or absence of the factors that favors the metal extraction. These favorable factors forms the significant first-order constraints of predictive analysis of the mineral systems concepts, (iii) The processes that result in creating basinal and structural features such as migration pathways (heterogeneity zones) which provides the conduits for hydrothermal passage. The conduits may occur at lithospheric, province, crustal or district scale. These conduit formation processes may occur before the migration of the fluid, some may be dormant and may only be reactivated by the tectonic activities referred to as ‘triggers’, (iii) Physical and chemical processes that drive the flow of hydrothermal fluid (drivers), (iv) The fluid focusing mechanism that facilitate the concentration of mineralizing fluid into discrete mineral deposits at the trapping sites (throttle). (v) Chemical processes (fluid mixing, fractional crystallization, phase immiscibility, fluid-rock interaction), that operate at deposition sites, causing the deposition of metals from the fluid (trap), (vi) The processes that operate during and after metal extraction (deposition) to imprint geophysical and geochemical anomalies, gives clue later recognition (dispersion), (vii) Preservation and exhumation processes that operate to upgrade metal deposition into viable economic deposits.
Based on the above points, time is a vital ingredient in the developing architectural framework of a productive mineral system. Even though the duration of some mineralizing episode maybe brief, mineral systems, in a wider perspective, comprises of time before and after mineralizing episode. In several mineral systems, for instance, the hydrothermal and epithermal system, the district to camp-scale structural architecture may be presence (active or dormant) prior to the mineralizing episode. The conduits which governs the fluid passage all through the mineralizing event may include fault, fold-related faults, folds, fractures zones of rheological contrast and sedimentary structures, in most cases these conduits are form before the mineralizing episode.
Lately, mineral systems had been classified into two major classes, i.e. hydrothermal and orthomagamatic, however, within these two classes there still some transitional systems that are poorly defined. Example of such poorly defined mineral systems are the sediment-hosted deposits that may show the evidence of hydrothermal enrichment. Coeval mineral systems are also good example of poorly defined mineral systems, for example, the porphyry copper systems in eastern Australia.
Geology of Study Area
Figure 1:Elevation model and drainage pattern.

The study area is located between longitude E 101º 20′ 30′′– 102º 20′ 0′′ and latitude N 4º 40′ 0′′–5º 10′ 0′′ in the southern part of Kelantan state (Figure 1). The area covers approximately 4738.32km2. The topography is mountainous characterized with extensive deep valleys. In this selected area of study, the altitude ranges between 854m to 951m. The high mountainous region is located in the South-eastern part of the study area. An extensive drainage network with other small tributaries cut through the study area and conditioned the morphology. The drainage pattern displayed a general orientation of N-S, to NW-SW and the NE-SW, the N-S to NW-SE, these orientations are related to the past orogeny activities. The study area is partly accessible by vehicles and the region is well known for its historic gold mining activities. The study area is characterized by a mix of forest and thick vegetation, it is cover in agriculture (timber logging and rubber plantation), and thus the rock exposures is very minimal. This area is strategically chosen to cover the southern gold belt that span from the central part of the state in north-south trending. The area is characterized with precious mineral and rock comprising of good spread of hydrothermal gold-sulphide bearing quartz-vein. The general geology of the study area (Figure 2), consists of mainly sedimentary Formation and volcaniclastic rocks. The sedimentary Formation has been identified and referred to as Gua Musang Formation which is considered part of the central gold belt of Malaysia. Mohamed et al. [10] recently described Gua Musang Formation as a Middle Permian-Upper Triassic age sedimentary Formation. The Gua Musang Formation is comprising of mainly three members; (i) argillaceous facies, mudstone, and pelitic hornfel, (ii) slate and phyllite, (iii) sandstone and metasandstone rocks. Some of these members occur as outcrop and extend to the Triassic cover of Gunung Rabong Formation in the eastern area.
Figure 2:Geological map of the study area.

Mohamed et al. [10] also described the Gunung Rabong Formation as a Middle-Upper Triassic age Sedimentary Formation, which comprises of sandstone with subordinate shale, mudstone, siltstone, conglomerate and volcanic. Triassic limestone forms cliffbound ridges and row of the isolated tower-like hill in the eastern part of the study area. Some inliers of limestone rocks occur as outcrop in the Permian sedimentary covers in around the southwest area [11,12]. Yao et al. [12] described the intrusive granites in the area to consist of mainly medium to coarse-grained porphyritic biotite granites, hornfelsic haloes accompanied the granites. The study area is also characterized by scattered granitic stocks works of intrusive origin. The geological structure in the area developed as a result of past orogenies activities. Eam et al. [13] based on geochemical, structural and geophysical results, suggested the Triassic and Permian metasedimentary rocks as the host rock for gold mineralization in Kelantan. Previously Heng, & Hoe [14] had noted that the granite in the study area contained some good amount of gold mineralization in shear zones. Well-developed quartz veins accompany the Shear zones; in most cases, the quartz veins cut through the shear granitoids [12]. Two sets of faults control the gold mineralization in the area, the first sets (trending NE-SW) plays a significant role in gold deposition processes compared to the second sets (trending N-S). The hydrothermal quartz veins (Low sulphide quartz vein, high sulphide quartz veins, and shear granitoids) and structurally controlled quartz contain the gold found in the area.
Research Methodology
Phase 1 is the research preparation stage; it involves the establishment of the conceptual framework that links the targeting criteria with available datasets in the study area. At this stage, the general geographical and geologic characteristics of the study area were defined through a comprehensive literature review and partial field visit, the characteristics of the gold mineralization in the study area were also reviewed. This stage was completed by developing the mineral conceptual framework to link the targeting elements with the available datasets, this initiate the second phase of the research. Phase 2 is the spatial analysis stage (GIS analysis), it is divided into three part. The first part involves the creation of a database based on the available datasets, it comprises of the following main tasks (a) digitization of geological maps at scale 1:500, 000 covering the study area; (b) digitalization of known gold prospects (training and testing data); (c) acquisition of Landsat 8 imagery data and (d) acquisition of ASTER DEM images covering the area of study. The second part deals with application of remote sensing techniques to obtain spatial geological information (spatial datasets) such as structural geological features. During the second part, evidence maps were extracted from the database according to the conceptual framework model which highlighted the deposit recognition criteria. The third part involves the implementation of buffer analysis on each of the evidence maps, this leads to the third phase of the research. Phase 3 involves the quantification of the spatial relationship between the different evidence maps, and the known deposits (training data) using the weight of evidence integration method, and in this way, weights were calculated for each of the considered factors. Evidence maps were then reclassified and combined to generate predictions models based on assumption of Bayes’ conditional independence (CI) of individual maps binary maps. This stage also comprises activities such testing and validations of models. Validates models encouraged the commencement of the fourth phase which is the last stage of the research. Phase 4 involves the generation of the potential mineral maps.
Creation of database
The data used in this research consist of 13 known gold deposits and 6 evidence maps of gold mineralization. The evidence maps includes NE-SW and NW-SE lineaments (migration pathways), igneous rocks (heat source), sedimentary rocks (host rocks), boundaries between sedimentary and igneous rocks (traps), and hydrothermal alteration zones. While the lineaments and hydrothermal alteration zones were extracted from Landsat 8 structural synthesized map, the known gold points and other evidence maps were extracted from 2014 mineral distribution and geological map, all obtained from JMG (Kelantan office). The known gold deposits were randomly split into 2 subsets. The first subset of 9 (75%) of the total of 13 known gold deposits were considered as the training data. The other subsets of 4 (25%) of the 13 known gold deposits are used as the testing data. A pixel size of 15m by 15m was used in the probabilistic mapping of gold mineralization. The choice of this pixel size is based on a consideration of the size of the known mineral occurrence and the scale of the study area. The known gold prospects (training and testing data), geological maps, study area shapefile, and remote sensing satellite imagery (Landsat 8 OLI, ASTER), all form part of the created database. To process all the available data in a GIS environment, proper digitalization and geo-referencing of related geological data using the WGS 84 Datum UTM 47 N was necessary.
Weight of evidence model
The WofE method was originally invented for medical diagnoses and was applied in mineral resource assessment in the 1980s. A mathematical probability framework concepts originate the basic concept of WofE Model [15]. The approach is based on prior, posterior and odd probability, it uses the logarithmic linear form of Bayesian probability and statistical tools to evaluate the relative important of evidence maps (Shahi, 2014). Applying the method for mineral exploration always involve composite analysis to some evidence factors, these evidence factors are usually derived from geological information. A paramount assumption of WofE technology considered each evidence factor to display its unique conditional independence of the information factor [15]. Sometimes the presence of conditional independence (CI) can inflate or deflate posterior probability. However, in mineral exploration, the possibility of CI existence is almost always low, because patterns are chosen based on empirical spatial relationships with mineral deposits, and in most cases, the patterns rely on the same underlying geology system. Involving more models implies more related evidence and thus reducing the chances of conditional independence. In assessment where CI cannot be eliminated or reduce to a lower acceptable level, the result of posterior probability should be used to generate an ordinal ranking system.
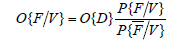
In implementing the model, considered the hypothesis (H) about the probability of finding a mineral deposit say F in an exploration area that contain related set of evidence say V=(V={V1, V2….,Vn and V1,V2 .…,Vn are conditionally independent with each other). The prior probability (P{F}) is the probability of the occurrence of deposit type F without regarding any known evidence. The posterior probability (P{F/V}) (P{F⁄V}) is the probability of the occurrence of mineral deposit of type F, considering the existing of V in the assessment area, it is also referred to as conditional probability. And the odd (O{F}) is defined to be a ratio of the occurrence of an event such P{F}, to the probability of its non-occurrence such P{F ̅}. Reviewing the previous work of Bonham-Carter 2004 the abovedefined probabilities can be expressed as follows.

For the Hypothesis H on F with given V, its odd is:
Note: In weight of evidence model, each evidence Bi in B need to be divided into subset and expressed in term of set theory as: A (existing or Presence) and A̅ (In existing or absence). The properties of the two subsets can be expressed as
(1) A∪A ̅=Vᵢ (A and A ̅ makeup Vᵢ ), i=1,2….n i
(2) A∩A ̅=O (A and A ̅ are Mutually exclusive) ii
Following the definition and properties of binary patterns introduced above, the following equation can be derived:
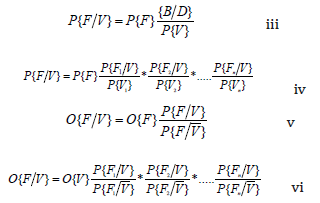
Rewriting in logarithmic form equation (vi) becomes
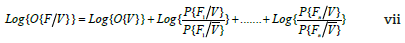
If Bi is present, P{Fi/V }/P{Fi/V } is refers to as sufficient ratio (L.S). If absent, it is called necessity ratio (LN) respectively, the natural logarithm of LS ratio and LN ratio is the positive weight of evidence (W+), and negative weight of evidence (W-) respectively. To simplify let Wo represent natural logarithm of O{D}.
∴ Above Equations becomes
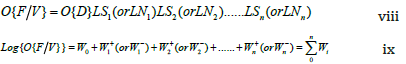
The posterior probability from the above equation can be written as follows:
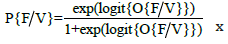
The posterior probability can be calculated from either equation vi, vii, or viii. To divide a continue variable into binary patters, a cutoff point refer to as contrast (C) is needed and is expressed as:
C =W+i −W−i i=1, 2, …,n xi
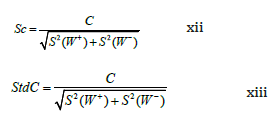
In mineral assessment, where a large number of mineral occurrence is encountered, in each domain test, the maximum contrast indicate the best measure of correlation with the mineral deposits occurrence points [16]. In the case where a small area is involved and a small number of mineral deposits occurrence is encountered, it might result to a high degree of uncertainty of weights and thus C can be meaningless. In such cases a measure confidence of contrast, refer to studentized C is determine. The studentized value of C, can be arithmetically defined as the ratio of C to its standard deviation, C/s(C). The standard deviation of C is the square root of the sum of the variances of the weights.
Calculation and quantification processes
WofE of evidence is a method that uses a log-linear expression of Bayes’ Rule of probability with assumption of conditional independence to combined map patterns [15,17]. WofE gives users the opportunity to explore the spatial relationship of deposits, with exploration datasets [15]. For each gold deposits, a pair of weight is calculated, one for presence of the related factors (W+) and one for absence of the related factors (W-). The weight are calculated based on the spatial distribution of the known gold deposits (training data). The positive weight (W+) defines the conditional probability of finding a deposit considering the presence of the evidence map, whereas the negative weight (W-) defines the conditional probability of finding a deposits based on the absence of the evidence map. The contrast C(=W+-W-) defined the net spatial association. A positive contrast denotes a presence of spatial association and the negative contrast indicates absence of spatial association. Contrast values getting to 0 indicates no or poor spatial association. Studentized values of contrast gives the measures of confidence for contrast values. In this research the contrast value (C) and the studentized value Std(C) determines the optimum distance (cut-off) of buffer distance of the spatial relationship of factors. All evidence maps were later reclassified into binary maps based on the calculated contrast values C (Figure 3). The approach of this work assigned the value of 1 for areas that are anomalous with the selected factors of mineralization such as faults, igneous rocks, sedimentary rock and rocks boundaries, and a 0 value for the non-anomalous area. The binary maps were then combined using equation xi, into predictive models and tested to ascertain level of conditional dependence.
Figure 3:Research workflow.

Results and Discussion
The quantification processes begins after all the digitalized factors (evidence) were buffered and converted to equal raster classes. All calculation were performed within a spatial database of 15mx15m pixel size. The procedure determines the number of gold deposits (training data) occurring in each class of the considered factors using the Tabulated Tool in ArcGIS 10.3 Toolbox and the weights were calculated based on the Bayesian probability concept. The calculated weights gives the spatial quantification of all factors used; it permits the reclassification of evidence maps. The contrast value C and the studentized Std(C) allows the determination of optimum buffer distance. The reclassification analysis allocate a value of 1 to the prospective area and a zero value to nonprospective area. (Figures 4, 5 & 6) shows the buffer distance map, graph of variation of spatial relationship and reclassified map of NE-SW lineaments respectively. Table 1 displayed the summarized weights for all the six evidence.
Figure 4:Buffered distance map for NE-SW lineament.

Figure 5: Variation of spatial relationship of contrast (C), studentized contrast (Std(C)), and % of Au occurrence (Occ) with cumulative distance away from NE-SW trending.

Figure 6: Reclassified evidence map for NE-SW lineaments, the green colour indicate the favorable zones.

Table 1:Summarized weights for all the six evidence.

Generated model
All the reclassified evidence maps were combined and integrate to generate the predictive map. The combination processes usually output maps that always show some degree of conditional probability dependence [18]. The conditional dependence amongst evidence maps may result in artificial inflation or deflation of posterior probability. Thus, the generated map in this work is viewed as a relative map of prospectivity. However, the approach created four models to ascertain the degree of inflation of individual layers. All the models were created based on the mathematical expression of the Bayesian probability concepts. Variation of posterior probability of the model depends on evidence layers, the substitution of the layers leads to the selections of the perfect model. The assumption of conditional independence (CI) is greatly violated by model 1. Model 1 was created using all the evidence layers. T (expected deposits) is 9.60 more than the observed deposits. In this case, the posterior probability is hugely inflated by the violation of CI. The inflation of the CI is likely caused by the evidence layer for the lithological boundary within sedimentary rocks, as these layers display some small amount of mutual exclusiveness. With an attempt to reduce the amount of conditional dependence, more different combination were tried, and three additional models were created. Table 2 summarized the CI values of the created model. In all the created models, only model 2 shows a lesser CI but still significantly violates the assumption of the CI. In general, all the models generated in this study are affected by CI. However, this study aims to quantify the spatial relationship between the ore genesis factors. Moreover, the issue of how CI affects the performance of the Bayesian-based model had been addressed by Porwal et al. [19] which reported that conditionally dependent layers might enhance Bayesian-based model, where the interest of research lies in exploration guides maps (potential maps), then conditional dependency might be less regarded and as such treat all maps as favorability maps instead of a probability scores. In this regard, this research generated the final gold potential map (Figure 7) based on model 2.
Table 2:Summarized values CI test.

Figure 7:Final Au potential map, the brown colour highlight the areas of high potential of mineralization occurrence.

Model validation
Table 3 was created based on the potential map generated (Figure 4), it shows 68.81 % of the total area as favorable zones and 31.75 % as unfavorable zones. It also shows that 9 (100 %) of the 9-training data fall within the favorable zones. 3 (75 %) of the 4-testing data are within favorable zones, and the only 1 % (25) falls within the unfavorable zones. This statistical blind test approach validate the generated model. However, the 1 testing data falling into the unfavorable zones are indisputably related to the selection of evidence map and statistical problems such as conditional dependence (CI).
Table 3:Summarized validation values.

Implication of research
Mineral systems characteristics of Kelantan: This research demonstrated that gold deposits has distinct characteristics of occurrence, which are functions of mineral systems processes responsible for their formation. The formation processes of a particular mineral deposits (gold) in a specific location may show a slight variation in different locations. The geological complexity of mineralization areas always has a direct implication on the ore genesis factors. Therefore, creating a potential map for a particularly sought mineral requires the spatial knowledge of ore genesis processes in the concerned area. In this regard, it is of maximum importance to build conceptual models for the sought mineral in every mineral exploration. An excellent conceptual model is developed based on the proper understanding of the spatial relationship between the sought mineral type and the ore genesis processes. A conceptual model is not the final determinant of exploration success but rather serves as the baseline for the translation and linking of mappable criteria to the available geospatial datasets.
The formation processes of gold deposits includes three vital aspects such as the source of gold-bearing fluid, the depositional environment, and the channels for fluids movement. Research on the source fluids had long-established its relationship with unambiguous tectonic settings such as convergence and subductions margins [20]. More advanced studies even demonstrated that gold-bearing fluids originate from the lithospheric mantle. In Malaysia, Bentong Rabong Suture zones and Lebir faults are the two major evidence of tectonic activities. The initiating force of these features may have resulted in originating the lineament structures revealed by the processed satellite images in this study. Crustal-scale structures (Lebir faults in this study) of consequential geodynamic activities serve as pathways for fluid passage to the upper crust. The migration mechanism enabled the formation of gold in structurally controlled environments. Usually, the hydrothermal gold deposits are controlled by structures, (NE-SW and NW-SE lineaments in this study). Consequently, the deposits are anticipated to occur in the spatial proximity of the structures. Areas with well pronounced geological features (lineaments) should have a high probability of gold mineralization. In this study, strong spatial correlation is observed both between NE-SW lineaments and gold mineralization and the lithological contact between intrusive rocks and sedimentary. A weak spatial relationship is perceived between the NW-SE lineaments and gold mineralization. This indicates that gold mineralization in Kelantan is mainly controlled by NE-SW lineaments. The current results suggesting NE-SW lineaments as the major control for gold formation are in agreement with previous inquiries on the structural association for gold occurrence in Kelantan [21,22]. The NW-SE faults might have played a substantial role also, but flow direction is determined by the pressure and the source fluid location, in this regard, the NE-SW faults were more favored. Moreover, the conduits of hydrothermal fluid flow of hydrothermal gold mineral systems includes all permeable zone within the mineral systems. All potential conduit must be open and permeable during the development of the mineral systems. However, conduits that form before the mineral systems development are also important, as tectonic events that initiate or triggers the mineralizing events may reactivate and channels these conduits structures from the source to the depositional sites. A typical example is the activation of preexisting extensional structures during orogenesis, which acts as fluid conduits in the following orogenic gold mineral [23,24].
In central belt especially in Kelantan, the heating chamber that initiates the source fluids is the granite bodies (igneous activities). This current research detected a reasonable distance relationship between intrusive rocks and gold mineralization. The relationship suggest that igneous activities are the main initiators of the gold formation process at great depth. Usually during the sideways movement of hydrothermal fluids in favorable channels, favorable conditions (reduced pressure) allow gold deposition in favorable environments. Thus, the irregularities in the observed gold deposits distance relationship observed in this study, are as a result of pressure variation and absence of a deposition environment. The presence and absence of traps maybe another possible interpretation of the irregularities in the observed relation of igneous bodies and the mineral deposits. Trapping is a vital component of mineralization without which mineralizing fluid may not form an economic deposit. Sedimentary rocks in this area of study are the potential trappers, thus regarded as the host rocks. A weak correlation is detected between sedimentary rocks and gold mineralization. In general sense the variation observed in all the considered factors may also be related to exhumation, preservation and upgrading.
Predictive map: The predictive mapping revealed some significant findings. The final target map identified and pinpointed areas of both known and new gold mineralization. This research categorized the generated map into 4 zones; high potential zone, potential zones, low potential zones, and non-potential zones (Figure 7). The main control factors such as the source, migration pathways and depositional environment are the requirement for ore deposits occurrence. Thus, areas with zero probability of any of the key processes or features reflecting the processes of ore formation always show zero probability of ore occurrence. In this study, the high potential areas in the predictive map coincide with the Pulai gold mines and katok Batu area. These two areas are characterized by highly structural features (faults) and intrusive igneous rocks. The moderate potential area is within the igneous proximity with structural features such as the NE-SW lineaments. Some of the low potential zones are located outside the igneous environments.
Conclusion
The spatial relationship between gold mineralization and related factors have been quantified for southern part of Kelantan, using mineral systems approach and WofE data integration method. The approach has successfully linked the factors (critical elements) of gold formation to available datasets. All the established mineral systems factors had been extracted from remote sensing satellite images and geological map of the study area. The spatial investigation results shows that the structural features (migration pathways), and igneous rocks distributions (sources of heat), have a strong spatial relationship with gold mineralization. The NE-SW lineaments appear to have a strong spatial correlation with the gold mineralization compared to NW-SE lineament. Other factors such as sedimentary rocks, hydrothermal alteration zones and contacts between rock types, show no significant spatial relationship with the gold mineralization. The architectures of the system consist of lineaments, igneous, and sedimentary rocks. The lineaments are the products of the significant tectonic activities that resulted in the formation of Bentong Rabo Suture Zone (BRZS). The igneous rocks origin are probably related to the intra-cratonic setting for the BRZS, thus implying that mantle-derived fluids gained access to the crust, whereby the gold source might have been originated. The sedimentary rocks probably acted as a local environment for deposition and as an exhumation-upgrading factor rather than factor controlling the exact location of gold deposits. The contact between igneous and sedimentary rocks also acted as traps as well as channels for hydrothermal fluids passage.
The weight of evidence was proven useful to generate predictive mineral maps and also useful to investigate the spatial association of gold mineralization with the mineral system component, as well as infer some information related to the genesis of gold deposition. The right choice of factors that indicate or represents the mineral systems component for the building of conceptual frameworks determines the effectiveness of the resultant output of the model. The generated potential map is useful; it locates the occurrence of new mineralization and validates the known ones in the area.
References
- Shafiee S, Topal E (2010) An overview of global gold market and gold price forecasting. Resources Policy 35(3): 178-189.
- Zhu Y, Fan J, Tucker J (2018) The impact of monetary policy on gold price dynamics. Research in International Business and Finance 44: 319-331.
- Gandhi SM, Sarkar BC (2016) Geochemical exploration. Essentials of Mineral Exploration and Evaluation pp. 125-158.
- Porwal A, Carranza EJM (2015) Introduction to the special issue : GIS-based mineral potential modelling and geological data analyses for mineral exploration. Ore Geology Reviews 71: 477-483.
- Yousefi M, Nykänen V (2017) Introduction to the special issue: GIS-based mineral potential targeting. Journal of African Earth Sciences 128: 1-4.
- Wyborn LAI, Heinrich CA, Jaques AL (1994) Australian proterozoic mineral systems: Essential ingredients and mappable criteria. AusIMM Annual Conference 1: 109-115.
- Hagemann SG, Lisitsin VA, Huston DL (2016) Mineral system analysis: Quo vadis. Ore Geology Reviews 76: 504-522.
- McCuaig TC, Hronsky J (2017) The mineral systems concept: The key to exploration targeting. Applied Earth Science 126(2): 77-78.
- Wyman DA, Cassidy KF, Hollings P (2016) Orogenic gold and the mineral systems approach: Resolving fact, fiction and fantasy. Ore Geology Reviews 78: 322-335.
- Mohamed KR, Joeharry NAM, Leman MS, Ali CA (2016) The gua musang group: A newly proposed stratigraphic unit for the permo-triassic sequence of northern central belt, peninsular Malaysia. Bulletin of the Geological Society of Malaysia 62: 131-142.
- Yao K, Idrees MO, Pradhan B (2015) Mapping surface geologic formation under vegetation using landsat 8: Case study of gua musang gold field, Malaysia. 26th GRSG Annual Conference Challenges in Geological Remote Sensing.
- Yao K, Pradhan B, Idrees MO (2017) Identification of rocks and their quartz content in gua musang goldfield using advanced spaceborne thermal emission and reflection radiometer imagery. Journal of Sensors.
- Eam EK, Hashim SFS, Mohd Hashim M.H, Mohd Yusof MT (2013) Case study of alluvial gold mining at pulai mining in gua musang, kelantan, malaysia. Advanced Materials Research 858: 236-242.
- Heng GS, Hoe TG, Wan Fuad WH (2006) Gold mineralization and zonation in the state of kelantan. Geological Society of Malaysia Bulletin 52: 129-135.
- Bonham Carter GF (1994) Tools for map analysis: Map pairs. Geographic Information Systems for Geoscientists pp. 221-266.
- Bonham Carter GF, Agterberg FP, Wright DF (1988) Integration of geological data sets for gold exploration in nova scotia. Photogrammetric Engeneering and Remote Sensing 54(c): 1585-1592.
- Bonham Carter GF, Kerswill J, Franklin JM (1998) Mineral potential maps for slave province, northwest territories using weights of evidence models. In: Geological Society of America, 1998 annual meeting. Abstracts with Programs - Geological Society of America.
- Porwal AK, Kreuzer OP (2010) Introduction to the special issue : Mineral prospectivity analysis and quantitative resource estimation. Ore Geology Reviews 38(3): 121-127.
- Porwal A, Carranza EJM, Hale M (2006) A hybrid fuzzy weights-of-evidence model for mineral potential mapping. Natural Resources Research 15(1): 1-14.
- Hronsky JM, Groves DI (2008) Science of targeting: Definition, strategies, targeting and performance measurement. Australian Journal of Earth Sciences 55(1): 3-12.
- Tagwai MG, Jimoh OA, Ariffin KS, Abdul Razak MF (2019) Investigation based on quantified spatial relationships between gold deposits and ore genesis factors in northeast Malaysia. Journal of Spatial Science pp. 1-24.
- Mathew TG, Ariffin KS (2018) Remote sensing technique for lineament extraction in association with mineralization pattern in central belt peninsular malaysia. Journal of Physics: Conference Series 1082(1).
- Cohalan L, Weinberg RF, Squire RJ, Allen CM (2015) Early deformation in the eastern goldfields, yilgarn craton, western australia: A record of early thrusting? Precambrian Research 266: 212-226.
- Davis BK, Blewett RS, Squire R, Champion DC, Henson PA (2010) Granite-cored domes and gold mineralisation: Architectural and geodynamic controls around the archaean scotia-kanowna dome, kalgoorlie terrane, western australia. Precambrian Research 183(2): 316-337.
© 2019 Ariffin KS. This is an open access article distributed under the terms of the Creative Commons Attribution License , which permits unrestricted use, distribution, and build upon your work non-commercially.
Editor In Chief


.jpg)


Signup for Newsletter

Quick Links
 Editorial Board Registrations
 Submit your Article
 Refer a Friend
 Advertise With Us
Our Recent Edition

.jpg)


Top Editors


.jpg)


.bmp)
.jpg)
.png)
.jpg)


.jpg)


.png)

.png)


.png)


Financial Support

Sponsors

Latest e-Books

Latest Video

 a Creative Commons Attribution 4.0 International License. Based on a work at www.crimsonpublishers.com.
Best viewed in
a Creative Commons Attribution 4.0 International License. Based on a work at www.crimsonpublishers.com.
Best viewed in