
- About Us
- Information
-

The Author ensures that the research has been conducted responsibly and ethically with adherence to all relevant regulations. read more..
- For Authors
- For Reviewer
- Manuscript Guidelines
- Membership
- Publication Ethics
-
- Journals
- Reprints
- e-Books
- Videos
- Policies
- Contact Us
 COVID-19
- Submissions


Full Text
Aspects in Mining & Mineral Science
Optimal Inventory Strategies for Reducing Carbon Emissions Through Mathematical Model
Priyan S*
Department of Mathematics, Mepco Schlenk Engineering College, India
*Corresponding author: Priyan S, Department of Mathematics, India
Submission: February 26, 2019;Published: April 10, 2019

ISSN 2578-0255Volume2 Issue5
Abstract
Today industries are looking for solutions to reduce carbon emissions associated with their operations. Operational adjustments, such as modifications in batch sizes or order quantities, have proven to be an effective way to decrease emissions. This paper provides a new mathematical model which integrate cost and emissions in transportation and storage to execute optimal operational adjustments for defective products in a two-echelon supply chain system. This research may help both the government and the industry to adopt appropriate carbon reduction regulations.
Keywords:Optimization; Inventory; Carbon emission; Convex
Introduction
Manufacturing engineering is concerned with the design, operation, and control of systems whose components are human beings, machines, raw materials, and money. Contrary to other engineering disciplines, it deals not only with technical issues involving man-made systems, but also with behavioral, financial and quality management, manufacturing strategy and paradigms, human factors, manufacturing systems design and operations, supply chain and inventory management. In this direction, supply chain and inventory management research have been a topic of extensive research in the manufacturing industries [1-5]. The main goal of supply chain management research is to reduce the unnecessary costs without sacrificing customer service. Effective inventory management is fundamental to a global manufacturing supply chain strategy.
To prevent climate change, many nations are beneath growing pressure to gradual down carbon emissions with a few objectives to lessen emissions or even law preparation to slash emissions. This, in impact, ought to push firms in all industrial sections to undertake initiatives to store energy and to lessen emissions. The largest source of greenhouse gas emissions from human activities in the United States is from burning fossil fuels for electricity, heat, and transportation (Figure 1). The amount of associated emissions generated from transportation and storage process is mainly determined by inventory control decisions, transportation frequency and energy efficiency. Without considering carbon emissions in inventory management, the decision objective is usually set as the total cost minimization or the total profit maximization. However, taking emission reduction into account is likely to change the optimal solution and incurs additional cost. In this connection, carbon emission issues in inventory management have attracted attention in literature recently.
Figure 1:Worldwide carbon emission Chart.

Jaber et al. [6] considered a supply chain model with a coordination mechanism to consider carbon emissions from manufacturing processes. Hammami et al. [7] considered carbon emissions in a deterministic multi-echelon supply chain with lead time constraints. Jauhari et al. [8] addressed a cooperative inventory model for vendor-buyer system with un equal sized shipment, defective items involving carbon emission cost. Sunil et al. [9] designed an integrated vendor buyer inventory model for deteriorating items with the imperfect quality considering carbon emission. Nikunja et al. [10] provided a suggestion to the manager of manufacturing firm who may apply two policies, shortages and adjustment t of wholesale price, to reduce GHG emission. Noraida et al. [11] derived a recovery model of a two-stage supply chain subject to supply disruption with consideration of safety stock and carbon emission. Qingguo et al. [12] addressed the effects of carbon emission reduction on supply chain coordination with vendormanaged deteriorating product inventory. The aim of this paper is to design an extensive in targeted two-echelon inventory model for handling joint decision-making with the consideration of carbon emission.
Mathematical Model
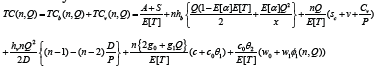
Once the buyer orders a lot size of Q units, the vendor produces the items in a lot size of nQ units in each production cycle of length nQ/D with constant production rate P units per unit time, and the buyer will receive the supply in n lots each of size Q units. The vendor ships in its first lot as soon as it has Q units. (Figure 2 & 3) illustrate the inventory patterns at the buyer and vendor, respectively. (Figure 2) leads to the first lot size o f Q units are ready for shipment after time Q/P just after the start of the production. During the production period, Tp = nQ/P, the vendor’s inventory is building up at a constant production rate P which is higher than demand rate D (i.e. P >D), and simultaneously supplies a lot of size Q units to the buyer on expected every Q/D units of time. Subsequently, during the nonproduction period, Td, the vendor continues his shipments to the buyer on expected every Q/D units of time until the inventory level falls to zero. The buyer starts screening at the beginning of the cycle and discards or salvages the defective lot at the end of this screening process. Thus, the buyer’s total cost in a vendor’s cycle is the sum of ordering, holding, screening and the shipment costs
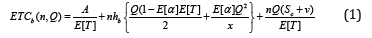
Figure 2:Buyer’s inventory in vendor’s one cycle.

Now the total inventory moved to the buyer in a cycle by the
vendor is
Thus, in a cycle, the vendor’s total inventory in a cycle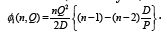
Figure 3:Vendor’s inventory level in a one cycle with time.

Let g0 denote fuel consumption of the unloaded (empty)
vehicle andg1 denote unit fuel consumption factor if the supplier’s
transportation vehicle is loaded with goods. This research
considers g0 + g1 Q captures amount of fuel consumption for a oneway
delivery from supplier to buyer. We assume that backhaul is
not used and return vehicles are empty, and that g0 is amount
of the fuel consumption for the return trip. The total amount of
fuel consumption is g0 + g1 Q for one shipment. Hence, vendor’s
expected transportation cost per unit of time is  In this model, we measure the total amount of carbon emissions from
transportation and storage. Thus, the associated amount of carbon
emissions is designed by
In this model, we measure the total amount of carbon emissions from
transportation and storage. Thus, the associated amount of carbon
emissions is designed by
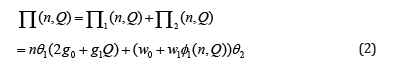
In Eq. (2), Π1(n,Q)and Π2(n,Q) are the amounts of carbon emissions from transportation and storage, respectively. Then θ1 and θ2 are carbon emission factors for fuel and electricity. In Π2(n,Q) , w0 and w1 are fixed and unit variable electricity consumption for storage. Accordingly, the supplier’s carbon emissions cost per unit time is derived by

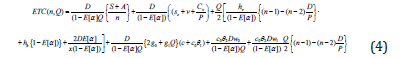
Hence, the vendor’s expected total cost per unit time is the sum of the setup cost, holding cost,
transportation cost, carbon emission cost and production cost are designed by
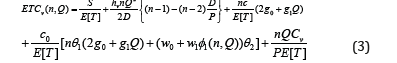
Accordingly, the expected total cost per unit time for the proposed supply chain system is given by sum of Eqs. (1) and (3), mathematically
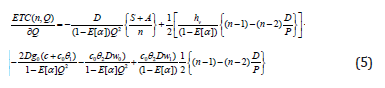
Hence, using 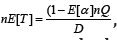 , the integrated expected total cost
per unit time, after some algebraic simplification, is
, the integrated expected total cost
per unit time, after some algebraic simplification, is
Solution Procedure
The problem formulated in the previous section appears as a nonlinear programming problem. To solve this kind of nonlinear problem, we follow the similar procedure of most of the literature dealing with nonlinear problem. That is, first we relax the integer requirement on n, then try to find the optimal solution of ETC (n, Q) using the classical differential calculus optimization technique.
For fixed Q, we can prove the average total ETC (n, Q) is a convex function of n, which indicate that there must be an optimal n = n* to meet the following equation:
𝐸𝑇𝐶 (𝑛∗, 𝑄) ≥ 𝐸𝑇𝐶 (𝑛∗ + 1, 𝑄)
𝐸𝑇𝐶 (𝑛∗, 𝑄 ≥ 𝐸𝑇𝐶 (𝑛∗ − 1, 𝑄))
Property 1. For fixed Q, 𝐸𝑇𝐶 (𝑛, 𝑄) is a convex function of n.
Proof. Taking the first and second partial derivatives of 𝐸𝑇𝐶 (𝑛, 𝑄) with respect to n, we have
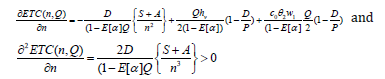
Therefore, for fixed Q, 𝐸𝑇𝐶 (𝑛, 𝑄) is convex in n.
This completes the proof of Property 1.
Now, for fixed n, we take the first partial derivative of 𝐸𝑇𝐶 (𝑛, 𝑄) with respect to Q, and obtain
Hence, for fixed n, 𝐸𝑇𝐶 (𝑛, 𝑄) is convex in Q since

Thus, for fixed n, Eq. (6) gives optimal value of Q such that the integrated expected total cost is minimum. Furthermore, based on the convexity behavior of objective function with respect to the decision variables the following algorithm is developed to find the optimal values for Q and n.
Algorithm
a) Step 1. Set n = 1.
b) Step 2. Determine Q from Eq. (6)
c) Step 3. Compute the corresponding 𝐸𝑇𝐶 (𝑛, 𝑄) by putting Q in Eq. (4).
d) Step 4. Set n = n+1, repeat the step 2 and 3 to get 𝐸𝑇𝐶 (𝑛, 𝑄).
e) Step 5. If 𝐸𝑇𝐶 (𝑛, 𝑄) ≤ 𝐸𝑇𝐶 (𝑛 − 1, 𝑄), then go to step 4, otherwise go to step 6.
f) Step 6. Set (𝑄∗, 𝑛∗) = (𝑄, 𝑛 − 1), then the set (𝑄∗, 𝑛∗) is the optimal strategies for the proposed model.
Conclusion
Today’s one of the most important aspects of inventory management that has significant role in supply chain operations is the carbon emission of defective products in multi-echelon inventory systems. The decision objective is usually set as the total cost minimization or the total profit maximization without considering carbon emissions in inventory management. However, taking emission reduction into account is likely to change the optimal solution and incurs additional cost. In view of this we include the possible relationship between transportation and storage in the existing model and then investigate the joint impacts of carbon emission. This paper provides a modified integrated inventory model which integrates cost and carbon emissions in transportation and storage. We designed an algorithm to find the optimal inventory strategies in order to minimize carbon emission cost and system cost. Our proposed algorithm may help both the government and the industry to adopt appropriate carbon reduction regulations.
References
- Priyan S, Uthayakumar R (2015) Mathematical modeling and computational algorithm to solve multi-echelon multi-constraint inventory problem with errors in quality inspection. Journal of Mathematical Modelling and Algorithms in Operations Research 14(1): 67-89.
- Priyan S, Palanivel M, Uthayakumar R (2015) An inventory model with finite replenishment, probabilistic deterioration and permissible delay in payments. Journal of Management Analytics 2(3): 254-279.
- Priyan S Uthayakumar R (2017) An integrated production-distribution inventory system involving probabilistic defective and errors in quality inspection under variable setup cost. International Transaction in Operational Research 24: 1487-1524.
- Chandra KJ, Sunil T, Mamta G (2018) Impact of trade credit on inventory models for weibull distribution deteriorating items with partial backlogging in two-warehouse environment. International Journal of Logistics Systems and Management 30(4): 503-520.
- Lin Feng, Jia Tao , Wu Feng , Yang Zhen (2019) Impacts of two-stage deterioration on an integrated inventory model under trade credit and variable capacity utilization. European Journal of Oper. Rese 272(1): 219-234.
- Jaber M Y, Glock CH, El Saadany, A M A (2013) Supply chain coordination with emissions reduction incentives. International Journal of Production Research 51: 69-82.
- Hammami R, Nouira I, Frein Y (2015) Carbon emissions in a multiechelon production-inventory model with lead time constraints. International Journal of Production Economics 164(C): 292-307.
- Jauhari, WA, Pamuji, AS, Rosyidi, CN (2014) Cooperative inventory model for vendor-buyer system with unequal sized shipment, defective items and carbon emission cost. International Journal of Logistics Systems and Management 19: 163-186.
- Sunil Tiwari, Yosef Daryanto, Hui Ming Wee (2018) Sustainable inventory management with deteriorating and imperfect quality items considering carbon emission. Journal of Cleaner Production 19(2): 281- 292.
- Nikunja MM, Debabrata KG, Shibaji P , Shib SS (2018) Managing greenhouse gas emission cost and pricing policies in a two-echelon supply chain. CIRP Journal of Manufacturing Science and Technology 20:1-11.
- Noraida Azura Darom, Hawa Hishamuddin, Rizauddin Ramli, Zulkifli Mat Nopiah (2018) An inventory model of supply chain disruption recovery with safety stock and carbon emission consideration. Journal of Cleaner Production 197: 1011-1021.
- Qingguo B, Yeming G, Mingzhou J, Xianhao X (2019) Effects of carbon emission reduction on supply chain coordination with vendor-managed deteriorating product inventory. International Journal of Production Economics 208: 83-99.
© 2019 Priyan S. This is an open access article distributed under the terms of the Creative Commons Attribution License , which permits unrestricted use, distribution, and build upon your work non-commercially.
Editor In Chief


.jpg)


Signup for Newsletter

Quick Links
 Editorial Board Registrations
 Submit your Article
 Refer a Friend
 Advertise With Us
Our Recent Edition

.jpg)


Top Editors


.jpg)


.bmp)
.jpg)
.png)
.jpg)


.jpg)


.png)

.png)


.png)


Financial Support

Sponsors

Latest e-Books

Latest Video

 a Creative Commons Attribution 4.0 International License. Based on a work at www.crimsonpublishers.com.
Best viewed in
a Creative Commons Attribution 4.0 International License. Based on a work at www.crimsonpublishers.com.
Best viewed in