- Submissions

Full Text
Aspects in Mining & Mineral Science
Geophysical Investigation of the Seismogenic Monitoring Center, Ile-Ife, Nigeria
Eshimiakhe Daniel1*, Jimoh Raimi1, Bagudu Larry1, Yusuf OB1 and Alhassan Idris2
1Department of Physics, Nigeria
2Centre for Geodesy and Geodynamics, Nigeria
*Corresponding author: Eshimiakhe Daniel, Department of Physics, Kaduna state, Nigeria
Submission: November 20, 2018;Published: January 23, 2019

ISSN 2578-0255Volume2 Issue4
Abstract
2D electrical resistivity tomography was observed at Ile-ife seismographic station, Osun state Nigeria with the aim of investigating the geological structures beneath the station in order to identify areas of anomalous resistivity that might be related to fractures or fault lines and also determine the lithology of the subsurface. This is to ensure that data observed by the seismic station are gotten with less noise. The underground conditions at a station influence both the seismic signal and the noise conditions and thus have a significant bearing on the potential sensitivity of a seismic station. The survey was carried out with Terrameter SAS 1000 and ES 464 electrode selector equipment. Dipole-dipole configuration at electrode spacing of 2m was used to acquire the data. The result showed that the station is underlain by three layers; overburden composed of lateritic clay, clayey sand, the weathered and fresh basement. Fault lines and fractured zones were not observed in all profiles. The result was also compared with bedrock quality grades, which further inferred best sites for seismic station based on the lithology of the area.
Keywords: Seismic station; ER
Introduction
Seismological observatories are houses specifically built to house seismic hardware. The science of seismology depends critically on data collected at hundreds of observatories world-wide. These observatories are operated by variety of agencies, staffed by seismologists and technicians whose training and interest vary widely. While in industrialized countries, the observatory personnel normally have easy access to up-to-date technologies, spare-parts, infrastructure, know-how, consultancy and maintenance services, those in developing countries are often required to do a reliable job with very modest means. Recent seismic activities in Nigeria and some parts of the West-African sub-region has shown that the region is most probably seismically unstable, that is, there exist fault lines that pass through the region. Therefore, the need to continuously monitor the crust and the upper mantle for possible prediction of earthquake phenomena informed the establishment of the Center for Geodesy and Geodynamics, under the Federal Ministry of Science and Technology has been saddled with the responsibility of establishing and networking of Nigeria Network seismographic stations. Scientists and technicians at the centers have been working round the clock to ensure that the quality of data obtained from these stations is of international standard. Quality data are required with less noise to achieve this.
The observance of noise on the seismic data affects the quality for precise earthquake locations. This noises which could be attributed to geological structures beneath the subsurface, could give false interpretation of the subsurface. This research is to ensure that such data are gotten with less noise due to unknown geological structures beneath the subsurface. To ensure that such data are correct, a geophysical investigation is required to be carried out at the station to identify areas of anomalous resistivity that might be related to fractures or fault lines and to also determine the lithology of the subsurface. This to ensure that the data collected are of genuine quality and not just inferred by geological structures.
Geophysical investigations of the earth involve studying the physical properties of the earth to provide vital information on subsurface material conditions for numerous practical applications [1]. These are done by taking measurements at or near the earth’s surface that are influenced by the internal distribution of physical properties. Consequently, analysis of these measurements can reveal how the physical properties of the earth’s interior vary vertically and laterally that reflect the subsurface geology. The methods employed include gravity, magnetics, seismic, resistivity, induced polarization, self-potential, radiometrics, ground penetrating radar, electromagnetic methods, etc. These methods are cost effective and capable of detecting and delineating local features of interest [2].
Recent developments in the electrical exploration methods have resulted in a lot of contributions in providing accurate subsurface information. One of the most important is the increasingly widespread use of two-dimensional (2D) and threedimensional (3D) resistivity surveys [3-6]. The 2D surveys are the most practically economic compromise both in achieving accurate results and in limiting the survey cost [7].
Location and geology of the study area
The Ile-Ife seismographic station is situated also on the basement complex in the equatorial rain forest of southern part of Nigeria with latitude 07°32’ 49.06’’N and longitude 04° 32’ 50.34’’E. The main lithologies include amphibolites, migmatite gneisses, granites and pegmatites. Other important rock units are schists, made up of biotite schist, quartzite schist, talc-tremolite schist, and the muscovite schist. The crystalline rocks intruded into these schistose rocks [8]. The amphibolite and the hornblende gneiss are the mafic and intermediate rocks in southwestern Nigeria. In Ilesha and Ile-Ife areas these amphibolites occur as low-lying outcrops and most are seen in riverbeds while, the hornblende gneiss crops out at Igangan, Aiyetoro and Ifewara, along Ile-Ife road as low-lying hills in southwestern Nigeria. The hornblende gneiss is highly foliated, folded and faulted in places.
The magmatite-gnessic complex which constitutes over 75% of the surface area of the southwestern Nigerian basement complex is said to have evolved through 3 major geotectonic events:
A. Initiation of crust forming process during the Early Proterozoic (2000Ma) typified by the Ibadan (Southwestern Nigeria) grey gneisses considered by Woakes et al. [9] to have been derived directly from the mantle.
B. Emplacement of granites in Early Proterozoic (2000Ma) and
C. The Pan African events (450-750Ma).
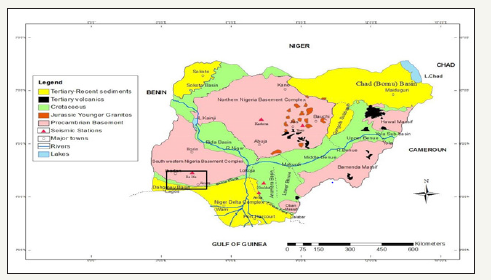
Figure 1:Geological Map of Nigeria showing the Ile-Ife station [15].

Rahaman & Ocan [10] on the basis of geological field mapping reported over ten evolutionary events within the basement complex with the emplacement of dolerite dykes as the youngest. On the basis of wide geochemical analyses and interpretation, tectonics studies, field mapping and plumb tectonics, Oyinloye [11] had suggested a modified sequence of evolutionary events in the Southwestern Nigeria [12] basement complex as detailed in Table 1. The study area is underlain by regional gray gneiss and mica schist, and a sequence of lateritic clay (aquitards), clayey sand/ sand, and weathered/fractured bedrock. The clayey sand/sand and weathered/fractured bedrock constitute the main aquifer, located within a bedrock depression that is the catchment area for the region. The relatively low-lying, gently undulating pediments are dissected by several river valleys (Figure 1).
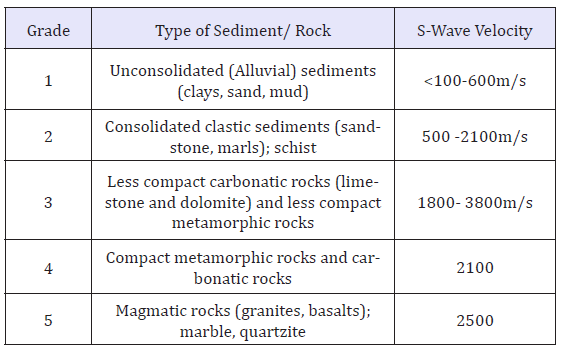
Table 1:Classification of different types of outcropping geological formations in “Quality” categories (according to R. Vidrih, personal communication 2001). Grade 5 is the best rock for seismic recordings and grade 1 is the worst.

Materials and Methods
Data acquisition and processing
To achieve a 2D electrical resistivity tomography of the study area, the ABEM SAS 1000 Terameter was used, choosing the dipoledipole array. The dipole-dipole array is very sensitive to horizontal changes in resistivity, but relatively insensitive to vertical changes in the resistivity [13]. Measurements were made along four profiles with each profile covering a total length of 164m. The choice of direction of the profiles was so as to cover the study area which has a dimension of 164 by 82m. The collected data resistivity was processed and inverted using the RES2DINV software developed by Loke & Barker [1]. The inversion technique used was the standard least-square smoothness constrain.
Generally, the programme automatically creates 2D model by dividing the subsurface into rectangular blocks [1] and the resistivity of the blocks was iteratively adjusted to reduce the difference between the measured and the calculated apparent resistivity values. The apparent resistivity values were calculated by the finite-difference method. The program calculates the apparent resistivity values and compares these to the measured data. During iteration, the modelled resistivity values will be adjusted until the calculated apparent resistivity values of the model agree with the actual measurements. The iteration is stopped when the inversion process converges (i.e., when the RMS error either falls to acceptable limits, usually less than 5% or when the change between RMS errors for consecutive iterations becomes infinitesimally small). Prior to data inversion, the apparent resistivity data set were inspected in accordance with the suggestion of Loke [14] for bad datum point and such points were deleted.
Interpretation of result
The results of the standard constrain inversion technique for the dipole-dipole array configuration for each profile is presented in Figure 2-5. R.M.S. errors of 2.5%, 2.3%, 2.8% and 3.6% were obtain. The top layer is composed of sand and laterite with resistivity values ranging between 194Ωm to 400Ωm having thicknesses ranging from about 1m to 3m from the surface, this layer extends along the profile from 5m to almost 80m. The second layer is composed of wet clayey sand/sand, with resistivity values ranging from 500Ωm- 600Ωm. The third layer which was encountered at depth ranging from 5m-12m, consist of highly weathered/ fractured basement with resistivity values ranging from 500Ωm-1200Ωm. The fourth layer consist of fresh bedrock that consists of mica schist to grey gneiss at a depth greater than 12m, with resistivity values of 500Ωm.
Figure 2:2D inversion of the dipole-dipole array data along profile 1.

Figure 3:2D inversion of the dipole-dipole array data along profile 2.

Figure 4:2D inversion of the dipole-dipole array data along profile 3.

Figure 5:2D inversion of the dipole-dipole array data along profile 4.

Profile 2 runs north-south of the study area, covering a distance of 82m. The top layer of this profile is occupied by earth materials interpreted as lateritic soil, with resistivity values ranging between 370Ωm to 750Ωm having thicknesses ranging from about 0m to 3m from the surface, this layer extends along the profile from 13m to almost 180m. This region is to be consolidated laterite, having high resistivity values greater than 800Ωm. Underneath this layer is a weathered basement rock which is highly fractured and exists with a depth of about 4m beneath 55m mark along the profile, with variable thicknesses to the depth of 7m. The resistivity of this layer ranges between 56Ωm to 370Ωm and can be interpreted as fine brownish gravels to medium sand and clay material.
Profile 3 runs north-south of the study area, at an inter-profile spacing of 20m from profile 2. The resistivity model showed low resistivity values (200Ωm-285Ωm) at a depth of 0-2.5m, with a lateral distance of 5-68m. Higher resistivity values (1000Ωm- 2000Ωm) are found at a depth range of 3.0-7.90m, covering a lateral distance of 5-60m. Lower resistivity range (200Ωm-250Ωm) is observed at depth of 8.0-11.5m, with a lateral distance of 20-55m.
Profile 4 runs west-east of the study area, with an inter-profile spacing of 20m from profile 1. Low resistivity values (100Ωm- 300Ωm) were observed at a depth range of 0-2.55m, with a lateral distance of 5-70m. Higher resistivity values (1000Ωm-2500Ωm) were observed at a depth range of 3.0-7.90m, covering a lateral distance of 5-65m. Lower resistivity range (130Ωm-230Ωm) was observed at a depth of 8.0-11.5 m, covering a lateral distance [15].
Discussion of Result
Specific knowledge of the geology of a seismic station site is extremely useful in order to accomplish the major goal of such station, which is recording quality data with less noise. The underground conditions at a station influence both the seismic signal and the noise conditions and thus have a significant bearing on the potential sensitivity of a seismic station. One may then infer a related map in terms of bedrock quality grades with respect to their suitability for the installation of seismic recording sites. Table 1 shows the classification of bedrock “Quality” grades. This was used as guide to infer the best sites for seismic station location based on the lithology of the area.
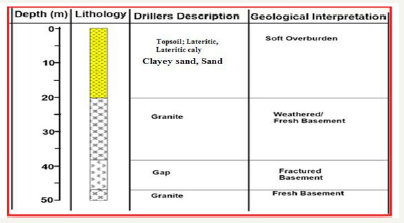
Figure 6:Lithological units for borehole log of the study area.

The topography in the vicinity of the seismic station has been considered. Extremely steep mountain slopes/deep valleys may unpredictably and unfavorably influence seismic waveforms and signal amplitudes. In addition, mountain peaks are much more susceptible to wind-generated seismic noise, lighting strikes and perhaps icing of the communications equipment. This investigation reveals a minimum of three and a maximum of four geo-electric sections. The corresponding lithological layers were obtained with borehole log (Figure 6) and standard resistivity values used as control. From all four stations, distinct layers were observed and varied in both depth and resistivity. The Ile-Ife station consist of the overburden (sand, laterite), weathered basement (clay sand/ sand) and the fractured basement (mica schist and grey gneiss). This lithology falls within grade 5 of the quality category, indicating it best rock for seismic recordings.
Conclusion
2D electrical resistivity tomography has provided a clear view of the lithological units and geo-electrical structure underlying the study area. The area is underlain by three layers of different lithological units. Also, no fault lines or fractured zones were observed in all profiles and as a result no geological structure was found to infer false results to the seismic station.
Acknowledgement
We thank the Center for Geodesy and Geodynamics, Toro for their aid and support. Many thanks are due to Prof. Kola Lawal, department of physics Ahmadu Bello University Zaria, for his aid, advice and interest.
References
- Loke MH, Barker RD (1996) Rapid least-squares inversion of apparent resistivity pseudo sections by a quasi-Newton method. Geophysical Prospect 44: 131-152.
- Kearey P, Brooks M (1988) An introductory to geophysical exploration, Blackwell Scientific Publications, Oxford, London, USA, pp. 171-199.
- Griffiths DH, Barker RD (1993) Two-dimensional resistivity imaging and modeling in areas of complex geology. Journal of Applied Geophysics 29(3-4): 211-212.
- Ritz M, Parisot JC, Diouf S, Beauvais A, Dione F (1999) Electrical imaging of lateritic weathering mantle over grain and metamorphic basement of eastern Senegal, West Africa. Journal of Applied Geophysics 41: 335-344.
- White RS, Collins S, Denne R, Hee R, Brown P (2001) A new survey design for 3D IP modelling at Copper hill. Exploration Geophysics 32(4): 152-155.
- Dahlin T, Bernstone C, Loke MH (2002) A 3D resistivity investigation contami-nated of a site at Lernacken in Sweden. Geophysics 60(6): 1682-1690.
- Dahlin T (1996) 2D Resistivity surveying for environmental and engineering applications. First Break 14(7): 275-283.
- Rahaman MA (1988) Recent advances in the study of the basement complex of Nigeria. Symposium on the Geology of Nigeria, Obafemi Awolowo University, Nigeria.
- Woakes M, Ajibade CA, Rahaman MA (1987) Some metallogenic features of the Nigerian Basement. Journal of Africa Science 6(5): 655-664.
- Rahaman MA, Ocan OO (1978) On relationship in the precambrian migmatitic gneisses of Nigeria. Journal of Mining and Geology 15(1): 23- 30.
- Oyinloye AO (2011) Beyond Petroleum Resources: Solid Minerals to the rescue: 31st Inaugural Lecture of the University of Ado-Ekiti, Nigeria Press, Nigeria, pp. 1-36.
- Burke KC, Freeth SJ, Grant NK (1976) The structure and sequence of geological events in the basement complex of Ibadan area Western Nigeria. Precamb Res 3(6): 537-545.
- Dahlin T, Loke MH (1997) Quasi-3D resistivity imaging-mapping of three-dimensional structures using two-dimensional DC resistivity techniques. Proceedings of the 3rd Meeting of the Environ Eng Geophy Soc, pp. 143-146.
- Loke MH (2002) Tutorial: 2-D and 3-D electrical imaging surveys.
- Akpan OU, Yakubu AY (2010) Earthquake Science 23: 289-294.
© 2019 Eshimiakhe Daniel. This is an open access article distributed under the terms of the Creative Commons Attribution License , which permits unrestricted use, distribution, and build upon your work non-commercially.
 a Creative Commons Attribution 4.0 International License. Based on a work at www.crimsonpublishers.com.
Best viewed in


.jpg)


 Editorial Board Registrations
 Submit your Article
 Refer a Friend
 Advertise With Us
.jpg)


.jpg)


.bmp)
.jpg)
.png)
.jpg)


.jpg)


.png)

.png)


.png)


