
- About Us
- Information
-

The Author ensures that the research has been conducted responsibly and ethically with adherence to all relevant regulations. read more..
- For Authors
- For Reviewer
- Manuscript Guidelines
- Membership
- Publication Ethics
-
- Journals
- Reprints
- e-Books
- Videos
- Policies
- Contact Us
 COVID-19
- Submissions


Full Text
Aspects in Mining & Mineral Science
High Effective TXRF Spectrometry with Waveguide-Resonance Devices Application
Egorov VK1*, Egorov EV1,2 and Loukianchenko EM3
1Imt Ras, Chernogolovka, Russia
2Moscow, Russia
3Spbgetu “Leti”, Russia
*Corresponding author: Egorov VK, Imt Ras, Chernogolovka, Moscow District, Russia
Submission: November 06, 2018;Published: December 13, 2018

ISSN 2578-0255Volume2 Issue4
Abstract
Characteristics of TXRF spectrometry specific features are presented. There are formulated characteristic demands to devices comprising the TXRF facility and to objects studied by the method. TXRF spectrometry peculiarity discussion showed that the radiation density of X-ray fluorescence exciting beam is its critical parameter. In response to this criterion the planar X-ray waveguide-resonator is the best former of X-ray beam with enhanced radiation density are presented. Obtained in the work data shows that the planar extended slit clearance formed by quartz reflectors is the planar X-ray waveguide-resonator for the MoK radiation flux when the slit clearance width is smaller 110nm. There are discussed peculiarities of this device with modified constructions oriented on the MoK radiation beams formation and its application for the TXRF measurement efficiency increasing. Original TXRF investigations in the PIXE conditions are described briefly.
Keywords: X-ray radiation source; X-ray flux; X-ray beam; Total external reflection; TXRF spectrometry; X-ray beam former; Planar X-ray waveguideresonator; PXWR, Planar extended slit clearance; X-ray standing wave; Interference field; Radiation capture angle; Partial angular tunneling; Spatial intensity distribution; Radiation gathering power; Skewed concentrator; Composite planar X-ray waveguide-resonator; CPXWR; PIXE spectrometry; Partical induced total X-ray fluorescence spectrometry.
Introduction
Experimental science experience of the last century brought out clearly that the X-ray radiation is the most commonly encountered and very effective mean for a material properties study. X-ray diffraction method is best suited to the structural features study of substance [1,2]. The material element composition and some peculiarities of the chemical bond are investigated by X-ray fluorescence analysis methods [3-6]. It is known, that the X-ray characteristical fluorescence can be excited by hard X-ray radiation, electron and ion beams. The spectrometrical method based on the X-ray fluorescence yield excitation by high energy ion beams was called the particle induced X-ray emission (PIXE). The method of X-ray fluorescence yield excitation by electron beams got name the electron-probe microanalysis. But XRF material diagnostics by X-ray beam excitation is the simplest, cheap and widely-distributed experimental procedure for the experimental practice. This procedure is carried out usually in 45°-45° geometry. Similar conventional geometry implies that the exiting radiation beam generated by Mo, Ag, Ru or W X-ray sources incidences on the studied target at an angle q=45° to the target surface, and the characteristical fluorescence yield is collected at the same angle to the surface and at an angle y=90° to the incident beam direction. The X-ray fluorescence yield collection is carried out by PIN or SDD silicon detectors. Similar X-ray spectrometry variety has named the method of energy-dispersive analysis. The method collects X-ray fluorescence spectra in the wide energy range allowing to registrant the X-ray fluorescence yield for almost all elements existed in the nature. The method is not effective for the light element’s diagnostics owing to a strong absorption of X-ray low energy radiation in the detector window material. The energy resolution method is defined by detector characteristics and usually near 125eV. The resolution improving can be achieved by different procedure application of the X-ray fluorescence spectra registration. It is XRF with the wavelength dispersion. The XRF wavelength dispersive spectrometry allows to decrease the spectrum energy resolution more than one order by the X-ray flux diffraction effect use. The method is oriented on the separate lines registration and characterized by low radiation gathering power.
In spite of its merits XRF spectrometry in conditions of an any type excitation application is characterized by some specific problems and cannot be considered as the quantitative analytical procedure. The first problem is connected with the mutual influence of X-ray characteristical lines excited by an internal impact, which has named the matrix effect. This effect can be compensated partly by correcting introduction on the atomic number (Z), on the radiation absorption (A) and on the second fluorescence (F) by the ZAV correction conception use. In addition to matrix problem there is a need to take into account the fluorescence yields effective depth for different fluorescence lines typical for the material. For example, CaF2 monocrystal excitation will be accompanied by yield of CaKab fluorescence lines with the effective depth 2.5mm and by yield of FKab lines with the effective depth 0.15mm, only. The spectrum background is the addition factor defining the procedure analytical quality. It is known that the background deposit in X-ray fluorescence spectrum is directly proportional to the thickness of target exciting layer [7,8]. On base of this conception Yoneda & Horiuchi [9] suggested to decrease the background deposit in the collected spectrum by the incidence angle decreasing of X-ray exciting beam up to magnitudes of its total external reflection values [1]. Figure 1 shows X-ray fluorescence yield spectra of the solution dry residue contained Ca, Fe, Co, Zn, Zr atoms collected by use the XRF conventional geometry (a) and in conditions of TXRF measurements (b). Thickness of the solution dry residue film was near 100nm. Spectra were registered at the same regime of BSW-24 (Mo) X-ray source function (U=25keV, I=10mA). TXRF spectrum of the sample is distinguished by the background deposit insignificant value and X-ray characteristical fluorescence lines high intensity magnitudes for atoms of the dry residue film. Moreover, TXRF spectrum of the sample is characterized by a deposit decreasing of the exciting beam parasite scattering intensity. Very high efficiency of the thin film coating TXRF study is presented by Figure 2. There are XRF and TXRF spectra of the Au film with thickness 9nm deposited on Si substrate. RBS spectrum presented on the insertion shows that the film is free from the island effect. The RBS spectrum of Au/Si target was collected by use the ion beam analytical complex Sokol-3 functioned in IMT RAS [10]. On base of the direct observation it is apparent that the TXRF spectrum is more informative in comparison with the XRF spectrum because it allows to identify of Ga, Se and Zr atoms presence in the film. SiKa line belongs to the fluorescence yield of substrate atoms. Similar material investigations executed in different laboratories in the wake of Japan scientists give grounds to claim that the X-ray fluorescence analysis at exciting beam total external reflection on the studied surface is today the more effective method for element diagnostic of the material surface layer.
Figure 1: Patterns of X-ray fluorescence yield for the liquid dry residue contained Ca, Fe, Co, Zn and Zr atoms collected in the conventional X-ray fluorescence measurement geometry (a) and used the sliding excited beam incidence (b) with BSW-24 (Mo) radiation source in regime U=25keV, I=10mA, measurement time 300sec. Energy step 26eV/channel.

Specific character and peculiarities of TXRF material diagnostics
In result of a great experimental activity of prof. Klockenkamper R [11], H Aiginger [12], P Wobrauschek [13], A Von Bohlen [14], C Strely [15] and the TXRF spectrometry turned into the conventional method of trace element analysis of solid surfaces and dry residue of liquids deposited on specially prepared carries. Further methodological development of X-ray fluorescence analysis in the total external reflection conditions led to the specific modification of an element’s diagnostics [16]. Methodological realism and appearing of new experimental procedures brought about the necessity to improve and widen the fundamental monograph of prof. R. Klockenkamper [11] by additional data [17].
X-ray optical scheme of TXRF spectrometer built on base of the conventional conception is presented on Figure 3. It contains the X-ray radiation source, unit for the X-ray beam formation, system for the X-ray fluorescence yield registration and minigoniometer for the studied target orientation near an exciting beam. X-ray tubes with Mo, Ag, Rh and W anodes are usually used as X-ray radiation sources for TXRF measurements. Critical angles of the total external reflection featured for these radiation beams interaction with the material surface is very small. This angle for MoKa total external reflection on the quartz surface is equal to 0.1 degree. So, TXRF measurements demand high precision of the studied target spatial positioning. The exciting beam must be prepared in the filament form with minimization of its width and angular divergence. The total external reflection phenomenon imposes some limitations on the studied target surface quality. The surface must characterize by a very small waviness and roughness. This demand is connected with the exciting beam incidence angles trifle and, as the result, with very small value of the penetration depth parameter in conditions of the beam total reflection. Dependence of this parameter on the incidence angle value q, presented on Figure 4a can be described by the next analytical form [18]:
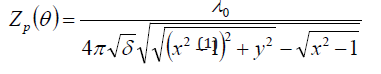
Figure 2: Patterns of X-ray fluorescence yield for Au (9nm)/Si film sample collected in the conventional X-ray fluorescence measurement geometry (a) and used the sliding exciting beam incidence (b). Measurements were carried out with BSW-24 (Mo) radiation source in regime U=25keV, I=10mA, measurement time 300sec. Energy step 20eV/channel. RBS spectrum of the sample is shown on insertion. Energy step 1.9keV/channel.

Figure 3: Schematic design of TXRF spectrometer built on base of the conventional X-ray optics setup.

Where l0 is the mean wavelength of exciting beam, x=q/qc, y=b/d, where qc is the total reflection critical angle, d and b parameters are the polarization and the absorption factors in conventional expression for the material refraction coefficient [19]:

The penetration depth function characterizes inward distance from the studied target surface corresponding to the exciting beam intensity decreasing on “e” times. At the same time, experimental investigations show that the real thickness of target surface layer being responsible for the X-ray fluorescence yield formation exceeds the penetration depth magnitude on 2 or 3 times, usually. This discrepancy depends on the exciting beam incidence angle and the studied material atomic density [20,21]. The function outlines of X-ray characteristical fluorescence yield on the incidence angle magnitude is akin to Z(q) one in the total reflection angular area (Figure 4b). Beyond this range the X-ray fluorescence yield is described by the expression characteristics for XRF conventional spectrometry [22,23]:
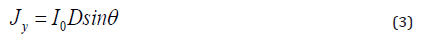
Figure 4: Depth penetration function of Mo radiation flux (a) and SiK fluorescence yield intensity on the flux incident angle for the quartz polished surface.

Where I0 is the exciting beam intensity, D is the factor defined by material properties, q is the exciting beam incidence angle. The comparison analysis of XRF and TXRF fluorescence yield shows that the total reflection area is characterized by a less value of its integral intensity. But the spectral acutance of TXRF measurements is a higher owing to decreasing of a material volume excited by the initial X-ray beam. In the result, TXRF analysis is characterized by the background deposit decreasing in registered fluorescence spectrum and by the abrupt reduction of element detection limits. But the greatest significance of TXRF measurements is connected with absence of the matrix effect influence–the effect of mutual influence of X-ray fluorescence lines on its yield intensities. Moreover, lines intensities in the TXRF spectrum is connected with atomic concentrations in the exciting material layer by the linear dependence, and the fluorescence yield does not depend on an absorption factor. So, the TXRF spectrometry of solid materials can be treated in distinction to XRF measurements as the quantitative analytical method inasmuch as the host atoms quantity in the sample exciting volume can be evaluated from structural considerations, lightly. Host atoms in similar investigations will play a role of the internal standard. Similar approach can be used for the quantitative element analysis of liquid dry residues by metered addition into the initial solution of definite atoms. But direct comparison of the characteristical lines intensity is true only at taking into account the radiation absorption by the X-ray detector window and cross-section values of the atom’s fluorescence excitation. Figure 5 presents functions of the X-ray efficiency registration by Si SDD detector on energy of X-ray quants in conditions of the different input windows application for energy range 0.2-5keV [24]. Consideration of these data is very important for the light element diagnostics. At the work with high energy executed fluorescence yield (E>10keV) it is a need to introduce a correction on the detector efficiency registration (see insertion on Figure 5).
Figure 5: Functions of X-ray radiation registration efficiency of X-ray silicon drift detector (SDD) equipped by different input windows in the energy area 0-5keV are shown. There functions for the high energy radiation registration are presented on insertion [24].

Figure 6: Cross-section energy dependences of K and L different element lines excitation by the MoK radiation beam.

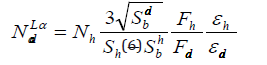
Figure 6 shows the experimental dependences for characteristical fluorescence excitation cross-sections of Ka and La different elements lines by the MoKab radiation beam application. Experimental data were carried out by use of BSW-24 (Mo) radiation source in regime U=25keV, I=20mA. Cross-section excitation magnitudes is very sensitive to the radiation source regime. So, the quantitative investigation must be executed after the specific excitation cross-section measurement for lines observed in the TXRF spectrum. Taking into account the data about lines excitation cross-section, its factor absorption in the detector window material and the host atom quantity Nh in the exciting volume one can define an admixture concentration Nad by the expression [25]:
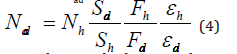
Where Sh and Sad are host and admixture lines intensity yield minus the background ones, Fh and Fad–the atoms lines excitation cross-sections, eh and ead–the atoms lines detector registration efficiencies. The minimum admixture atoms content of any experimental measurements is regulated by the detection limits parameter defined by the conventional expression [3]:
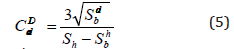
Where Sbad and Sbh are background intensities in the line positions of host and admixture atoms. In conditions of TXRF spectrometry the expressions (5) must be normalized on the host element concentration [25,26]:
TXRF investigations of monocrystalline objects and epitaxial structures must take into account a possible of the fluorescence spectrum additional lines appearing connected with the diffraction phenomenon with intensities being commensurable with ones of X-ray fluorescence lines. Moreover, its intensities can be changed at the condition’s measurements variation. These peaks migration and its intensity changing at the experimental condition’s variation are beautifully illustrated by Figure 7. Azimuthal angle variation at the TXRF testing of Si [111] monocrystalline target leads to very strong variation of the registered spectrum. Areas of the structural reflections appearing are presented on the top side of the Figure. Absence of Kb and Lbg lines is the fundamental criterion for rejection of structural reflections from the TXRF spectrum. In addition to the structural reflections and SiKa line emitted by host atoms these TXRF spectra contain CaKa, FeKa and ArKa fluorescence lines. Calcium and iron lines characterize a pollution existence on the silicon wafer surface. ArKa line presence in the spectrum reflects the fact that these investigations were executed without vacuum processing.
Figure 7: TXRF spectra collected for four positions of the silicon wafer with [111] surface orientation at different azimuth angles (=0, 20, 40, 60). Expected area of the structural reflections appearing are shown on top part of figure.

TXRF analytical method being similar to other experimental procedures is characterized by its own critical parameter. Total external reflection conditions of an exciting beam on the planar target with great surface area demand to form the beam in filament form with minimization of its width and angular divergence. Thickness of the target excited layer is limited by the penetration depth parameter. So, there is the geometrical limitation for interaction of the exciting beam with the target surface for any incident angle of the beam. In the result of this limitation, the efficiency of TXRF measurements may be improved by the beam radiation density increasing, only. And it provides strong evidence that the critical parameter of TXRF spectrometry is the radiation density factor of exciting beam emitted by the X-ray radiation former system. The radiation density factor increasing can be achieved either by a primitive augmentation of X-ray source power up to the synchrotron facility application or by the elaboration of specific X-ray beam formers being capable of the X-ray beam radiation concentration increasing [27]. This feature is typical for the planar X-ray waveguide-resonator (PXWR), and there is good reason to believe that the TXRF spectrometry further development will be oriented on the application of these devices and its parameters modification [28].
MoKαβ radiation beam formation by PXWR
The waveguide-resonance propagation conception of X-ray fluxes was suggested by VK Egorov & EV Egorov [29] owing to impossibility to find a suitable explanation for peculiarities of the flux stream through the super narrow extended silt clearance on based of the flux direct propagation and the multiple external total reflection mechanisms superposition [30-32]. Foundation of this conception is the phenomenon of X-ray standing wave uniform interference field appearing in all air space of the slit clearance formed by planar dielectric reflectors in conditions of X-ray quasimonochromatic flux propagation. It is well known that the X-ray polycapillary optics functions on base of the X-ray flux multiple total external reflection mechanism [33]. Every act of the X-ray quasimonochromatic flux total reflection on planar material surfaces initiates the local interference field of X-ray standing wave appearing owing to the interaction between incident and reflected fluxes. This field arises in an air space under the material interface [34] and penetrates into the material volume with exponential attenuation [35]. And it is very important to understand that the interference field area in the air space is limited but in the material volume its propagation is not bounded. Figure 8 allows to visualize the principle difference between the multiple total reflection mechanism and the mechanism of X-ray flux waveguide-resonance propagation. The multiple total reflection mechanism is featured by the discrete mode structure [36,37]. This mechanism provokes ability of the planar wide-slit clearance to transport of X-ray quasimonochromatic fluxes falling on its inlet under some fixed angles, only. It is physically clearly that variation of the falling flux angle leads to appearing of the specific angular directions set when consecutive reflections will be phasing. Every consecutive reflection is characterized by the local interference field of X-ray standing wave in air space of the wide-slit clearance. But in addition to this, every reflection act forms the damped interference field of X-ray standing wave in total volumes of the reflector’s material. And it is clear, that over excitation of the interference field in the material volumes is not demanded when we have the phasing of consecutive reflections. In result of this, the X-ray quasimonochromatic flux, which falls on the wide-slit clearance inlet under the magic angles, will undergo small attenuation. At the same time, any deflections from the magic directions leads to loss of the phasing and to great flux attenuation owing to essential beam energy expense on the recurring excitation.
Figure 8: Vizualizating schemes of X-ray quasimonochromatic flux transportation by the planar extended slit clearance accordingly to the multiple total reflection mechanism (a) and to the waveguide-resonance propagation (b). P is the size of X-ray standing wave interference field protrusion from the slit clearance.

Local area size evaluation of the X-ray standing wave interference field presents the specific interest. From optical investigations it is known that the area longitudinal size is defined by half of the radiation coherence length parameter (L) [38]:
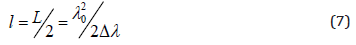
Where l0 is the radiation mean wavelength, Dl is the radiation monochromatization degree. Transverse size of the area is defined by the experimental conditions specificity [39]. At the total external reflection of X-ray quasimonochromatic flux on the material interface the interference field area transverse size is approximately equal to the longitudinal length [40]. The standing wave period (D) in the air local area is defined by the expression [34]:
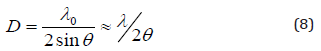
Where q is the flux incidence angle? The waveguide-resonance propagation mechanism is characterized by arising of the X-ray standing wave uniform interference field in all air slit space, and the similar field with damped amplitude will appear in the material of reflectors. In this case, any variation of the flux falling angle on the slit clearance input does not lead to the interference field reshaping. These variations provoke the standing wave period change, only. By this means the X-ray planar narrow extended slit clearance is able to transport of quasimonochromatic radiation fluxes falling on the device inlet under any angles, which are smaller as the critical angle of total external reflection for the reflector’s material. In the result, we can establish that the waveguide-resonance regime of X-ray flux propagation through the planar narrow extended slit clearance is characterized by the continuous mode structure.
Our experimental investigations of the CuKab radiation beam intensity dependence on the width of planar extended slit clearance formed by quartz reflectors showed that the nature allows to realize the waveguide-resonance mechanism for the X-ray quasimonochromatic flux propagation in Nano size range of the slit clearance width [41,42]. Peculiarities of CuKab radiation fluxes generated by standard X-ray tubes are well known [43]. Comparison of the experimental data and the model conception allowed to conclude that the planar extended slit clearance prepared by quartz reflectors works for the CuKab radiation as the waveguide-resonator at the slit width range 0-220nm. Our further investigations showed that the waveguide-resonance regime can be realized by the reflectors use prepared from monocrystalline materials and materials with amorphous structure. The polycrystalline structure of the reflector material cannot support the waveguide-resonance regime for X-ray quasimonochromatic flux propagation because of the interference field of X-ray standing wave losses of its uniformity. Very interesting investigations supported our inferences was carried out by Japan scientists [44]. This work was devoted to transport properties study of the angular structure shown on Figure 9. This facility was designed for investigation of the MoKa flux intensity dependence on magnitude of the taper angle between two Si monocrystalline reflectors. Experimental results demonstrated by the Figure is characterized by the diffuse extremum near the value q»0.1° and the second extremum near q»0.007°. First extremum corresponds to reaching of the total external reflection critical angle for MoKa radiation on Si surface. Second extremum cannot be explained without the waveguide-resonance idea attraction. The growth of X-ray radiation transport efficiency connected with this maximum reflects the transformation effect from the multiple total reflection propagation featured for great angular magnitudes to the mechanism of waveguide-resonance flux stream. The emergent beam intensity increasing characteristic for this angular range connects with the reduction of X-ray flux attenuation featured for the waveguide-resonance propagation mechanism. The intensity of the second extremum is half of the first one. At the same time, the width of X-ray beam corresponding to the second maximum is smaller more than one order. As the result, the X-ray beam formed in conditions of small angles between reflectors will be characterized by enhanced value of the radiation density.
Figure 9: The experimental scheme for the MoK radiation transportation efficiency study by the specific angular structure use (a) and the diagram of the structure emergent beam intensity dependence on the taper angle magnitude [41].

In addition to our investigations of the CuKab radiation flux transportation by planar extended slit clearance in conditions of its width variation and for the speculation’s exclusion of the angular experiments interpretation we carried out the systematic investigations of the MoKab radiation beam intensity dependence on width of the extended slit clearance formed by quartz reflectors in the wide range of its variation. These investigations were executed by use of HZG-4 goniometer fabricated by Carl Zeiss Jena firm. The construction of X-ray extended slit clearance used for our investigations is presented on Figure 10. It’s use allowed to study the spatial intensity distribution and to fix the integral intensity of MoKab radiation beams formed by the slit clearance in wide range of width magnitudes. All measurements were executed by use of BSW-24 (Mo) X-ray source in regime U=25keV, I=10mA. MoKab line in the emergent energy spectrum was selected by SCA-550-Ortec single channel analyzer. The X-ray white deposit in the collected intensity did not exceed 5 per cents.
Figure 10: Scheme of X-ray initial flux capture area and the emergent beam formation by the planar extended slit clearance formed by two quartz reflectors (a) and real construction of the device for study of the spatial intensity distribution dependence in X-ray beams on the slit clearance width. 1-Aligning handles; 2-installation plate; 3-spring pawls; 4-fine tuning screws; 5-radiation guide holder; 6-quartz reflectors with length 100mm; h and s-height and width of slit clearance.

Figure 11: Experimental scheme for the spatial intensity distribution study of MoK radiation beam formed by device showed on Figure 10 in conditions of the slit clearance width variation (a) and diagrams of MoK intensity distributions registered by the experimental setup (b). Data received at work of BSW-24 (Mo) X-ray source U=25keV, I=10mA. Attenuation factor of A filter K=700.

Figure 11 shows the experimental scheme for study of MoKab radiation flux parameters by application of the X-ray guide device presented on Figure 10 and spatial intensity distributions collected in conditions of the clearance width variation. Unlike analogical data obtained for the CuKab radiation beam propagation through the planar extended slit clearance the spatial intensity distributions for MoKab beams formed by the slit clearance device do not demonstrate noticeable changes at the slit width variation [27]. Experimental data show that the MoKab beam spatial intensity distribution envelopes are close to Gauss outline. At the same time, the results comparison obtained for CuKab and MoKab radiation beams engaged out attention to absence of the distribution parameters variation for the nanosize area of slit clearance width up to the slitless collimator application. Moreover, the integral intensity of MoKab radiation beams formed by the slit clearance device in the width magnitude range 0-110nm remained the same. This result is beautifully illustrated by Figure 12. It presents total experimental results about the integral intensity dependence of MoKab radiation beam on the slit clearance width magnitude. This experimental dependence can be presented by three typical intervals: S£110nm (a), 110£S£3000nm (b) and S³3mm (c). For the experimental data interpretation, it is a need to remember that the coherence length dimension of MoKab radiation is equal to L=220nm. Similar to the experimental data interpretation obtained for the CuKab radiation it may be concluded that the first size interval permits the waveguide-resonance propagation of the MoKab radiation beam. Third size interval is characterized by the multiple total reflection mechanism of the molybdenum characteristical radiation beam. The second size interval is connected with the change of X-ray beam propagation mechanism. The slit clearance structure corresponding to the first size interval was designated as the planar X-ray waveguide-resonator (PXWR) [42]. The radiation density parameter of X-ray beams formed PXWR structures is considerable interest to X-ray users, particularly in the light of PXWR possible application for the TXRF spectrometry.
Figure 12: Experimental dependence of the MoK radiation flux total intensity on the slit clearance width formed by device built on scheme showed on Figure 10. First dimension interval can be interpretated as answering to the waveguide-resonance mechanism of MoK flux propagation.

Figure 13 shows the experimental dependence of the radiation density parameter of MoKab radiation beams formed by the slit clearance device (a) and the double slit-cut system (b) on the slits width magnitude. Comparison of these dependences shows that the beam radiation density formed by the slit clearance device is higher in comparison with one after characteristics for the slit-cut system. The experimental values presented on the Figure are correspondent to position near the outlet of these beam formers. The radiation density parameter magnitude of MoKab radiation beam formed by the waveguide-resonance unit is approximately 10000 times higher than expected one in the X-ray beam formed by the conventional slit-cut system. So, the waveguide-resonance formers including of X-ray exciting beams into the TXRF X-ray optical schemes is quite reasonability. Its application allows to expect the detection limit decreasing of admixture elements on one- two orders. Moreover, it is known that the formation of X-ray filament beam with nanosized width by slit-cut or shield systems is not easily soluble task. X-ray filament beams application with a micrometric width for the TXRF analysis leads to increasing of the background deposit in collected spectra owing to the beam stray scattering exciting. This factor will be minimized in case of the waveguide-resonance former application. Because of this, there is good reason to believe that the waveguide-resonance structures including into the TXRF spectrometer facility will lead to considerable enhancement of the method analytical characteristics.
Figure 13: Experimental dependence of the MoK flux radiation density on the slit clearance width for emergent beam formed by device showed on Figure 10 (a) and similar dependence for X-ray beam formed by double slit-cut system.

TXRF spectrometry with PXWR application
Figure 14: Experimental dependences of the MoK beams radiation density formed by PXWR simplest design () and double slit-cut system () on distance from output cuts of these formers. Measurements geometries are presented on insertion.

In the previous section we discussed fundamental features of PXWR with the simplest construction. Such structure is built on base of two polished quartz reflectors with equivalent lengths and an identical form of its butt ends. PXWR with the simplest structure possesses by series of useful practical properties [45]. It captures the X-ray flux generated by radiation source into its inlet in the angular range, which cannot exceed double magnitude of the total external reflection critical angle for the reflector’s material. The PXWR transports X-ray flux by its planar slit clearance almost without attenuation and forms the filament emergent beam. The emergent beam is characterized by very high radiation density and has nanosized width. But the beam losses it’s phenomenal advantages already on small distances (d~3-5cm) from the PXWR output owing to the beam angular divergence existence. Figure 14 shows dependences of the radiation density diminution in MoKab radiation beams formed by PXWR with the simplest design and the double slit-cut system on distance from the formers outlet. Analysis of these dependences allows to affirm that application of the waveguide-resonance former with simplest design for TXRF spectrometry losses the practical sense when the distance between it’s outlet and the studied sample position will be large 50mm. So, it is clear, that the PXWR device including into TXRF facility will increase the method analytical efficiency either in case of the exciting beam divergence decreasing or by principle reorganization of the X-ray optical spectrometric scheme.
Figure 15: Alternative X-ray optical scheme of TXRF measurements, which insures the radiation density maximum of exciting flux on studied sample by its direct introduction into the interference field of X-ray standing wave initiated by the exciting flux.

Figure 15 presents the principle pattern of the similar X-ray optical scheme being capable for the TXRF measurement efficiency increasing. This scheme provides the direct introduction of studied sample into the planar slit clearance of waveguide-resonance structure. For similar procedure execution the waveguide-resonance structure is completed by quartz reflectors with holes for the sample and for the X-ray fluorescence yield leading out. This X-ray optical scheme allows to achieve maximum of the exciting beam radiation density on the studied surface. Moreover, this measurement scheme allows to decrease the parasite scattering yield especially in case of the helium atmosphere introduction into the PXWR slit clearance. TXRF experimental investigations carried out with use of the measurement cell built on base of the modified X-ray optical scheme showed very beautiful results [46,47]. The idea of studied sample introduction into the X-ray standing wave interference field space of PXWR structure is the breakthrough step in TXRF spectrometry development. But the efficiency further growth of this diagnostical method is connected with the upgrading of its own waveguide-resonance structure.
One approach to the waveguide-resonance structure upgrading is search of ways for the efficiency increasing of PXWR input radiation capture without the emergent beam parameters worsening. This approach can be realized on base of two technological solutions presented on Figure 16. According to the first proposal the waveguide-resonance structure is equipped by the input skewed radiation concentrator with capture angle, which can not exceed double value of the total external refraction critical angle for the reflectors material [48]. Length and surface form of the skewed concentrator is the subject of the specific investigation. For the formation of MoKab radiation beam by the modified waveguide-resonance device the skewed concentrator angle must not exceed the magnitude 0.2 degree. For experimental realization of the approach we elaborated PXWR with the skewed concentrator for the MoKab radiation capture with length l3=30mm at the total slit clearance length lp=100mm and with the width s=80nm. Figure 17 presents measurements schemes for study of the spatial intensity distribution in MoKab radiation beams formed by the PXWR with simplest design and by the waveguide-resonator equipped by skewed concentrator. Application of the modified waveguide-resonator did not lead to change of the radiation intensity distribution envelope. But the integral intensity of emergent beam increased on approximately five times. It is obvious that the efficiency of waveguide-resonance device application will be higher at suitable selection of the skewed concentrator length and it’s surface form.
Figure 16: Principle schemes of X-ray waveguide-resonance structures allowing to increase the radiation capture value by application of the input skewed concentrator (a), and by deposition of the gradient film coating on quartz reflectors surfaces (b). Coatings must supply high structural density on PXWR input and low structural density on its output.

Figure 17: Experimental schemes for the spatial intensity distribution study in MoK radiation fluxes formed by PXWR with simplest design (a) and waveguide-resonator equipped by skewed radiation concentrator (b), and real intensity distributions collected with these devices application.

Second scheme presented on Figure 17 is an equally interesting and perspective. Fundamental essence of the scheme lies in the fact that the inlet material of waveguide-resonance structure is characterized by high atomic density and this parameter is more small for the material of it’s outlet. It’s idea, in example, can be embodied into reality by deposition of the gradient density thin films on surface of the quartz reflectors forming PXWR. In our experimental investigations we have chosen HfxTix-1O2 multielement solid solution as the deposited material. It is suggested that the films element composition on the quartz reflectors ends corresponding to the PXWR inlet positions will be characterized by HfO2 (r=9.7g/cm3) elements stoichiometry and on the other end- by TiO2 (r=3.8g/cm3) one. Elements concentration along the reflector’s length must change from HfO2 to TiO2 monotonously. It was expected that the waveguide-resonator equipped by the slit clearance gradient structure can increase the emergent beam integral intensity on three times. But these expectations were destroyed because the solid solution structure of deposited films demonstrated the polycrystalline construction and similar slit clearances does not support the waveguide-resonance propagation of MoKab radiation flux.
Figure 18: Experimental scheme of the MoK radiation fluxes formation by PXWR with simplest design (a) and by the waveguide-resonator built on base of nonequivalent length quartz reflectors (b) and real intensity distributions collected with use of these devices. Measurements were carried out with BSW-24 (Mo) radiation source in regime U=25keV, I=10mA. Absorption factor of A-attenuator K=700.

Aside from search of waveguide-resonance constructions oriented on the emergent beam integral intensity increasing it was a need to solve task of the emergent beam angular divergence reduction at the retention of its integral intensity. This task can be solved by application of two simple schemes of the waveguide-resonance structure completing. Simplest solution of the problem can be achieved by the nonequivalent length reflectors use for PXWR building. Similar construction suggests that the one half of X-ray flux composing the PXWR emergent beam undergoes total external reflection on the ledge of lond reflector and increases the second half. (Because of first and second fluxes are coherent the reflection conditions must be selected specially.) The experimental scheme for study of the spatial intensity distribution in MoKab radiation beam formed by the PXWR simplest design and one built on base of nonequivalent length reflectors and collected diagrams of the intensity distribution are presented on Figure 18. The spatial intensity diagram of the beam formed by modified unit shows that the emergent beam angular divergence was halved at the integral intensity conservation. But the spatial distribution form changes from the Gauss outline characteristic for beams formed by the simplest PXWR to the half Gauss one. Similar outline form variation is not principle for the X-ray fluorescence analysis but is very negative for X-ray diffractometrical measurements. The TXRF spectrometry with application of waveguide-resonance structures built on base of nonequivalent length reflectors shows evident efficiency. Figure 19 presents experimental schemes for TXRF measurements with simplest and modified PXWRs application and X-ray fluorescence spectra of the high temperature superconducting film on the strontium titanate monocrystalline substrate collected with its application. The TXRF spectra comparison shows that the modified PXWR application leads to enhancing of the method efficiency.
Figure 19: Experimental schemes for TXRF comparative investigations of Ba1.4Y1.0Cu2.4O7.0 epitaxially film on SrTiO3 monocrystal substrate by application of PXWR with simplest design (a) and the waveguide-resonator built on base of nonequivalent length reflectors for the MoK exciting beam formation. Measurements were carried out with BSW-24 (Mo) radiation source U=25keV, I=10mA. Incidence angle of the beams were equal zero. Energy step 20eV/channel.

Another our design godsend allowing to reduce the PXWR emergent beam angular divergence without changing of its integral intensity is the composite planar X-ray waveguide-resonator (CPXWR) [49]. The classical scheme of the composite waveguide-resonator involves two simplest PXWRs, which are installed the one after another and characterized by the mutual alignment. But it is not enough for the CPXWR function. Our investigations showed that the distance magnitude between two simplest PXWRs has the principle significance for correct work of the device. When the distance is large of some critical value Lp the double PXWR structure forms emergent beam with very small angular divergence and very small integral intensity. Such device cannot call the composite planar X-ray waveguide-resonator. At the same time, when the distance between the simplest PXWRs will be smaller of the Lp critical magnitude defined by the expression [49]:
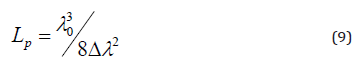
the emergent beam parameters change, cardinally. At the distance between PXWRs being not exceeded the critical parameter magnitude the integral intensity of the device emergent beam will be correlated with X-ray radiation intensity of the captured flux. Moreover, our investigations showed that in this case the angular divergence of formed X-ray beam is smaller in comparison with the radiation capture angle, and the emergent beam angular divergence magnitude depends on value of the distance between PXWRs. The analytical connection between the distance magnitude and the degree of emergent beam angular divergence decreasing remain to be received. Chief problems of these experimental investigation are connected with the ambiguity influence of form and treatment quality of reflectors ends on the emergent beam parameters. The investigations data allowed to understand that the effect of emergent beam angular divergence reduction is the result of partial angular tunneling phenomenon of X-ray flux in the gap between PXWRs installed the one after another. The phenomenon of X-ray flux partial angular tunneling is consequence of the X-ray standing waves interference fields interaction initiated in the slit clearances of PXWRs composed the composite waveguide-resonator. The gap critical size between PXWRs is defined by the dimension of X-ray standing waves interference field protrusion (P) (Figure 8a & 8b). When the interference field protruded from the slit clearance of first PXWR achieves of the second PXWR slit clearance the effect of the interference fields interaction arises. This effect leads to the capture of all radiation flux abandoning first PXWR by the clearance slit of second PXWR. In the result, CPXWR generates X-ray emergent beam with the angular divergence diminution value and the invariable integral intensity. At the same time, accordingly to the Liouville theorem the variation of statistical ensemble some parameter must arouse of other parameters one [50]. Our precise measurement showed that the X-ray beam angular divergence decreasing is accompanied by the radiation monochromatization degree deterioration of CPXWR emergent beam [51]. The model of composite waveguide-resonator function allowed to establish the connection between factor of the monochromatization degree deterioration dl and parameter of the CPXWR emergent beam angular divergence decreasing Dj by the next expression:

Where j1 is the input capture angle of CPXWR. In the result, the emergent beam will be characterized by j2=j1-Dj angular divergence and it’s monochromatism degree will be defined by the expression Dl2=Dl0+dl. The factor of emergent beam radiation monochromatism decreasing is not principle for TXRF measurements, but it is not useful for X-ray diffractometry. Results of the CPXWR application for TXRF spectrometry are presented on Figure 20. In this measurement we used of the composite waveguide-resonator with modified design. The Figure shows experimental schemes for study of the spatial intensity distribution in MoKab radiation beams formed by the simplest PXWR and by the composite waveguide-resonator with original design and distributions diagrams collected by the schemes application. Emergent beams formed by PXWR and CPXWR are characterized by approximately equal intensities but they have different angular divergences and, consequently, different radiation densities. One can be expected that the composite waveguide-resonator insertion into the conventional type TXRF facility can improved the measurement analytical efficiency. Figure 21 shows justice of this expectation. There is presented TXRF spectra of the Ti2Zn film coating on Si substrate excited by the MoKab radiation beams use formed by the double slit-cut system and the CPXWR original design. On base of the spectra comparison one can conclude that the composite waveguide-resonator application allows to improve the TXRF analysis efficiency more than one order. It is necessary to notice that the SiKa line initiated by the substrate material has more high intensity in the spectrum collected at the CPXWR application. Moreover, TXRF spectra presented on the Figure demonstrates the visible distinction for I(TiKa)/I(ZnKa) relations calculated from the spectra. Rutherford backscattering study of the sample allowed to define the film thickness (t=20nm) and the depth element concentration profile for it. RBS data provide the enough reason to interpretative the spectra intensity distinction as the result of elements concentration variation on the film thickness. Ti2Zn stochiometry reflects the average film composition, but the film surface layer is characterized by the titanium excess concentration. In the result, one can conclude that the radiation density magnification leads to increasing of the surface layer thickness defining the X-ray characteristical fluorescence yield. This effect will be absent for homogeneous samples.
Figure 20: Experimental schemes of MoK radiation flux formation by PXWR with simplest design (a) and by the composite waveguide-resonator of original construction (b) and real intensity distributions, collected with use of these devices. Measurements were carried out with BSW-24 (Mo) radiation source in regime U=25keV, I=10mA. Absorption factor of A-attenuator K=700.

Figure 21: Experimental schemes for TXRF comparative investigations of Ti2Zn film on silicon substrate collected in conditions of the MoK exciting beam formation by double slit-cut system (a) and the composite waveguide-resonator of original construction (b) and spectra of X-ray characteristic fluorescence yield excited by these fluxes. Measurements were carried out with BSW-24 (Mo) radiation source in regime U=25keV, I=10mA. Incidence angle of the beams were equal zero. Energy step 20eV/channel.

Waveguide-resonator modification by the skewed radiation concentrators application and the constructions elaboration oriented on the emergent beam angular divergence decreasing are directed to the magnification of its radiation density. So, these elaborations were used for the TXRF cell further modification. Figure 22 shows the principle scheme of the super modified cell including the skewed radiation concentrator and constructive approaches for the X-ray standing wave interference field modification at the studied sample position.
Figure 22: Schematic construction of the TXRF original cell allowing to introduce the studied sample into the interference field of X-ray standing wave. The cell includes into it own design last modifications of PXWR properties. 1-the screw fixture; 2- the cell holder; 3-the sample’s substrate; 4- quartz reflectors; 5- the studied sample; 6-SSD detector of TXRF yield; 7- the collimator; 8-X-ray source; 9- scintillation counter for aligning procedure; 10- inlet filter; 11-attenuator.

Reflectors of the cell have angular slopes providing the PXWR input skewed concentrator preparation, deep scratches for the composite PXWR effect initiation and holes with different diameters for the effect creation of nonequivalent length reflectors. For the background deposit decreasing the cell is equipped by Ta collimator and possibility of the helium atmosphere introduction. The cell construction is defined by the Russian patent [52]. It is the main unit of TXRF spectrometer functioning in the Saint Petersburg Electrotechnical University (LETI) in frame of the “Polus” group. The TXRF spectrometer is provided by BSW-22 (Mo) and BSW-22 (Ag) X-ray sources. For example, Figure 23 shows TXRF spectrum of the Dutch cheese sample. HKa, CKa, NKa, OKa lines are not presented in the spectrum because the spectrometer is equipped by X-ray detector with Be window. The spectrum shows CaKa and ClKa lines characteristic for additional components of the product. Analogical measurements presented on Figure 24 were carried out for the petroleum film deposited on Be substrate. But in this case the TXRF method were underpinned by RBS results. RBS of H+ ion beam (E0=0.953MeV) demonstrates the three-step diagram. Height of these steps characterizes the atom quantity in studied material1. The energy position of the steps is corresponded to the ion beams scattering energy on the nuclears of material atoms. Computer approximation of the spectrum allowed to define the sample element composition, which was C0.87H0.1S0.028N0.002 for the studied petroleum. TXRF measurements presented possibilities to display the admixture petroleum composition. For similar investigations SKa line can offer as the internal standard. TXRF spectrum registered NaKa, ClKa, CaKa, VKa, FeKa, NiKa and LaKa set of lines. These element content normalized to the sulphur concentration is presented on the Figure caption. Our petroleum investigations served as the basis for conclusion that the heavy petroleum can be used as real source for the vanadium industrial production and for the experimental extraction of rare-earth elements.
Figure 23: TXRF spectrum of Dutch cheese sample collected by use of the original TXRF cell built on base of modified waveguide-resonance structure and allowed to introduce studied sample into the waveguide-resonance slit clearance. Measurements were carried out with BSW-22 (Mo) radiation source in regime U=40keV, I=3mA. Energy step 28eV/channel.

Figure 24: RBS spectrum of H+ ion beam (E0=0.953 MeV) (a) and TXRF spectrum collected with use the original TXRF cell (b) for the petroleum film deposited on Be substrate. Measurements geometries are shown on insertions. Energy step for RBS spectrum - 1.9keV/channel, for TXRF spectrum - 20eV/channel. Petroleum admixture concentration related to S: Na-0.005; Cl-0.005; Ca-0.005; V-0.015; Fe-0.001; Ni-0.005; La-0.0005

TXRF cell efficiency discussion elaborated on base of the modified waveguide-resonance structure is impossible without of the element detection limits evaluation provided by the cell. This evaluation was executed in process of the water study by selected from Saint Petersbourg water pipe. Figure 25 shows TXRF spectrum collected for sample of the water drop dry residue deposited on the quartz substrate. In the measurements we used the Fe contained solution with 1.8mg/liter its atom concentration as the internal standard. The detection limit for the iron atoms was evaluated on base of the specific expression for this parameter [22]:
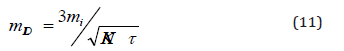
Figure 25: TXRF spectrum of dry residue water drop extracted from Saint Petersburg water pipe collected by use the original TXRF cell. Measurements were carried out with BSW-22 (Ag) radiation source in regime U=40keV, I=4mA, =1000 sec.

Where mLD is the detection limit of atoms in the mass form, mi is the total mass of analyzed atoms, N is the characteristically line yield intensity (counts in sec), t is the measurement period, K is the analytical line contrast parameter defined by the expression:
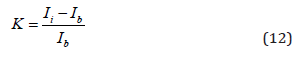
Where Ii is the analytical line total yield, Ib is the background total yield in the analytical line area. The spectrum treatment allowed to calculate the detection limit for iron atoms as 4×10-13g. Ca atoms with concentration 22mg/liter is the main admixture for Saint Petersburg water pipe. Experimental data reported in the work shows that our TXRF cell built on base the super modified waveguide-resonance structure is the beautiful analytical construction. But it realizes only part of potential possibilities for the TXRF analysis efficiency increasing embedded in the waveguide-resonance idea.
Figure 26: Principle design of the TXRF spectrometric cell built on base of disk waveguide-resonator oriented on use the set of X-ray exciting sources for TXRF investigation of different samples. Sources quantity for such structures is not limited.

It is known, that the conventional scheme of TXRF measurements can be oriented on the sole exciting beam source, only. The waveguide-resonance formation of X-ray exciting beam for TXRF changes this stereotype. Figure 26 demonstrates the specific scheme of X-ray waveguide-resonance structure allowing to work with set from four independent X-ray sources. The structure is built in form of two quartz disk reflectors with holes for the studied sample placing and for the X-ray fluorescence yield bringing out. For the waveguide-resonance channels creation the figured deposition of titanium film on one reflector surface is executed. Clean and covered disks superposition creates the waveguide-resonance cell orienting on the use set of independent radiation sources. It is clear that every channel of the waveguide-resonance structure can be modified according to the scheme described early. Realization of the similar constructions can be considered as the next step of the TXRF spectrometry development.
TXRF spectrometry in conditions of ion beam excitation
The conventional TXRF spectrometric X-ray optical scheme is designed for the sliding incidence of X-ray exciting beam on the studied sample surface. At the same time, it is possible the alternative approach to TXRF measurements at the perpendicular incidence of X-ray exciting beam on the surface. Figure 27 presents principle schemes for the TXRF material diagnostics execution by conventional and alternative manners. The TXRF alternative spectrometry is characterized by specific features connected with excitation of a large material volume. In the result, the method has the matrix effect problem but demonstrates the increasing value of X-ray characteristical fluorescence yield. TXRF spectrum can be selected by the slit-cut systems Figure 27 or application of the waveguide-resonance selector. But the best effect from the PXWR application for TXRF alternative spectrometry will be obtained in case of the scheme realization presented on Figure 27. In this scheme the waveguide-resonance configuration appears in the result of narrow extended slit clearance creation between the studied target surface and the Be polished reflector one. Because of Be is transparent to the hard X-ray radiation it excites the target characteristical fluorescence with high efficiency. The waveguide-resonance slit clearance selects from the total X-ray fluorescence yield the specific part of characteristic radiation emitted by the thin surface layer of studied target, only. This experimental scheme possesses by the very high X-ray gathering power but it is unsuitable for the TXRF element quantitative analysis. At the same time, similar scheme can be used for TXRF measurements in conditions of the PIXE spectrometry [53-55].
Figure 27: Schemes for TXRF measurements using X-ray optical conventional geometry (a) and in conditions of X-ray source and detector positions inversion by use the conventional surface fluorescence yield collection (b) and it case of the specific PXWR application.

It is well known, that the X-ray fluorescence spectrometry using X-ray beam excitation has shown very little promise for the light element diagnostics in materials (Figure 6). At the same time, the PIXE spectrometry is very effective for the analysis of these elements. Figure 28 presents experimental data for the excitation cross-section of Ka X-ray fluorescence yield on the hydrogen ion beam energy for the different chemical elements [56]. Comparison of these data with the excitation cross-section data presented on Figure 6 shows that AlKa and YKa fluorescence excitation by the MoKab radiation beam and the hydrogen ion beam with energy E0=1MeV leads to distinction on 6 orders! But for all its attractiveness the PIXE spectrometry is not quantitative method of the element diagnostics. Its possibilities are limited by the matrix effect and the factor connected with the absorption coefficient difference for X-ray radiation with different wavelengths. The matrix effect compensation presence is no possibilities, today. At the same time, there are still rooms for neutralization of the lines absorption difference influence on X-ray fluorescence yield intensity. Figure 29 presents the experimental scheme for X-ray fluorescence yield bringing out excited by the high energy ion beam in conditions of the specific waveguide-resonance structure use. This scheme allows to registrate the X-ray fluorescence yield corresponding to thin surface layer of the studied target [57]. Hole in the center of polished beryllium reflector was designed for the exciting ion beam penetration to the studied sample. The experimental unit presented on the Figure was positioned on goniometer of the Sokol-3 ion beam analytical complex chamber [10]. Experiments were executed with use of the H+ ion beam with energy 1.25MeV. The old copper coin with silver coating was the subject of our measurements. The silver coating thickness 170nm was defined from the Rutherford backscattering spectrum presented on Figure 30. The spectrum approximation was carried out by use the modified computer program build on base of the RUMP computer algorithm [58]. The approximation showed that the silver coating has the thin oxidizing layer with thickness 10nm. Surface carbon film appeared in during of measurements. RBS spectrometry is the absolute diagnostical method but it is characterized by very low sensitivity. This methodical shortage is beautifully compensation by parallel PIXE measurements. The coin X-ray fluorescence spectrum obtained in the conventional PIXE geometry is presented on Figure 31. The spectrum characterizes element composition of the coin as the spectral ensemble featuring of its coating and volume. The waveguide-resonator application allows to select the X-ray fluorescence spectrum corresponding to the coin coating, only. This spectrum is presented on Figure 31. In the result, one can conclude that the silver coating contains Mg, Al and Fe atoms. The coin volume material contains in addition to copper Si, Cl, S, Fe and Ni atoms. Owing to the matrix effect existence the quantitative determination of the admixture’s concentration has some difficulties. The total and selected PIXE spectra comparison demonstrates a visible decreasing of the background deposit in case of the waveguide-resonance application. As a whole, one can establish that the waveguide-resonance structure application for PIXE measurements creates new experimental method for the surface element diagnostics as the TXRF and PIXE hybrid - PI TXRF.
Figure 28: Functions of X-ray fluorescence excitation cross-section for K lines different atoms on the proton beam energy in PIXE experiments [52].

Figure 29: Experimental scheme for TXRF measurements in which X-ray characteristical excitation yield is initiated by high energy proton beam. Scheme is realized by creation of the waveguide-resonance channel between Be polished reflector and studied surface [53].

Conclusion
The work presents short characteristic of TXRF and PIXE experimental methods elaborated for the precision material elements diagnostics and its efficiency increasing in result of the X-ray waveguide-resonance structures including into its experimental facility. There is presented a specific discussion about physics and practical application of the waveguide-resonance structures oriented on the MoKαβ radiation beams.
Acknowledgement
The authors wish to thank Dr. M.S. Afanasiev for help in preparation of PXWR, CPXWR and TXRF cells and prof. Jun Kawai for the interest to works connected with the waveguide-resonance idea. This work was carried out at a partial financial support of Russian Fundamental Investigations Foundation (grant in frame of #16-07-00665) and State task #007-00220-18-00. This paper was a partial financially supported by the Ministry of Education and Science of the Russian Federation on the program to improve the competitiveness of Peoples’ Friendship University of Russia (RUDN University) among the world’s leading research and education centers in the 2016-2020.
Figure 30: Experimental and theoretical RBS spectra of H+ ion beam (E0=1.25MeV) for old copper coin coated by Ag coating. Oxygen and carbon atom are presented in thin surface film of the coating. Energy step 1.9keV/channel.

Figure 31: X-ray fluorescence yield spectra excited by H+ ion beam (E0=1.24 MeV) collected in conditions of conventional PIXE measurements (a) and in the geometry of TXRF material diagnostics (b). Energy step 10eV/channel.sah

References
- Klug HP, Alexander LE (1974) X-ray diffraction procedures. Wiley, New York, USA, p. 966.
- Authier A (2001) Dinamical theory of X-ray diffraction. Oxford. Oxford University Press, UK, p. 661.
- Bertin EP (1975) Principles and practice of X-ray spectrometric analysis. Plenum Press, New York, USA, p. 1079.
- (2009) Handbook of X-ray spectrometry. In: Van Grieken R, Markowicz AA (Eds.), (2nd edn), p. 666.
- Johanson SA, Campbell JL, Malquist KG (1995) Principles induced X-ray emission spectrometry (PIXE). Wiley, New York, USA, p. 451.
- (1983) Quantitative electron=probe microanalysis. In: Scott VD, Love G (Eds.), Wiley, New York, USA, p. 321.
- Jenkins R, Gould RW, Dedcke D (1995) Quantitative X-ray spectrometry. In: (2nd edn) Dekker, New York, USA, p. 484.
- (2012) X-ray spectroscopy. In: Sharma SK (Eds.), In Tech Publication, Croatia, Balkans, p. 280.
- Yoneda Y, Horiuchi T (1971) Optical flats for use in X-ray spectrochemical microanalysis. Rev Sci Instrum 42(71): 169-170.
- Egorov VK, Zuev AP, Egorov EV (1996) Scintillation response of monocrystal PbWO4 to random and channeled ions. NIM B 119(3): 418-424.
- Klockenkamper R (1997) Total reflection X-ray fluorescence analysis. Wiley, New York, USA, p. 245.
- Aiginger H (1991) History development and principles of total reflection X-ray fluorescence analysis (TXRF). Spectrochimica Acta 46(10): 1313-1321.
- Wobrauschek P (2001) Total reflection X-ray fluorescence analysis (Review). X-ray Spectrom 36(5): 289-300.
- Von Bohlen A (2009) Total reflection X-ray fluorescence and grazing incidence X-ray spectrometry-tools for micro- and surface analysis (review). Spectrochimica Acta B 64(10): 821-832.
- Streli C, Wobrauschek P, Meirer F, Perroni G (2008) Synchrotron radiation induced TXRF. J Analyt Atomic Spectrom 23(6): 792-798.
- (2004) X-ray spectrometry: Recent technological advanced. In: Tsuji K, Injuk J, Van Grieken R (Eds.), Wiley, Chichester, England, p. 517.
- Klockenkamper R, Von Bohlen A (2015) Total reflection X-ray fluorescence analysis and related methods. Wiley, New York, USA, p. 519.
- Underwood JH (1975) Glancing incidence optics in astronomy. Space Sci Instr 1(3): 289-299.
- Blochin M (1957) Downstream physics berlin: Verlag der technic, Germany, p. 535.
- Landau LD, Lifshits EM (1965) Electrodynamics of continuous medium. Reading MA. Addison-Wesley, Australia, p. 586.
- Prange A, Schwenke H (1992) Trace element analysis using total reflection X-ray fluorescence spectrometry. Advances in X-ray analysis. 35(1992): 899-924.
- Losev IF (1969) Quantitative X-ray spectral fluorescence analysis. Moscow: Nauk, Russia, p. 336.
- (1981) X-ray fluorescence analysis, application in laboratories. In: Ehrhard H (Eds.), Leipzig: VEB German publishing house for basic industry, Germany, p. 261.
- amptec.com
- Egorov VK, Zuev AP, Egorov EV (2001) X-ray fluorescence analysis of ultralow pollution concentration in condition of X-ray beam total external reflection formed by slitless collimator. Zavodtskaja Laboratories 67(3): 3-11.
- Yakushiji K, Ohkawa S, Yoshinaga A, Hagara J (1994) Origin of spurious peaks of total reflection X-ray fluorescence analysis of Si wafers excited by monochromatic X-ray beam WLb. Japan J Appl Phys 33(2): 1130-1135.
- Egorov VK, Egorov EV (2004) The experimental background and the model description for the waveguide-resonance propagation of X-ray radiation through a planar narrow extended slit (Review). Spectrochimica Acta B 59(2004): 1049-1069.
- Egorov VK, Egorov EV (2013) Peculiarities of the planar waveguide-resonator application for TXRF spectrometry (Review). Adv X-ray Chem Anal Japan 44(2013): 21-40.
- https://arxiv.org/abs/physics/0101059
- Mingazin T, Zelenov V, Lejkin V (1981) Slitless collimator for X-ray beams. Instr Exp Tech 24(1 part 2): 244-247.
- Lejkin T, Mingazin T, Zelenov V (1981) Collimating device for X-ray radiation. Prib Tech Ekxp 24(3): 208-211.
- Lejkin V, Mingazin T, Zelenov V (1984) X-ray beam forming by using of slitless collimator. Instr Exp Tech 27(6 part 1): 1333-1336.
- Kumakhov M, Komarov F (1990) Multiple reflection from surface X-ray optics. Phys Rep 191(1990): 289-352.
- Bedzyk MG, Bommarito J, Schildkraut (1989) X-ray standing waves at a reflecting mirror surface. Phys Rev Let 69(12): 1376-1379.
- Egorov Vk, Egorov EV (2003) Waveguide-resonance mechanism for X-ray beam propagation: Physics and experimental background. Advances in X-ray analysis 46(2003): 307-315.
- Jark W, Di Fonzo S, Logomarsino S (1996) Properties of a submicrometer X-ray beam at the exit of a waveguide. J Appl Phys 80(9): 4831-4836.
- Zwanenburg MJ, Peters JF, Bongaerts JH (1999) Coherent propagation of X-ray in a planar waveguide with a turnable air gap. Phys Rev Let 82(2): 1696-1699.
- Born M, Wolf E (1993) Principle of optics electromagnetic theory of propagation of interference and diffraction of light. Oxford: Pergamon Press, UK, p. 808.
- Mondel L, Wolf E (1995) Optical coherence and quantum optics. Cambridge University Press, UK, p. 837.
- Egorov VK, Egorov EV (2007) Background of X-ray nanophotonics based on the planar air waveguide-resonator. X-ray Spectrometry 36(6): 381-397.
- Egorov VK, Egorov EV (2001) Physics of planar X-ray waveguide. Proc of SPIE 4502(2001): 148-172.
- Egorov VK, Egorov EV (2004) Planar waveguide-resonator: A new device for X-ray optics. X-ray Spectrometry 33(5): 360-371.
- Mirkin LI (1964) Handbook of X-ray analysis of polycrystal analysis. Consultants Bureau, New York, USA, p. 920.
- Tsuji K, Delalieux F (2004) Characterization of X-ray emerging from between reflector and sample carrier in reflector-assisted TXRF analysis. X-ray Spectrometry 34(4): 281-284.
- Egorov VK, Egorov EV (2010) Planar X-ray waveguide-resonator features. Trends in Appl Spectroscopy 8(2010): 67-83.
- Egorov VK, Egorov EV (2012) The compact TXRF cell on base of the planar X-ray waveguide-resonator. Advances in X-ray Chem Anal Japan 43(2012): 139-146.
- Lukianchenki E, Egorov V, Rudenko V, Egorov E (2016) TXRF spectrometer on base of the waveguide-resonator with specific design. IOP Publ J of Physics Conf Series 729(2016): 012028.
- Egorov VK, Egorov EV (2009) Implementation of the light gathering power enhancement of waveguide-resonator. Surface Investigation. 3(1): 41-47.
- Egorov VK, Egorov EV (2002) Composite X-ray waveguide-resonator as a background for a new generation of material testing equipment for films on Si substrates. Proc of MRS 716(2002): 189-195.
- Muller HJ (2013) Basics of statistical physics. World Scientific, Singapore, p. 248.
- Egorov VK, Egorov EV (2018) X-ray fluxes features formed by waveguide-resonators with original design. Phys Rev, p. 23.
- Egorov VK, Loukianchenki EM, Rudenko VN, Egorov EV (2014) The device for X-ray fluorescence analysis of materials equipped by the planar X-ray waveguide-resonator for formation of radiation exciting flux. Russian patent #2555191 with priority.
- Tirira J, Serruys Y, Trosseler P (1996) Forward recoil spectrometry. Application to hydrogen determination in solids. Plenum Press, New York, USA, p. 440.
- Bird JR, Williams JS (1989) Ion beams for material analysis. Acad Pres, Sydney: Australia, p. 718.
- Johanson SA, Caempbell JL, Malquist KG (1995) Particle induced X-ray emission spectrometry (PIXE). Wiley, New York, USA, p. 451.
- Cahill TA (1980) Proton microprobs and particle induced X-ray analytical system. Ann Rev Nucl Part Sci 30(1980): 211-256.
- Egorov VK, Egorov EV, Afanas’ev MS (2017) TXRF spectrometry at ion beam excitation. J of Physics Conf Series 808(2017): 012002.
- Doolitle LR (1985) Algorithm for the rapid simulation of Rutherford backscattering spectra. NIM B 9(1985): 344-351.
© 2018 Egorov VK. This is an open access article distributed under the terms of the Creative Commons Attribution License , which permits unrestricted use, distribution, and build upon your work non-commercially.
Editor In Chief


.jpg)


Signup for Newsletter

Quick Links
 Editorial Board Registrations
 Submit your Article
 Refer a Friend
 Advertise With Us
Our Recent Edition

.jpg)


Top Editors


.jpg)


.bmp)
.jpg)
.png)
.jpg)


.jpg)


.png)

.png)


.png)


Financial Support

Sponsors

Latest e-Books

Latest Video

 a Creative Commons Attribution 4.0 International License. Based on a work at www.crimsonpublishers.com.
Best viewed in
a Creative Commons Attribution 4.0 International License. Based on a work at www.crimsonpublishers.com.
Best viewed in