
- About Us
- Information
-

The Author ensures that the research has been conducted responsibly and ethically with adherence to all relevant regulations. read more..
- For Authors
- For Reviewer
- Manuscript Guidelines
- Membership
- Publication Ethics
-
- Journals
- Reprints
- e-Books
- Videos
- Policies
- Contact Us
 COVID-19
- Submissions


Full Text
Aspects in Mining & Mineral Science
Location Analysis and Selection of Bulk Emulsion Sites for Mining Operations- a Case Study in West Africa
George Agyei* and Victor Amoako Temeng
University of Mines and Technology, Ghana
*Corresponding author: George Agyei, University of Mines and Technology, PO-Box 237, Tarkwa, Ghana
Submission: August 07, 2018;Published: September 21, 2018

ISSN 2578-0255Volume2 Issue3
Abstract
The purpose of this paper is to consider the option of re-locating one of the plants from Ghana to a neighbouring country or locating a new facility, with all sites receiving emulsion supply from these manufacturing sources. The application of Lindo software for linear programming optimisation with transportation methods to determine the most suitable set of bulk emulsion plant locations and financial evaluations of the locations possibilities was done. An assessment into the current bulk emulsion plants locations in Ghana based on cost, distribution of customer demands and clients’ requirements; analysis into the options of an emulsion plant location or relocation outside Ghana revealed that locating a bulk emulsion plant with a monthly production capacity of 1200 tonnes in Burkina Faso C would provide a lower total operating cost. The Comparative analysis of selected scenarios of locations revealed that adding a bulk emulsion plant with a monthly production capacity of 1200 tonnes in Burkina to Faso Site C to the existing locations in Ghana constitute the most economically viable set. This would earn African Explosives Limited (AEL) a strategic competitive edge to maintain its market position in the explosives industry in West Africa and Africa as whole. The originality of the research is evidenced by the need for a good decision on selecting optimal locations of the manufacturing facilities, leading to minimising total weighted costs, transportation distances and time for supplying emulsion to clients
Keywords: Bulk emulsion plant location; Supply chain; Optimisation
Introduction
African Explosives (Ghana) Limited (AEGL) is a wholly owned subsidiary of African Explosives Limited (AEL) based in South Africa. AEL is internationally recognised as one of the world’s largest manufacturers of explosives, initiating systems and blasting services and the leading supplier of these in Africa. As the name suggests, AEGL started operations in Ghana and has currently extended supplies of bulk emulsion and explosives products countries in the West African sub- region, namely Mali, Guinea, Niger, Sierra Leone, Nigeria and Burkina Faso. Currently, AEGL produces from two emulsion manufacturing plants at Bogoso and Tarkwa in Ghana to supply all its clients’ sites in West Africa under the following basic production requirements:
(i) Each plant has production capacity of 2700 tonnes per month, giving a total of 5400 tonnes per month for the two (2) plants.
(ii) Total clients’ demand is approximately 4810 tonnes of emulsion per month.
Regardless of the apparent provision of adequate production, there have been challenges in implementing a consistent cycle of timely and adequate flow of emulsion supply, especially to sites outside Ghana. Emulsion supply to clients’ sites from these two manufacturing bases, is being managed within constraints of long supply chain network of manufacturing and transportation, limited storage capacities at clients’ sites, long transport distances to sites outside Ghana, erratic nature of variances in actual emulsion consumption from demand forecast of clients. One or a combination of the above constraints has been responsible for either recurring emulsion short supply or stock surplus at a client’s site at a particular time.
This study is driven by the need for a good decision on selecting optimal locations of the manufacturing facilities, leading to minimising total weighted costs, transportation distances and time for supplying emulsion to clients. This would earn AEL a strategic competitive advantage to maintain its market position in the explosives industry in West Africa and Africa as whole.
The objective of the research is to conduct an assessment into the current locations of emulsion plants in Ghana based on cost to compare the suitability of relocating one of the plants from Ghana to another country.
A general facility location problem involves a set of spatially distributed customers and a set of facilities to serve customer demands [1-13]. Moreover, highlighted that distances, times or costs between customers and facilities are measured by a given metric. Possible questions to be answered are:
(i) Which facilities should be used?
(ii) Which customers should be serviced from which facility (or facilities) so as to minimise the total costs?
suggest that in a discrete facility location problem, the selection of the sites where new facilities is to be established is restricted to a finite set of available candidate locations. The simplest setting of such a problem is the one in which p facilities are to be selected to minimise the total (weighted) distances or costs for supplying customer demands. This is the so-called p-median problem.
Location of manufacturing and nonmanufacturing operations can have a great impact on operating costs, thereby affecting profit and perhaps price at which goods or services can be offered [5]. Long-range forecasts and capacity plans may reveal the need for additional capacity in some areas. If a company has excess capacity in one location or excess shipping costs to some areas, relocation of some facility or facilities may be desirable [5]. Network redesign is often triggered by expansion opportunities to new markets, mergers, acquisitions, and strategic alliances. Moreover, fierce competition may also force companies to change the configuration of their supply chains through the relocation of some facilities to areas with more favourable economic conditions. Facility relocation is a time-consuming process that must be carefully planned to avoid supply chain disruptions [9,5] states that location decisions are important and warrant management’s careful attention for several reasons. Two important reasons for care in the selection of facility locations are competition and cost. The Operations and entering multinational markets, so they must consider many more locations and address a broader array of issues in their location studies [5,8,9]. Stated that “as a result of economic globalisation, network redesign processes have become more frequent and have gained increasing importance” [3]. highlights that part of the planning processes in Supply Chain Management aims at finding the best possible supply chain configuration. In addition to the generic facility location setup, also other areas such as procurement, production, inventory, distribution, and routing have to be considered (Figure 1).
Figure 1:A Generic supply chain network [9].

The location of one component in the supply chain depends on the location of suppliers, consumers, and other facilities involved in the production distribution process. Ideally, a company should make location decisions to accomplish the entire production distribution process at maximum profit or minimum cost, at least, for that portion of the logistic chain under its control [5,12,13] indicates that location decisions often involve a broad array of factors that can influence revenue, cost, or both and consequently may affect profits.
Materials and Methods
The methods and materials used were as follows:
(i) A study of the current operational management of emulsion production and transportation to clients’ sites of AEL in West Africa.
(ii) Collection, collation and presentation of data. Relevant data in respect of current supplies from plants located in Ghana were the total cost of emulsion supply (production and transport costs), demands by various clients, revenues and travelling distances from each of the facility location to the various clients’ sites. Moreover, estimates of total cost of emulsion supply to clients’ sites, travelling distances to the various clients’ sites and revenues were presented for a proposal of locating an emulsion plant in one of the West African countries outside Ghana. Sources of data would be the Operations Department of AEGL, the Finance Departments of AEL (Ghana and other offices), Representatives of AEGL in the various sites, the contracted transporter of AEGL
(iii) Target a plant location (a re-location or new facility location) from potential sites outside Ghana with the maximum concentration of demand.
(iv) Assessment of sizes of demands, times and distances of travel from the potential locations to select the site that would offer the minimum distances of travel to ensure that deliveries are done on time and required quantities to applicable clients’ sites.
(v) Application of Lindo software for linear programming optimisation to determine the most suitable set of bulk emulsion plant locations among potential options of locations that would provide the most optimal transportation cost of delivering emulsion to clients’ sites.
(vi) Cash flows for the resultant set of emulsion plant locations to evaluate the relative financial and economic viabilities of the locations, using relevant economic indicators. Financial evaluations of the location’s possibilities include an assumption of financial losses from a loss of a major bulk emulsion supply contract due to keeping a long travel distance of supply, and thus, failing to meet the level of delivery requirements of the client.
An overview of the transportation method of linear programming This is a special type of linear programming that deals with the transportation of a product from several sources with limited supplies, to a number of destinations with specified demands. The objective function is normally to minimize total cost of transportation.
he general structure of the transportation problem is represented in the network in Figure 2 below.
Figure 2:Structure of transportation problem.

The general formulation of a transportation problem with m sources and n destinations is as follows:
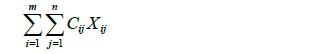
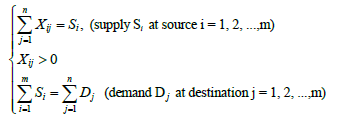
Where,
xij= supply of an amount of product from supply source i to demand destination j.
Cij = unit cost of supply of transporting from supply source i to demand destination j.
This problem could be solved by the simple method but there are special solution methods which are computationally more efficient. Table 1 is a transportation tableau format.
In the transportation problem, there are m supply and n demand constraints, making m + n total constraints. In a typical Lineal Programming (LP) problem, the number of basic variables in the Simplex tableau is equal to the number of constraints. In the transportation problem, one of the constraints is redundant, due to the balance condition:

Therefore, if m+n–1 constraint are satisfied, m+n equations will also be satisfied. Hence, only m + n – 1 independent equation exist. The initiation solution will therefore have m + n – 1 basic variables. Several methods are available for determining the initial solution: The Northwest Corner method and ‘Vogel’ Approximation Method will be examined.
The Northwest Corner method is summarized as follows:
(i) Start at the Northwest Corner (upper-left-hand corner) of the tableau and allocate as much as possible to x11 without violating the supply or demand constraints. i.e. x11 = {min (S1,D1).
(ii) Row 1 and/or column 1 will be eliminated, as one of supply and /or demand will be exhausted. Next, allocate as much as possible to the adjacent cell in the row or column that has not been eliminated. If both row and column are exhausted, move diagonally to the next cell.
Table 1:Transportation Table format.

(iii) Continue in the same manner until all supply/demand requirements have been met.
The Vogel’s approximation method (VAM) consists of making allocations in a manner that will minimise penalty (opportunity) cost for selecting the wrong cell for an allocation.
The process is summarized as follows:
(i) Calculate the penalty cost for each row and column. The penalty costs for each row are computed by subtracting the smallest Cij value in the row from the next largest Cij value in the same row. Penalty costs for columns are obtained in the same way, by subtracting the smallest Cij value in each column from the next largest column Cij value. These costs are the penalty costs for not selecting the minimum cost cell.
(ii) Select the column or row with the greatest penalty cost (breaking ties arbitrary). Allocate as much as possible to the cell with the minimum Cij value in the indicated row or column; that is, for minimum Cij xij = min {S1,D1}. As a result, the largest penalties are avoided.
(iii) Adjust the supply and demand requirements to reflect the allocation(s) already made. Eliminate any rows and columns in which supply and demand have been exhausted.
(iv) If all supply and demand requirements have not been satisfied, go to the first step and recalculate new penalty costs. If all row and column values have been satisfied, the initial solution has been obtained.
The total cost of the initial solution calculated using the VAM is lower than that for the initial solution using the Northwest corner method.
For the Determination of the optimum solution, two main methods for determining the optimal solution will be discussed: Stepping-Stone method and Modified Distribution method. In the Stepping-stone method, after finding the initial basic solution, the next step is to find whether the solution can be improved. The fundamental feature is evaluating non-basic variables to determine if improvement is possible and then reallocating the units. A closed path of occupied cells is used to evaluate each empty cell (nonbasic variable). For a non-basic variable (empty cell) to enter the solution, it must contribute to a reduction in the objective function value.
The following conditions for the construction of stepping-stone paths are given:
(i) The direction taken, clockwise or anticlockwise, is immaterial in determining closed path. The same path will result regardless of direction.
(ii) There is only one unique closed path for each empty cell.
(iii) The path must follow only (change direction at) occupied cells; the exception being the non-basic variable being evaluated.
(iv) However, both empty and occupied cells can be skipped over in construction of a closed path.
(v) A path can cross over itself.
(vi) Exactly one addition and one subtraction must appear in each row and column on a path.
The purpose of the closed path is to allocate units to an empty cell while maintaining supply and demand constraints. This means for a given closed path, allocating one unit to a cell (nonbasic variable) should be balanced with a subtraction of one unit from respective row and column cells at opposite ends, and so on. To determine which cells can enter the solution, determine the net cost change (C∗ij) for various empty cells. This is achieved by summing up unit cost of each cell in a closed path, adding up unit cost of cells with positive allocations and subtracting unit cost of cells with negative allocations.
The following conditions apply in introducing an evaluated non-basic variable in the solution to reduce cost:
(i) The non-basic variable with a negative C∗ ij.
(ii) If there are two or more non-basic variables with C∗ ij negative, then select the most negative one.
(iii) In case of a tie, select arbitrarily.
The amount allocated to the entering non-basic variable is limited to the amount that can be feasibly transferred along the closed path and satisfy the demand/supply constraint.
The amount allocated to non-basic entering variable is restricted to the minimum amount in a cell to be subtracted from (xij) in the closed path. In general, re-allocated xij is the minimum on the closed path.
Re-allocated xij = min (xij on closed path).
When all C∗ ij are positive, the solution is optimal; otherwise steps have to be iterated to attain it.
The modified distribution method (MODI) differs from the stepping stone method in the sense that it is unnecessary to determine all the closed paths for non-basic variables. Instead, C∗ ij values are determined simultaneously and the closed path is identified only for the entering non-basic variable.
In the MODI method, a value ui is defined for each row (i) and a value vj, is defined for each column (j) in the transportation tableau.
For each basic variable, xij, the following relationship exists:
ui + vi = Cij
Where, Cij is the unit cost of transportation.
A summary of the modified distribution method is given as follows:
(i) Determine ui values for each row and vj values for each column by using the relationship ui + vj = Cij for all basic variables and assigning a value of zero to u1.
(ii) Compute the net cost change C* ij for each non-basic variable using the formula:
C*ij = Cij - ui - vj.
(iii) If a negative C* ij value exists, the solution is not optimal. Select the xij variable with the highest negative C* ij value as theentering non-basic variable.
(iv) Allocate units to the entering non-basic variable, xij according to the stepping stone process. Return to step 1.
Prohibited routes exist when it is not possible to transport units over certain routes. Such transportation problems with prohibited routes are handled by assigning a large Cij value, M (e.g., 1000 000) to xij which is prohibited. The normal solution process is then conducted with M being treated as any other Cij.
Results and Discussion
This section relates to collation, presentation and analysis of relevant data, as well as results. Comparative evaluations of a suggested option of a location or re-location of a bulk emulsion plant between potential sites in one of the countries outside Ghana are carried out. Evaluation criteria include demand levels, total delivery costs and distances and their impacts on service levels to the clients.
The overall economic viability and profitability between current set of emulsion plants in operation and a set of plants including a proposed location outside Ghana are compared. Consequently, the optimal bulk emulsion plant locations for AEGL in West Africa are determined
Potential sites for a bulk emulsion plant in Burkina
Potential sites in Burkina Faso for the plant location are considered. Initial analysis for determining potential sites is based on sites with the highest demand for bulk emulsion. Burkina Faso Sites C and Burkina Faso D, with initial demand of 300 tonnes each of bulk emulsion per month, constitute sites with the highest demand when their operations. Consequently, Burkina Faso Sites C and Burkina Faso D become potential sites one of which will be the optimal location for a bulk emulsion plant, after a further analysis. Table 2 and Table 3 present round-trip distances and cycle times of bulk emulsion deliveries respectively, from manufacturing sites (established and potential sites) to clients’ sites. It is assumed here that supplies are made from a plant location to all clients’ sites.
Results from Table 2 and Table 3 reveal that Burkina Faso Site C offers the lowest total round-trip distances and cycle times of bulk emulsion deliveries respectively, to the various sites. These mean that compared to the other locations, Burkina Faso Site C is the most centrally located.
Table 2:Round trip travel distances from manufacturing sites.

Table 3:Cycle times of bulk emulsion deliveries.

Determining optimal location of bulk emulsion plant in Burkina Faso
Analysis is conducted on Burkina Faso Sites C and D to determine the most optimal site for a bulk emulsion plant location. The goal is to minimize the product losses and the total cost Lozano et al. [8]. Analysis was based on two factors:
(i) Total optimal transportation costs to clients’ sites when the facility is in either of the potential sites.
(ii) Present and future demands of Burkina Faso Sites C and D for bulk emulsion
Table 4:Table for optimising transportation costs involving Burkina Faso site C location.

Table 5:Table for optimising transportation costs involving Burkina Faso site D location.

The transportation method was used to formulate a model based on the bulk emulsion supply chain with the objective of minimising total transportation cost per month. The model was formulated for two cases: Case 1 is where the facility is located at Burkina Faso Site C and Case 2 is where the facility is located at Burkina Faso Site D. Table 4 and Table 5 are transportation tableaux laid out to evaluate total optimal transportation costs if a third emulsion plant is in Burkina Faso sites C and D respectively.
Table 6:Cashflow analysis for bulk emulsion supplies from ghana plants.

Table 5 and Table 6 have details of the supply capacities of the plants, demand requirements at the clients’ sites, and the transportation costs ($/tonne) for the two options. The model was coded in the Lindo software to evaluate the two options considered for the location of bulk emulsion plant in Burkina Faso. The model is as follows:
Let Xij = tonnes of bulk emulsion transported from plant i to site j.
The software applies the general formulation of a transportation problem with m sources (plants) and n destinations (sites). This is a minimisation problem specified by Eq. (1) subjected to Eq. (2):
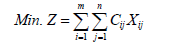
Where Xij is the tonnes of emulsion transported from plant i to site j per month, i is the ith plant, j is the jth site; m is the number of plants, n is the number of sites, Cij is the cost of transporting a tonne of emulsion from plant i to site j, Si is the monthly production capacity of plant i and Dj is the monthly demand of site j.
Results from lindo software application
Lindo results revealed total optimal transportation cost (objective function) for Case 1 (if an emulsion plant at Burkina Faso Site location is added) to be $ 181 612 per month. Result for total optimal transportation cost for Case 2 (if an emulsion plant at Burkina Faso Site location is added) is $ 181 127. Optimal cost for Case 2 is less than that of Case 1 by $ 485 per month. The cost difference in favour of case 2 is insignificant compared to the higher proportion of demand growth rate that Burkina Faso Site C is expected to provide than Burkina Faso Site D.
Thus, overall analysis justifies the selection of Burkina Faso Site C as a location for the proposed bulk emulsion plant with a monthly production capacity of 1 200 tonnes. Hence, $ 1612 becomes a variable cost component for an alternative set of bulk emulsion plant locations of AEGL. The optimal transportation routes and respective supplies are graphically shown by Figure 3.
Figure 3:Structure of transportation problem.

Costs of bulk emulsion supply from plants options
Figure 4 depicts major components and total costs of production and supply of bulk emulsion and highlights the following:
a. AEGL’s current two bulk emulsion plants in Ghana Sites A and B.
b. The option of the current bulk emulsion manufacturing plants in Ghana plus a bulk emulsion manufacturing plant with a monthly production capacity of 1 200 tonnes in Burkina Faso site C.
Figure 4 establishes that total cost of supplying bulk emulsion from current Ghana locations is higher than the option of adding a manufacturing location in Burkina Faso Site C to current facilities in Ghana. This is although it is far cheaper to produce in Ghana. Figure 5 shows percentages of fixed and variable costs components incurred in the production and supply of bulk emulsion.
Figure 4:Costs of bulk emulsion supply.

Figure 5 demonstrates that if an additional bulk emulsions plant with a monthly production capacity of 1 200 tonnes is introduced in Burkina Faso site C, fixed cost portion would increase from 2.9 percent to 4.1 percent, whilst variable cost portion would decrease from 97.1 to 95.9 percent. Variable cost components considered are bill of material (BOM) and transportation of emulsion from manufacturing locations to demand sites.
Also Figure 5 shows that although delivered costs of raw materials are estimated to increase from 84 percent of total costs for Ghana plants to 89.4 percent for an added plant in Burkina Faso site C, transportation costs would reduce drastically from 13.1 to 6.5 percent. This is due to a significantly minimised weighted distance of transportation from manufacturing locations to clients’ sites and reduced amount of inter country import duties.
Figure 5:Percentages of major cost components of bulk emulsion plants in Ghana.

The reduced transportation cost of deliveries to clients’ sites from the introduction of a facility location in Burkina Faso outweighs the effects of higher costs of the total delivered costs of raw materials and fixed costs. The combined effects of these factors were responsible for the total lower supply cost, exclusive of inter country operational taxes, relative to exclusive supplies from Ghana. The reason for the reduced transportation cost of deliveries outweighing higher cost of delivered raw material is the limited quantities of the raw materials required for the recommended production capacity of the plant location in Burkina Faso Site C.
Economic evaluation of AEGL’s emulsion plants
As AEGL is a business entity, it is important to compare the economic viability of the two scenarios of AEGL’s bulk emulsion plant locations – maintaining the existing two locations in Ghana and the proposal of adding a smaller capacity facility in Burkina Faso. Results of these evaluations are used to determine the optimal bulk emulsion plant locations for AEGL. Conjunctive applications of NPV and IRR values are used to measure the relative viability and profitability of supplies from the two-location options a fore mentioned over a project period of seven years.
Table 7:Cash flow for bulk emulsion supplies from Ghana plants minus supplies to Burkina Faso site c from third year.

Table 8:Cashflow for bulk emulsion supplies from Ghana plants plus a proposed plant in Burkina Faso site C.

AEGL fully depreciates capital assets and pay up loans and interests in seven years. Thus, the choice of the seven years period for the cash flow analysis was to conform to AEGL’s operations to obtain practical results. Table 6-8 are respective cash flows for supplies from:
(i) The existing bulk emulsion plants in Ghana.
(ii) Bulk emulsion plants in Ghana plus a proposed location in Burkina Faso site C.
(iii) An assumption of bulk emulsion supply from plants in Ghana without supply contract to Burkina Faso site C after second year of supply.
The cash flows were analysed with the following facts and assumptions:
(i) Mine’s projections of increased emulsion usage from 300 tonnes to 440 tonnes and 300 to 350 tonnes by Burkina Faso site C and D respectively.
(ii) Assumption that AEGL loses the big contract with Burkina Faso site C from third year of supply, after falling short of standards of just in time supplies due to long travel distance and increased supply requirements from production locations in Ghana.
The calculation of selected parameters in the cash flow
Gross revenues=Quantity of bulk emulsion used (tonnes) x unit price of the bulk emulsion applicable to a site. Investments provisions in Ghana and Burkina Faso were applied. Examples are as follows:
Corporate tax=25% of taxable income from sales in Ghana.
Export tax=8% of taxable income from exports.
Location allowance=50% of total tax
Depreciation by accelerated cost recovery system (ACRS) was applied.
Losses were carried forward for 5 years.
Location allowance is a tax rebate enjoyed by manufacturing companies located outside regional capitals.
The following are applicable taxes and investment allowances in Burkina Faso:
Corporate tax=30% of taxable income from sales in Ghana.
Export tax=5% of taxable income from exports.
Accelerated cost recovery depreciation (ACRD) was applied.
Losses were carried forward for 5 years.
Figure 6:Economic viability indicators of bulk emulsion plants of AEGL.

The corresponding NPV and IRR values calculated from cash flow analysis are found in Table 6-8 are summarised in Figure 6. Supplies from current bulk emulsion plants in Ghana plus a proposed plant in Burkina Faso Site C produces the highest NPV of $1 544 775 but the lowest IRR, whilst supplies from Ghana Plants but losing contract supply to Burkina Faso Site C after first two years of supply, produces the highest IRR of approximately 169.95%. Exclusive supply from Ghana plants to all sites in West Africa produces the lowest NPV.
The above findings reveal the following results:
A. Supplies from current bulk emulsion plants in Ghana plus a proposed plant in Burkina Faso Site C constitute the optimal set of bulk emulsion plants locations, although this set produces the lowest IRR. This is because the NPV represents the crucial indicator once the calculated IRR is not a negative value and is greater than the set discount rate, in comparative evaluations of mutually exclusive projects.
B. All three scenarios of facility locations and supplies produce both positive NPVs and IRRs which are greater than discount rates. These indicate that that they are all economically viable and profitable projects. However, differences in their economic indicators show that they have relative degrees of projects viability and profitability.
C. Supplying exclusively from Ghana plants to all sites in West Africa as in the current situation constitutes the least profitable option.
Conclusion
This study is driven by the need for a good decision on selecting optimal locations of the manufacturing facilities, leading to minimising total weighted costs, transportation distances and time for supplying emulsion to clients. This would earn AEL a strategic competitive edge to maintain its market position in the explosives industry in West Africa and Africa as whole. The objectives of the paper was to conduct an assessment into the current locations of emulsion plants in Ghana based on cost; consider the option of relocating one of the plants from Ghana to a neighbouring country or locating a new facility, with all sites receiving emulsion supply from these manufacturing sources; and conduct relevant analysis to compare suitability of the selected scenarios of locations.
Assessment into the current bulk emulsion plants locations in Ghana based on cost, distribution of customer demands, and meeting clients’ requirements revealed that they are sufficient for the Ghana explosives market. However, they do not provide minimum cost, time and distance of supplies to sites outside Ghana. Analysis into the options of an emulsion plant location or relocation outside Ghana revealed that locating a bulk emulsion plant with a monthly production capacity of 1200 tonnes in Burkina Faso C would provide a lower total operating cost. Comparative analysis of selected scenarios of locations revealed that adding a bulk emulsion plant with a monthly production capacity of 1200 tonnes in Burkina to Faso Site C to the existing locations in Ghana constitute the most economically viable set.
References
- Apte A, Heidtke C, Sameron J (2015) Casualty location optimisation: A study for British Columbia. Interfaces 45(2): 149-165.
- Aryanezhad MB, Jalili SG, Jabbarzadeh A (2010) An integrated supply chain design model with random disruptions consideration. African Journal of Business Management 4(12): 2393-2401.
- Cordeau JF, Pasin F, Solomon MM (2006) An integrated model for logistics network design. Annals of Operations Research 144(1): 59-82.
- Daskin MS (2013) Network and discrete location: Models, algorithms and applications. In: (2nd Edn) Wiley, New York, USA, p. 536.
- Dilworth JB (1992) Production and Operations Management, McGraw- Hill, Inc, USA, p.139.
- Drezner T (2004) Location of casualty collection points. Environmental and Planning C: Government and Policy 22(6): 899-912.
- Drezner Z, Hamacher HM (2002) Facility location: applications and theory, Springer, New York, USA, p. 108.
- Lozano S, Adenzo DB (2008) Network-based biobjective optimisation of product flows in a supply chain. Annals of Operations Research 264(1- 2): 307-323.
- Melo MT, Nickel S, Saldanha GF (2009) Facility location and supply chain management-A review. European Journal of Operations Research 196(2): 401-412.
- Nickel S, Puerto J (2005) Location theory: a unified approach, Springer, Berlin, Germany, p. 435.
- ReVelle CS, Eiselt HA (2005) Location analysis: a synthesis and survey. European Journal of Operations Research 165(1): 1-19.
- Shen ZM, Coullard C, Daskin MS (2003) A joint location inventory mode. Transportation Science 37(1): 40-55.
- Sperenza MG (2018) Trends in transportation logistics. European Journal of Operations Research 264(3): 830-836.
© 2018 George Agyei. This is an open access article distributed under the terms of the Creative Commons Attribution License , which permits unrestricted use, distribution, and build upon your work non-commercially.
Editor In Chief


.jpg)


Signup for Newsletter

Quick Links
 Editorial Board Registrations
 Submit your Article
 Refer a Friend
 Advertise With Us
Our Recent Edition

.jpg)


Top Editors


.jpg)


.bmp)
.jpg)
.png)
.jpg)


.jpg)


.png)

.png)


.png)


Financial Support

Sponsors

Latest e-Books

Latest Video

 a Creative Commons Attribution 4.0 International License. Based on a work at www.crimsonpublishers.com.
Best viewed in
a Creative Commons Attribution 4.0 International License. Based on a work at www.crimsonpublishers.com.
Best viewed in