- Submissions

Full Text
Aspects in Mining & Mineral Science
The Production of Critical Materials as By Products
Philip C Keller and Dr. Corby G. Anderson*
Department of Metallurgical and Materials Engineering, Colorado School of Mines, USA
*Corresponding author: Corby G Anderson, Kroll Institute for Extractive Metallurgy, George S. Ansell Department of Metallurgical and Materials Engineering, Colorado School of Mines, Golden, Colorado USA 80401
Submission: August 15, 2018;Published: August 17, 2018

ISSN 2578-0255Volume2 Issue2
Introduction
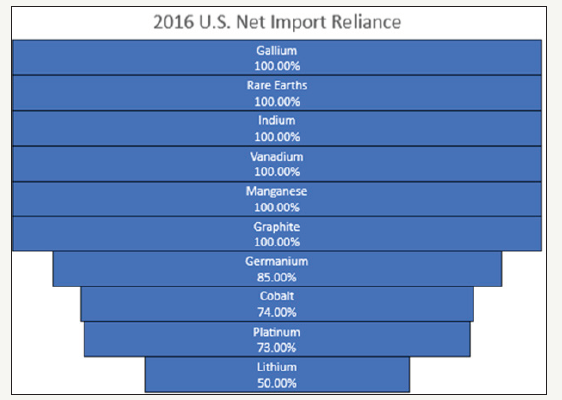
This issue of material criticality has been receiving much attention recently from governments all over the world. The United States and the European Union have two different definitions of what makes a material critical. The United States Department of Energy (DOE) defines criticality in two ways: (A) supply based risk based on projected market balances, competing energy demands, political, regulatory and social factors, co-production risks, and producer diversity; and, (B) importance to clean energy based on clean energy demand and substitutability [1]. Net import reliance can hint at the supply based risk for materials. Figure 1 shows the United States net import reliance for materials of interest.
Figure 1:United States net import reliance for materials covered in this review [2].
The European Union defines a material as critical when “the risks of supply shortage and their impacts on the economy are higher than for most of the other raw materials” [2]. From these two definitions, the European Union takes a broader approach to defining critical materials than the US DOE does. Essentially both government organizations define a material as critical when it provides essential properties to a modern engineered material and is subject to supply risk. The purpose of this paper is to summarize current efforts to increase supply stability of critical materials through by product or co product production alongside more common elements. This paper will cover byproduct production for cobalt, rare earth elements, lithium, gallium, germanium, graphite, manganese, vanadium, indium, and the platinum group metals.
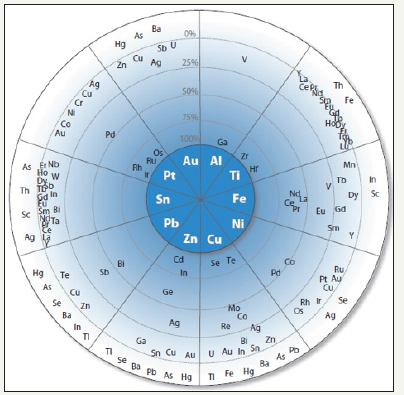
A metal can be defined as a by product if the revenue gained from the sale of that metal is not enough to cover the full cost of the mine. On the other hand, if the full costs of the mine can be covered solely by the sale of the minor metal, then it is considered a co product [3]. Minor metals, such as the critical materials listed above, are not economically viable to mine as a primary material and are therefore mined as a by product to materials that are able to produce enough revenue to cover mine expenses. This allows increased quantities of critical materials to be recovered and can help to relieve supply risks and shortages. Figure 2 shows a Figure which describes metal companionability. This Figure shows which metals are usually associated with more commonly mined elements.
Figure 2:Principal host elements are in the center of the diagram. Surrounding the host metals are elements that are spaced proportionally to the percentage of their primary production that originiates with the indicated host element [3].
Cobalt
Cobalt was first isolated in its elemental form in 1730, but its only practical application until 1907 was in pigments. In 1907 cobalt first became used in alloys. To this day, cobalt has very few uses in its pure form and is primarily alloyed with other metals for use in modern materials. The primary uses for cobalt are in batteries, super alloys and magnet alloys, catalysts, and a wide variety of other materials applications [4]. Because of its importance in battery and super alloy construction, and its limited production around the world, cobalt is designated by the European Union as a critical material [1,2].
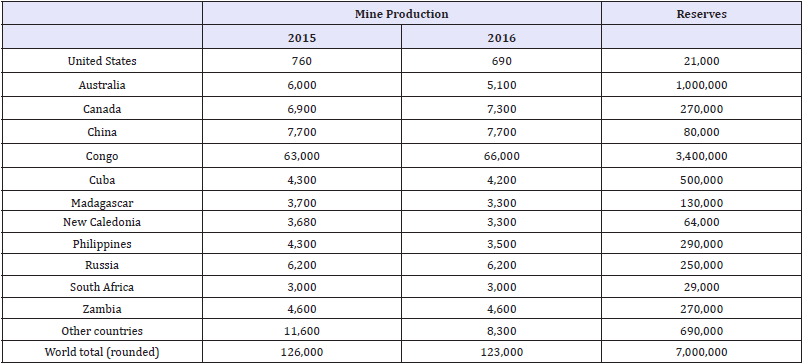
Cobalt is primarily derived of copper and nickel host mines as a by product material. Economic concentrations of cobalt are so exceptional that it can be essentially considered a by product of ores mined for other elements. The concentration of cobalt in a cobalt containing ore is usually less than 0.5% and often less than 0.1% [5]. Approximately 30 percent of the world’s cobalt resources are derived from sulfide minerals containing copper and nickel, with minor quantities of cobalt and a trace amount of precious metals [6]. The other 70 percent of global reserves stem from laterite ores [6]. The United States currently has a net import reliance of 74% of apparent consumption for cobalt [7]. Table 1 shows the worldwide distribution of cobalt production and reserves as reported by the USGS. From this Table, the United States has a very small percentage of total cobalt production leading to the high net import reliance.
Table 1:World mineproduction and reserves for cobalt as reported by the USGS [7].
Cobalt bearing sulfide deposits have historically been processed by flotation, followed by smelting to produce a platinum group metal (PGM) bearing nickel matte which is then shipped to specialist refineries for the recovery of nickel, copper, PGMs, and cobalt [8]. Some of the specialist refinery processes include the Sherritt- Gordon process, pressure oxidation leaching, sulfate oxidative leaching, chlorine leaching, electro refining of nickel matter anodes, and electro refining of impure metals. Environmental pressure on matte smelting operations has led to the development of purely hydrometallurgical processes and the scarcity of new economic nickel sulfide deposits is shifting the development focus onto laterite deposits [8,9]. A generic flow sheet for the recovery of cobalt from copper/nickel mines is shown in Figure 3.
Figure 3:Generic copper/cobalt/nickel recovery flow sheet [8].

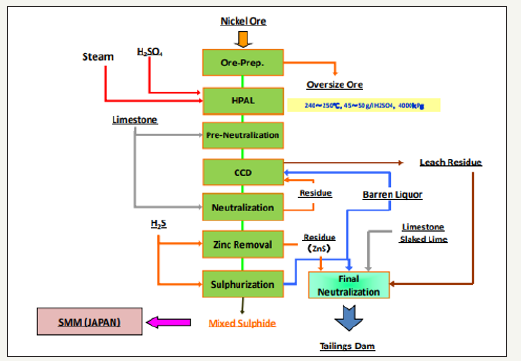
Laterite ores are currently primarily being treated using high-pressure acid leaching (HPAL). HPAL is a hydrometallurgical process that was developed in Cuba in the 1950s for the treatment of nickel laterite ores. HPAL techniques make the recovery of cobalt from laterite ores possible and the improvement of the HPAL process has led to an increase in the recovery of cobalt from nickel ores. As roughly 70 percent of global reserves of cobalt are contained in laterite ores, the HPAL process will become more and more important to the recovery of cobalt [4]. An example flow sheet showing the HPAL process for treating nickel ores is shown in Figure 4.
Figure 4:Coral Bay Nickel Corporation process flow sheet showing the HPAL process [9].
Rare earth elements
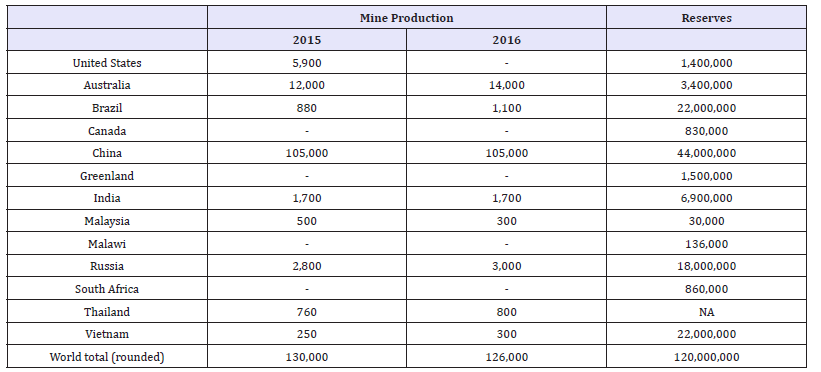
The rare earth elements (REE) are defined, according to the International Union of Pure and Applied Chemistry (IUPAC), as the 15 lanthanides together with yttrium and scandium. The name rare earth elements are somewhat misleading as the REEs are common in the Earth’s crust. REEs, however, are very difficult to separate from one another because of their similarity in chemical behaviours. Rare earth elements also rarely occur in concentrations high enough to be mined as a primary product and are therefore most commonly mined as a by product of another material. China currently produces approximately 90 percent of worldwide REE. This, in part, has led to REEs being designated as critical materials by the European Union and the United States among other countries [1,2]. The United States also reported a 100% net import reliance for rare earth elements in 2016 [10]. The only REE producing mine in the United States was shut down leading to no production of REE for the United States. Table 2 shows the world mine production and reserves for REE as reported by the USGS.
Table 2:World mineproduction and reserves of REE [10].
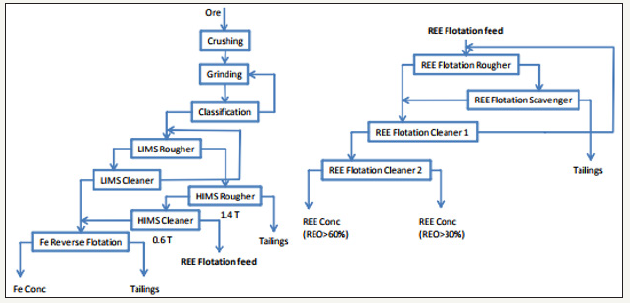
Rare earth elements are recovered around the world as both co products and by products to other materials. When REEs are mined as a co product, the market value of the main product supports the extraction of the rare earth, and the recovery of the rare earth, in turn, helps to make the recovery of the main product even more attractive [11]. When REEs are recovered as by products, it is the same as a co product production except that the REE is not a primary ingredient in making the main product economically viable [11]. Due to the rarity of an economic deposit of only REEs, they are usually mined as either co product or by products to another material. The Mountain Pass Mine in California is one no exception. One of the most important REE by product mines in the world is the Bayan Obo mine in China. The primary product of Bayan Obo is iron ore, but Bayan Obo also produces much of the world’s REEs as a by product. In 2009, Bayan Obo produced 55,000 metric tons of rare earth oxides (REO) [11]. Bayan Obo produced more REEs than any other mine in the world. The primary processing of the REEs at Bayan Obo is by flotation and gravity separation. First the ore is crushed and ground to a specified size. The magnetic components of the ore are then separated out and the material is sent to flotation. After selective flotation, the flotation concentrate is upgraded using gravity separation with shaking Tables, spiral concentrators, and conical separators [11,12]. Figure 5 shows the process flow sheet for the Bayan Obo mine.
Figure 5:Process flow sheet for the Bayan Obo Iron mine in China [12].
A new potential source of byproduct REEs exists in phosphate containing ores. REEs can replace calcium in the crystal lattice of apatite and the ore can contain REE concentrations in the range of 0.1 to 0.8 percent [13]. Because of this low concentration, the rare earth element content in the phosphate rock is too small to be produced alone so they must be produced alongside fertilizers or phosphoric acid. Currently, the leading process for the recovery of REEs from apatite would involve leaching with nitric acid. After a nitric acid leach is performed, the REEs could then be precipitated through the addition of ammonia [13]. The literature shows that this method would result in approximately 97% of the REEs reporting to the precipitate. Hydrochloric acid was also tested for leaching but resulted in lower weight percent rare earth oxide reporting to the precipitate. Because of this, nitric acid was selected because of increased recovery and decreased corrosiveness [13].
Lithium
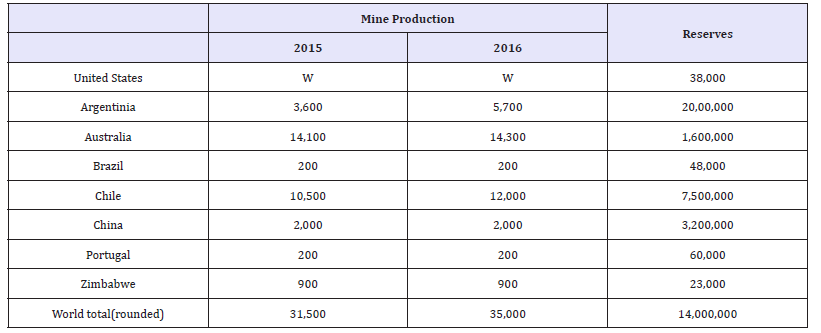
Lithium is a material that has seen a large increase in demand and production over the last few decades. Between 1999 and 2008, lithium saw a 79% increase in production around the world with Chile now producing 50% of all lithium [14]. Due to its high reactivity, lithium only occurs in nature in the form of compounds such as silicates in igneous rocks, in several clay minerals, and generally as chlorides in brines. Pegmatites and brines are the two primary sources of lithium that currently exist. Pegmatites are coarse-grained igneous rocks formed by crystallization of late magmatic fluids and brines are liquid lithium salt mixtures that come from several different sources. Some other minor primary sources of lithium exist, but pegmatites and brines produce most of lithium resources. Lithium is currently considered to be a nearcritical material by the United States Department of Energy [1]. The United States currently has a >50% net import reliance for lithium [15]. Table 3 shows the worldwide mine production and reserves of lithium as reported by the USGS. The ‘W’ in the mine production column for the United States means that the data was withheld by US producers to avoid disclosing proprietary company data.
Table 3:Worldwide mineproduction and reserves data for lithium [15].
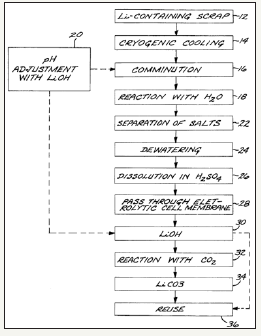
Currently the by product production of lithium is very rare but recycling of lithium containing materials is the topic of many research projects. The single largest use of lithium now is for lithium-ion (Li-ion) batteries. Li-ion batteries accounted for 27% of total lithium consumption in 2010 and this number can only be expected to increase as electric and hybrid vehicles become more mainstream [14,15]. Li-ion battery recycling is a very difficult process because of the high reactivity of lithium. A recycling company by the name of Toxco Inc. created a solution for this problem and patented their process [16]. In the Toxco process, li-ion batteries are first submerged in liquid nitrogen to decrease the reactivity of the lithium. The batteries are then comminuted and added to a high pH solution controlled by adding lithium hydroxide (LiOH). Lithium compounds are precipitated in the high pH solution and are then further refined with a mild sulfuric acid and a membrane to allow the transfer and concentration of lithium ions [16]. Figure 6 shows the flow sheet for the Toxco Process as presented in the patent application. This battery recycling process is one of the best methods currently available for the recycle of li-ion batteries. As li-ion batteries continue to spread throughout technological sectors, the recycling efforts surrounding them will be increased as well.
Figure 6:Toxco process flow sheet for the recycle of lithium from lithium ion batteries [16].
Gallium
Gallium is a metal that is used in many different forms across many different industries. As a metal, gallium is used in magnets, thermometers, and thin film depositions among many other things [17]. Gallium antimonide (GaSb) is a semiconducting material that is used in both electronic and optoelectronic devices such as LEDs, thermal imaging, and missile homing guidance systems [17]. The greatest use of gallium today is in gallium arsenide (GaAs) compound semiconductors. Some of the most important uses of gallium arsenide semiconductors are in cell phones, military applications, LEDs, and wireless communications. Because of its wide-ranging applications and difficulty using substitute materials, gallium is considered to be critical by the European Union [1,2]. The United States also reported a 100% net import reliance for gallium in 2016 In 2016, world low-grade primary gallium production was estimated to be 375 tons-a decrease of 20% from 470 tons in 2015. Low-grade primary gallium producers outside of China most likely restricted output owing to a large surplus of primary gallium. China, Germany, Japan, and Ukraine were the leading producers; countries with lesser output were Hungary, the Republic of Korea, and Russia. Kazakhstan, which was a leading producer in 2012, has not reported any production since then. Primary refined high-purity gallium production in 2016 was estimated to be about 180 tons. China, Japan, the United Kingdom, and the United States were the known principal producers of high-purity refined gallium. Gallium was recovered from new scrap in Canada, China, Germany, Japan, the United Kingdom, and the United States. World primary lowgrade gallium production capacity in 2016 was estimated to be 730 tons per year; high-purity refinery capacity, 320 tons per year; and secondary capacity, 270 tons per year. Gallium occurs in very small concentrations in ores of other metals. Most gallium is produced as a byproduct of processing bauxite, and the remainder is produced from zinc-processing residues. Only a portion of the gallium present in bauxite and zinc ores is recoverable, and the factors controlling the recovery are proprietary. Therefore, an estimate of reserves is not possible [18].
Currently there are no mines which recover gallium as a primary resource, but two major byproduct sources for gallium exist: bauxite and sphalerite (ZnS) [3]. The primary recovery method for bauxite is the Hall-Heroult process. In this process, a recirculating solution of sodium aluminate cycles through the process. It is in this solution stream that the gallium present in bauxite builds up. This is then bled off and the gallium is extracted from the solution. Currently, only a small fraction of the gallium available in bauxite ore is used because of the low relative demand and price [19]. Bauxite containing gallium is also plentiful in the earth’s crust and is widely distributed both geographically and politically [20]. Once a gallium-containing zinc ore is leached by sulfuric acid to produce zinc sulfate leach liquor, the impurities, such as gallium, are precipitated out of the liquor through the addition of antimony trioxide or zinc dust [17]. The gallium is then extracted from the cemented materials and refined into a usable product. Gallium is also heavily recycled from manufacturing waste of semiconductors [17].
Germanium
Germanium is a grey-white metalloid that has many useful applications. Today, three sectors account for 80% of germanium end us around the world. These three sectors are fiber optics (30%), infrared optics (25%), and as catalysts for colorless PET (25%) [18-22]. Various other applications for germanium exist other than the three main use categories. Some of these categories include silicon chips for solar instalments, high speed integrated circuits for wireless communications, and much smaller quantities for the medical and metallurgical industries. Because of the limited number of world producers of gallium, and its wide-ranging uses in advanced technologies and green energy, gallium is considered to be critical by the European Union at this time [1,2]. Table 4 shows the worldwide germanium refinery production and reserves.
Table 4:World refinery production and reserves of germanium as reported by the USGS [22].

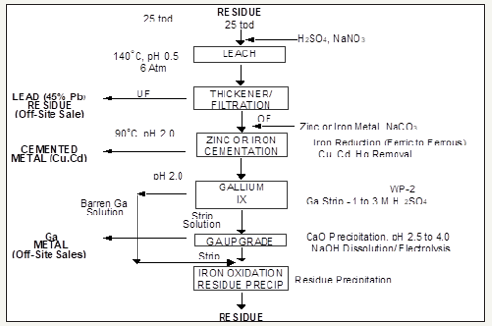
The primary source of germanium around the world today is germanium that is produced as a by product of zinc refining [23]. Germanium can be recovered from zinc bearing ores through many different methods including precipitation, cementation, solvent extraction, and ion exchange. Germanium is sometimes also present in lignite coals and can be extracted from the coal ash after the coal has been combusted for energy production. This is performed to a limited degree in China, Russia, Ukraine, and possibly Uzbekistan [21]. The United States has a small amount of primary germanium production from mines in Alaska and Washington. Despite these local sources of germanium, the United States still has an 85% net import reliance for its germanium supply [22]. This can be remedied through increased germanium extraction as by product. Zinc-lead mines in Tennessee offer a good potential source for germanium by product extraction [24]. Figure 7 below shows a flow sheet that represents the general stages of zinc processing. The flow sheet also shows the output location of any germanium that is produced as a by product to the zinc. Figure 8 illustrates a pilot scale flow sheet operated for the recovery of gallium and germanium at Clarksville, Tennessee [25].
Figure 7:Stages of zinc processing [24].
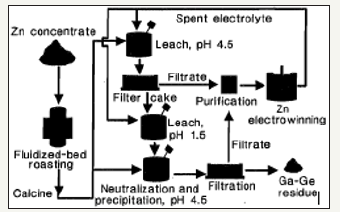
Figure 8:Clarksville ion exchange & electro winning flow sheet.
Indium
Indium was first discovered in Saxony, Germany by two German chemists which were testing zinc ores from a local mine. It is no coincidence that the Indium was located when analyzing zinc ores because Indium is most commonly associated with zinc deposits [25]. Sphalerite (ZnS) is the most important indium bearing mineral and is the source for most of the indium currently mined in the world. Eighty percent of world Indium reserves are part of either volcanic or sediment hosted massive sulfide deposits [25]. This is very convenient for production of Indium as these deposits are also often associated with economic concentrations of copper and zinc. Despite the distribution of indium in sulfide deposits, the United States does not currently have any primary production of indium and has a 100% import reliance for indium [26]. There are no primary mines for indium, so it is primarily recovered as a part of zinc processing. Because of this, world production values are presented as refinery production values rather than mine production values. Table 5 shows the world refinery production and reserves for indium as reported by the USGS Figure 9.
Table 5:World refinery production and reserves of Indium [27].
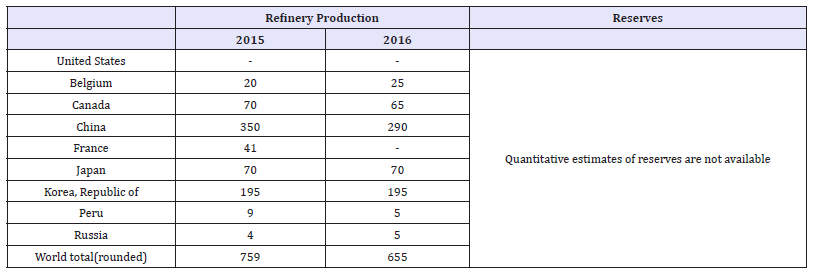
Figure 9:Generalized flow sheet for the beneficiation and purification of indium from zinc concentrate [25].
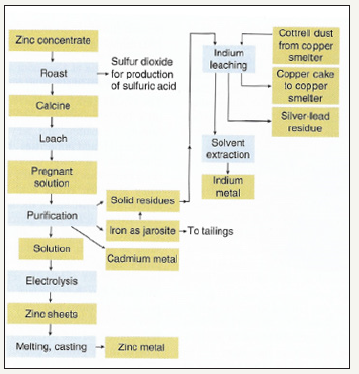
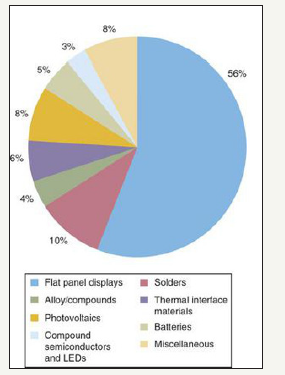
In this generalized flow sheet, indium is recovered as a part of the jarosite creation process. The jarosite process is a process in which iron sulfate is formed to remove iron from the system before electrolysis can be performed. The jarosite process for zinc refining scavenges about 60% of the available indium in the concentrate [25]. From this point, the indium is leached and recovered through a solvent extraction process. Indium is used in a wide variety of applications but as of 2010, the primary use for indium was in liquid crystal displays (LCD). Figure 10 shows the main end uses of indium in 2010.
In this generalized flow sheet, indium is recovered as a part of the jarosite creation process. The jarosite process is a process in which iron sulfate is formed to remove iron from the system before electrolysis can be performed. The jarosite process for zinc refining scavenges about 60% of the available indium in the concentrate [25]. From this point, the indium is leached and recovered through a solvent extraction process. Indium is used in a wide variety of applications but as of 2010, the primary use for indium was in liquid crystal displays (LCD). Figure 10 shows the main end uses of indium in 2010.
Figure 10:Main end uses of indium as of 2010 [25].
Vanadium
Vanadium is a minor metal that is most commonly used in steelmaking but also has applications as a pigment for ceramics and glass. Steels alloyed with as little as 1% vanadium and as much chromium are shock and vibration resistant and have much higher strength properties than steel without similar additions. Vanadium alloys can also sometimes be used in nuclear reactors because of its low neutron absorbing properties. Although vanadium is relatively abundant in the Earth’s crust, it is so widely and thinly distributed that it is most commonly only mined as a by product to other minerals and metals. Although some primary vanadium mines do exist around the world, this paper will only focus on the by product production of vanadium.
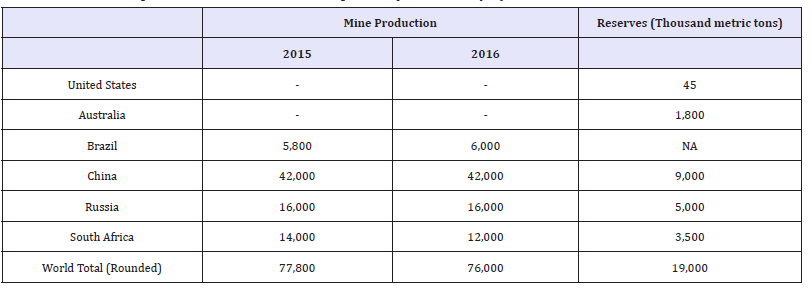
According to the 2015 Minerals Yearbook produced by the United States Geologic Survey (USGS), most of the world’s supply of vanadium was derived from mined ore. It is produced either directly as a mineral concentrate derived from vanadiferous titanomagnetite (VTM) or from steelmaking slags, where the steel was produced from VTM [26,27]. In 2015, vanadium was recovered from ores, concentrates, slag, or petroleum residues in five countries. The leading vanadium producing nations are China, Russia, and South Africa, accounting for 93% of world production [27]. Table 6 shows the world mine production and reserves for vanadium as reported by the USGS. In 2016 the United States had a 100% net import reliance on vanadium according to the USGS [28].
Table 6:World mineproduction and reserves as reported by the USGS [28].
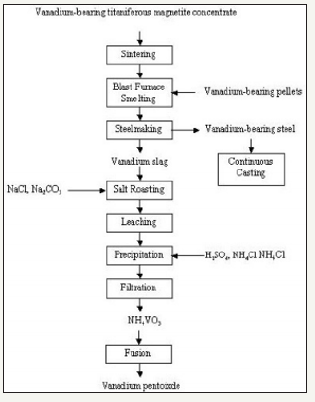
Vanadium can be recovered from VTM ores by two main processes: precipitating vanadium salt from a leach of a salt-roasted ore, or precipitation from a leach of salt-roasted slag obtained after smelting the ore to make a vanadium bearing pig iron followed by an oxygen blow in a converter to form the vanadium rich slag [29]. Different countries employ slightly different processes that are tailored to their specific VTM ore; however, the fundamentals behind the process closely match the brief description above. A flow sheet for the process of refining VTM using the second method listed above is shown in Figure 11. This flow sheet is based on the process employed at Chengde China.
Figure 11:Processing VTM at Chengde China [29].
Manganese
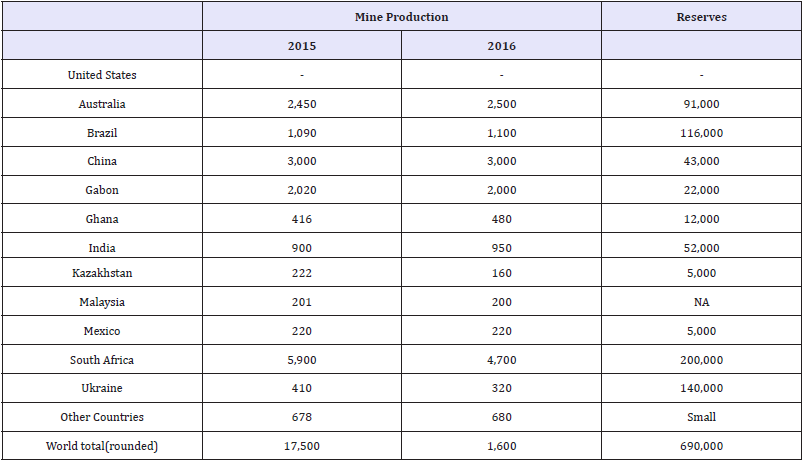
Manganese is an irreplaceable element for modern industrial economies. It is an important element because of its desulfurizing, deoxidizing, and alloying properties, as well as some other notable chemical properties. Manganese is primarily used as an alloying addition in steel. Although manganese is used in relatively small quantities in the steel making process, it is critically important to the process and no known substitutes currently exist. The United States does not currently have any domestic production of manganese and has not had a domestic production of the metal for several decades. This leads to the United States having 100% net import reliance for manganese as reported by the USGS [30]. Although the Unites States does not have any domestic production of manganese, there is no world shortage of the metal. South Africa, China, and Australia are the three largest producers of manganese in the world though other countries also produce it. Table 7 shows the world mine production and reserves for manganese as reported by the USGS [30].
Table 7:World mineproduction and reserves for manganese as reported by the USGS [30].
While manganese is a metal that is usually mined as a primary product in a mine, interest has recently turned to ferromanganese nodules as a possible by product source for manganese. These nodules contain roughly 20 to 30 percent manganese as well as iron, copper, nickel, and other metals of interest [31-33]. The biggest technological hurdle with the nodules is their location. Most commonly, these nodules are found at the bottom of oceans around the world. Because of this factor, the manganese content within the nodule would not be enough to mine these nodules for the manganese alone. The manganese would be recovered as a by product to the iron, copper, nickel and other metals found in these nodules.
Graphite
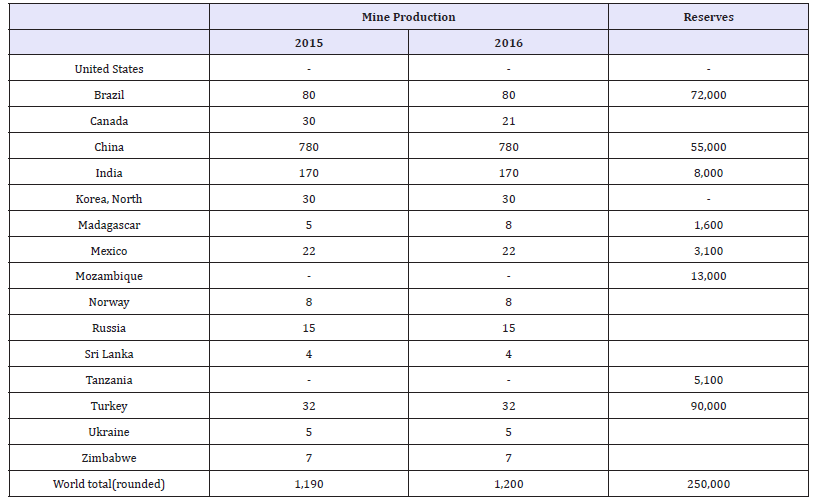
Graphite is a soft form of pure carbon that normally occurs as black crystal flakes or masses. It is an industrial mineral that is only produced in small amounts around the world. Graphite has important properties, such as chemical inertness, thermal stability, high electrical conductivity, and lubricity that make it suitable for a wide range of industrial applications, including electronics, lubricants, metallurgy, and steelmaking. For some of the listed applications, no suitable substitutions currently exist. The United States currently has 100% import reliance for graphite. Table 8 shows the worldwide mine production and reserves for graphite.
Table 8:Worldwide mineproduction and reserves for graphite as reported by the USGS [32].
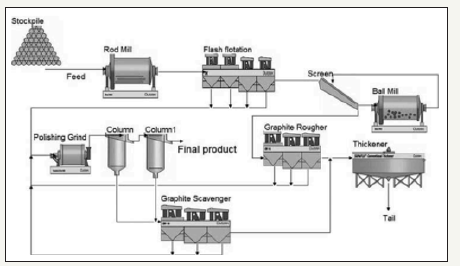
Graphite currently does not have large amounts of by-product production. Most of the graphite produced around the world is produced using primary production methods. Graphite is typically produced by combining a simple rougher flotation step with several cleaner stages and scavengers. Graphite recovery flow sheets also often include screening with regrind to recover as much materials as possible. Figure 12 shows a simplified flow sheet of graphite processing.
Figure 12:Simplified flow sheet for graphite recovery [33].
Platinum Group Metals
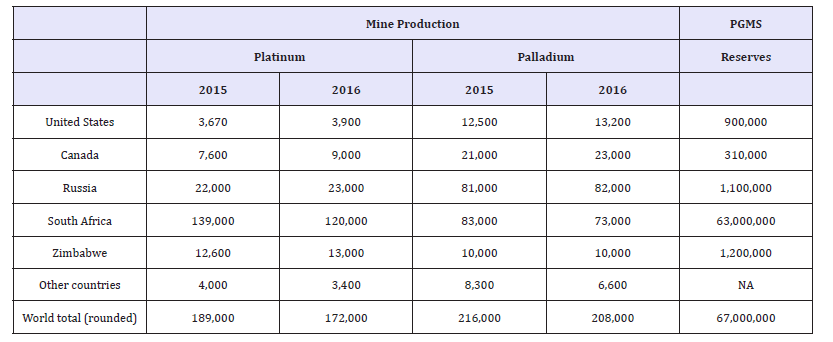
The six chemical elements that are normally referred to as platinum-group metals (PGM) are: ruthenium, rhodium, palladium, osmium, iridium and platinum. The PGM are rare, precious metals that are used in a diverse range of industrial applications as well as in jewelry. The most widely used PGMs are gold, platinum, palladium, and rhodium. Although Rhodium is an important material in automobile catalysts, its use is an order of magnitude less than that of platinum and palladium [34,35]. Platinum, palladium, and rhodium are primarily used in auto catalysts to convert noxious emissions from car exhausts to harmless non-toxic products. Because of increasingly stringent emissions standards around the world, the demand for PGM catalysts has grown remarkably since the 1970s. The importance of PGMs in catalysts and other clean energy devices has led PGMs to be determined as critical by the European Union [1,2]. The United States also reported a net import reliance of 73% and 48% for platinum and palladium, respectively, in 2016 [35]. Table 9 shows the world mine production and reserves for PGMs as reported by the USGS.
Table 9:World mineproduction and reserves for PGMs [35].
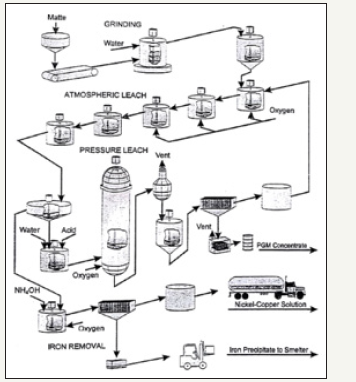
group metals are often mined in primary settings but are also sometimes companion metals to copper, zinc, and lead/ zinc mines [3]. Currently, PGM are recovered from three sources: primary PGM mines, by products of nickel, copper, zinc, and lead, and from secondary (recycled) sources [36]. When PGMs are extracted from nickel-copper dominant ores, the ore is first ground and concentrated using flotation. After flotation is performed, the resulting concentrate is sent to a smelter and a copper-nickel-PGM matte is produced. This matter is then ground and subjected to pressure leaching to concentrate metals of interest. The concentrate, which contains almost all the PGMs is then further refined using electro refining. The PGMs are dropped to the bottom of the electro refining tank and are then recovered using further electro winning. By product refinement methods for PGMs are closely guarded by refineries but the general flow as described above is usually performed [37-39]. A generalized flow sheet of the recovery of PGMs from Stillwater Mining Company is shown in Figure 13.
Figure 13:Stillwater Base Metals Refinery flow sheet [38].
Conclusion
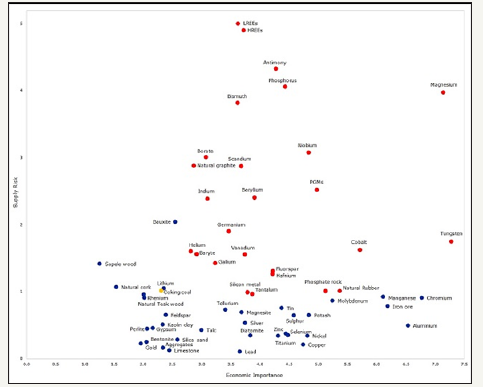
Critical materials are so labeled because they are of large importance to modern engineered objects but are subject to supply risks. Figure 14 summarizes a recent European Union assessment. As outlined in this paper, many options for byproduct production of critical materials exist. While all critical materials have a potential byproduct source, more research must be completed to optimize these procedures. Byproduct production of these materials will be able to help alleviate supply shortages.
Figure 14:European Commission 2017 Critical Raw Materials Matrix. [40]
Acknowledgement
This work is supported by the Critical Materials Institute, an Energy Innovation Hub funded by the U.S. Department of Energy, Office of Energy Efficiency and Renewable Energy, Advanced Manufacturing Office.
References
- Eggert RG (2016) IMPC 2016 : XXVIII International Mineral Processing Congress Proceedings ISBN : 9781926872292 Page 1 of 10 Published by the Canadian Institute of Mining, Metallurgy and Petroleum IMPC 2016 : XXVIII International Mineral Processing Congress Proceedig, pp. 1-10.
- Espinoza LT, Gandenberger C. Critical raw materials and the EU, pp. 737- 745.
- Nassar NT, Graedel TE, Harper EM (2015) By product metals are technologically essential but have problematic supply. Science Advances 1(3): 1-11.
- Roberts S, Gunn G (2014) Chapter 6 Cobalt, in critical metals handbook. In: Gunn G (Ed.), (1st edn), John Wiley & Sons, Ltd, Chichester, England, pp. 122-149.
- Queneau PE, Roorda HJ (1971) Cobalt from nickeliferous limonites. Min Eng, pp. 70-73.
- Moskalyk RR, Alfantazi AM (2001) Review of present cobalt recovery practice. Minerals Engineering 17(10): 893-919.
- USGS (2017) Mineral commodity summaries cobalt, USA.
- Fisher KG (2011) Cobalt processing developments, pp. 237-258.
- Ville Marie P (2016) IMPC 2016: XXVIII International Mineral Processing Congress Proceedings ISBN: 9781926872292 Page 1 of 10 Published by the Canadian Institute of Mining, Metallurgy and Petroleum IMPC 2016: XXVIII International Mineral Processing Congress Proceedig, p. 110.
- USGS (2017) Mineral Commodity Summary Rare Earths.
- Krishnamurthy N, Gupta CK (2016) Extractive metallurgy of rare earths. In: (2nd Edn) Taylor and Francis Group, LLC, Boca Raton, Florida, USA.
- Li, X. Yang (2014) China’s rare earth ore deposits and beneficiation techniques, 1st Eur. Rare Earth Resour Conf, pp. 26-36.
- Sandstrom A, Fredriksson A (2012) Apatite for Extraction Leaching of Kiirunavaara Apatite for Simultaneous Production of Fertilizers and Ree, IMPC XXVI, pp. 4707-4714.
- Evans K (2014) Chapter 10 Lithium, in critical metals Handbook. In: Gunn G (Ed.), (1st edn), John Wiley & Sons, Ltd, Chichester, England, pp. 230-261.
- Jaskula BW (2017) Mineral Commodity Summaries Lithium.
- Laughlin W, Adams TS (1999) Li Reclamation Process, 5888463.
- Butcher T, Brown T (2014) Chapter 7 Gallium, in critical metals Handbook. In: Gunn G (Ed.), (1st edn), John Wiley & Sons, Ltd, Chichester, England, pp. 150-176.
- Geological Survey (2017) Gallium, USA
- Phipps G, Mikolajczak C, Guckes T (2008) Indium and Gallium: Long Term Supply, PV/CIGS Mater, pp. 56-59.
- Mikolajczak C (2009) Availability of Indium and Gallium, p. 14.
- Melcher F, Buchholz P, Chapter 8 Germanium in Critical Metals Handbook, In: Gunn G (Ed.), (1st edn), John Wiley & Sons, Ltd, Chichester, England, pp. 177-203.
- Guberman DE (2017) Mineral commodity summary germanium.
- Van L, Dreisinger DB (1994) Germanium: an aqueous processing review, Vancouver, Canada.
- Harbuck DD (1992) Gallium and germanium recovery from domestic sources, USA.
- Fayram TS, Anderson CG (2008) The development and implementation of industrial hydrometallurgical gallium and germanium recovery. Journal of The Southern African Institute of Mining and Metallurgy 108(5).
- Schwarz U (2014) Chapter 9 Indium in critical metals Handbook. In: Gunn G (Ed.), (1st edn), John Wiley & Sons, Ltd, Chichester, England, pp. 204-229.
- US Geological Survey (2017) Mineral commodity summaries indium. Miner Commod Summ, pp. 2016-2017.
- Polyak DE (2016) Minerals Yearbook, Vanadium, US Geol Surv Miner.
- USGS (2017) Mineral commodity summaries: vanadium, Miner Commod Summ 703: 182-183
- Taylor PR, Shuey SA, Edgar E, Vidal W, Wang, et al. (2005) Extractive metallurgy of vanadium containing titaniferous magnetite ores: A Review, SME Annu Meet, pp. 1-9.
- USGS (2017) Mineral commodity summaries: manganese. Miner Commod Summ 703: 106-107
- Cannon WF, Kimball BE, Corathers LA (2017) Manganese, in critical mineral resources of the United States economics and environmental geology and prospects for future supply. In: Schulz KJ, DeYoung JH, Bradley DC, Seal RR (Eds.), Reston: United States Geologic Survey, USA.
- USGS (2017) Mineral commodity summaries: graphite (natural). Miner Commod Summ 703: 2016-2017.
- Chehreh C, Rudolph M, Kratzsch R, Sandmann D, Gutzmer J (2016) A Review of graphite beneficiation techniques, miner. process. Extr Metall Rev 37(1): 58-68.
- Gunn G (2014) Chapter 12 Platinum group metals, in critical metals Handbook. In: Gunn G (Ed.), (1st edn), John Wiley & Sons, Ltd, Chichester, England, pp. 284-312.
- US Geological Survey (2017) Mineral Commodity Summaries Platinum Group Metals, USA.
- Wilburn DR, Bleiwas DI (2004) Platinum Group Metals World Supply and Demand, USA.
- Craig JR, Rimstidt JD (1998) Gold production history of the United States. Ore Geol Rev 13: 407-464.
- Newman L, Makwana M (1997) PGM Flow sheet. PDF, in hydrometallurgy and refining of Nickel and Cobalt. In: First WC Cooper I, Mihaylov I (Eds.), Canadian Institute of Mining, Metallurgy, and Petroleum, Montreal, Canada, pp. 31-47.
- European Commission, 2018, http://ec.europa.eu/growth/sectors/ raw-materials/specific-interest/critical_en
© 2018 Corby G Anderson. This is an open access article distributed under the terms of the Creative Commons Attribution License , which permits unrestricted use, distribution, and build upon your work non-commercially.
 a Creative Commons Attribution 4.0 International License. Based on a work at www.crimsonpublishers.com.
Best viewed in


.jpg)


 Editorial Board Registrations
 Submit your Article
 Refer a Friend
 Advertise With Us
.jpg)


.jpg)


.bmp)
.jpg)
.png)
.jpg)


.jpg)


.png)

.png)


.png)


