- Submissions

Full Text
Associative Journal of Health Sciences
Characterizing Fine Particulate Air Pollution at Two Urban Elementary Schools: A Pilot Study of Arrival and Departure Environments
James D Johnston*, Robert A Chaney and Lori A Spruance
Department of Public Health, Brigham Young University, Provo, USA
*Corresponding author: James DJohnston, Associate Professor, 2045 Life Sciences Building, Department of Health Science, Brigham Young University, Provo, Utah, USA
Submission: January 7, 2021;Published: January 27, 2021

ISSN:2690-9707 Volume1 Issue3
Abstract
The purpose of this pilot study was to characterize arrival and departure environments based on fine particulate matter (PM2.5) air pollution concentrations at two elementary schools. Ambient PM2.5 was measured at the school front door, arrival/departure areas, street adjacent to the school, and in accompanying play fields (background). The overall average ratio of PM2.5 to background at School-A (1.64) was less than at School-B (1.69) (t(35721)=2.52, p=0.01). PM2.5 to background ratios were higher in the morning (1.80) than afternoon (1.43) (t(36434)=21.13, p<0.001). This study found a “plume” of PM2.5 centered in the arrival/departure location at both schools. For morning PM2.5 measures, arrival/departure locations were the highest at both schools, followed by front door, whereas, in the afternoon, street measures were the highest. Solutions include encouraging idle-free zones, carpooling and encouraging active travel along low-traffic routes.
Keywords: Particulate pollution; Fine particulate matter; School health; Children’s environmental health; Commuting exposure
Abbreviations: PM2.5 -Fine particulate matter
Introduction
Elementary school-age children are uniquely vulnerable to fine particulate air pollution (PM2.5). Children inhale significantly higher doses of air pollution than do their adult counterparts due to higher respiration rates, increased mouth breathing, physical activity levels, and more time spent outdoors [1,2]. Children living in areas with chronically elevated PM2.5 are more likely to suffer respiratory deficits including decreased lung function [3,4]. Furthermore, increased exposure to particulate matter is associated with lower respiratory, asthma-related symptoms in schoolchildren, particularly for sulfate particles below the 2.5μm cut-point [5]. Studies show there is great variability between indoor (school and home) and ambient PM2.5 levels [6,7]; however, due to differences in pollution constituents, ambient PM2.5 appears to be more hazardous than indoor PM2.5 [8,9]. Schoolchildren between ages 5-10 spend approximately 22% of their time outdoors or in a vehicle [10]. Thus, understanding daily microenvironment and activity-dependent PM2.5 exposures that occur outside of home or school may be useful to inform future intervention measures to protect schoolchildren.
To date, there is little published data on schoolchildren’s air pollution exposures before and after school, when they are more likely to spend time outdoors. Pollution levels are often higher when children are commuting to school due to diurnal boundary layer patterns and higher traffic volume [11-13]. Once at school, school bus and vehicle exhaust associated with school arrivals and departures expose children to air pollution as they enter and leave the school [14-16]. Furthermore, depending on weather conditions, some children may spend several minutes outside near arrival/departure zones before and after school waiting for rides or visiting with other students while in this pollution microenvironment. Utah currently has the highest birth rate among all U.S. states [17]. The most densely populated communities in the State are located in Northern Utah, which has a mountainous geography and high traffic volumes along the Interstate-15 corridor. These factors contribute to seasonally high PM2.5 levels in the region. However, to our knowledge there are no studies reporting microenvironment exposures around schools in the Intermountain West. The purpose of this study, therefore, was to characterize PM2.5 levels around two elementary schools in Utah County, Utah.
Methods
Provo is the third largest municipality in Utah, with a population of 116,199 [18,19]. The population density in Provo is 1076.67 people/km2 (2788.56 people/mi2) [19,20]. Air pollution samples were collected at two Provo elementary schools. We choose these schools because they represent the highest and lowest socioeconomic schools in the school district. School names have been masked, being referred to as School-A and School-B. Overall, Provo City, had a median household income of $39,688, 44.3% owneroccupied homes, and 42.5% hold bachelor’s degree (or greater). For School-A, the median household income was $78,281, 81.1% owner-occupied homes, and 57.8% hold bachelor’s degree (or greater); and School-B had a $37,347 median household income, 41.3% owner-occupied homes, and 19.8% hold bachelor’s degree (or greater) [21-24].
Ambient PM2.5 was measured with stationary TSI SidePak AM510 personal exposure monitors (TSI, Inc., Shoreview, MN, USA) placed near the schools’ front doors, arrival/departure areas, street adjacent to the schools, and in accompanying play fields (as background measure). The inlet for the SidePak stationary monitor was located roughly 0.9m (3ft.) off the ground on a stand. Data collection occurred from April 16th-April 26th, 2018. Monitoring was conducted for 15 minutes prior to school commencing (8:35- 8:50am for School-A, 8:25-8:40am for School-B) and 15 minutes after school release (3:30-3:45pm for School-A, 3:20-3:35pm for School-B). Prior to sampling each day, the instruments’ internal clocks were set to the lab computer date/time. We also cleaned and greased the impaction plates, calibrated pump flow rates to 1.7L/ min with a Defender 510 volumetric flow calibrator (Mesa Labs, Butler, NJ, USA), zeroed the 670nm laser using an in-line HEPA filter, and charged the batteries. Following data collection, we recorded post-calibration pump flow rates. Pre- and post-calibrations were within ±5% of 1.7L/min. SidePak AM510 instruments were calibrated by the manufacturer to ISO 12103-1 A1 test dust (Arizona road dust) prior to using them in this study.
Data were cleaned by matching all stationary by date and second. The detection limit of the SidePak recorded by TSI is 0.001mg/m3 with a zero stability of ±0.001mg/m3 over 24 hours. In order to account for this known limit, readings below 0.001mg/m3 were recoded as 0.0007mg/m3, which is the detection limit divided by the square root of two. This allowed us to use readings where the SidePak read 0mg/m3 due to the monitor’s inability to detect particle counts that low (the particle count is never truly zero) and proceed with analysis at those time points. We then calculated the ratio of each commuting type to the background levels recorded at each second. The ratios were averaged and reported along with standard errors for overall particulate exposures by school, time of day, and monitor location. Statistical differences between groups were calculated using t-tests and ANOVA within R (v 3.5.0) [25].
Results
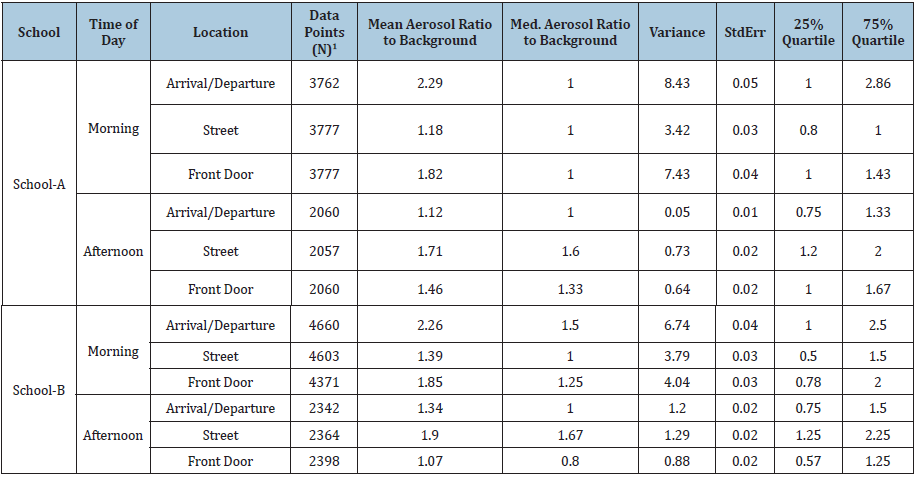
The overall average ratio of PM2.5 to background at School-A (1.64) was less than at School-B (1.69) (t(35721)=2.52, p=0.01). Mean concentrations ranged from 1.48μg/m3 to 9.53μg/m3 (overall mean concentration 5.56μg/m3). All monitor locations were statistically different than the background monitor measures. The number of data points (seconds), means, medians, variances and standard errors of the ratios of PM2.5 by school, time of day, and monitor type are shown in Table 1. PM2.5 to background ratios were higher in the morning (1.80) than afternoon (1.43) (t(36434)=21.13, p<0.001). Time of day concentrations were different within schools, with morning monitoring having greater mean aerosol ratios [School-B-morning (2.90), afternoon (1.38), t(24337)=32.48, p<0.001; School-A-morning (4.91), afternoon (1.83), t(17379)= 30.42, p<0.001]. The overall average PM2.5 ratio was highest for morning arrival areas at School-B (2.29) and lowest for afternoon front door at School-A (1.07).
Table 1: Descriptive statistics for school zone/background PM2.5 ratios by campus location. 1SidePak AM510 personal exposure monitors (TSI, Inc., Shoreview, MN, USA) were set to record measurements every second.

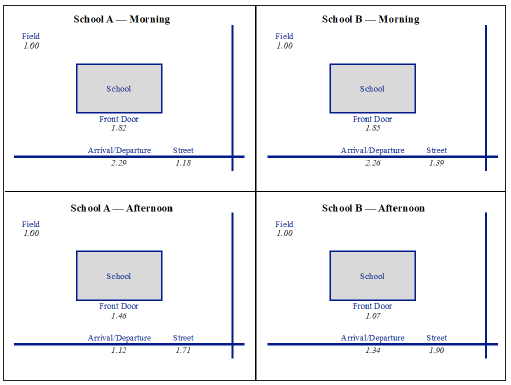
Mean ratio between schools, time of day, and monitor location are shown in Figure 1 (a generic aerial figure is being used to preserve school anonymity). Overall arrival/departure ratios were nearly significant between schools [School-B (1.95), School-A (1.87), t(11999)=1.87, p=0.06]. They were significantly different in the afternoon [School-B (1.34), School-A (1.11), t(3956.9)=8.37, p<0.001] but not the morning. Overall front door ratios were significantly different between schools [School-B (1.57), School-A (1.69), t(10949)=-3.20, p=0.001] even though only afternoon times were significantly different between schools [School-B (1.07), School-A (1.46), t(4455.5)=-14.93, p<0.001]. Street ratios were greater for School-B [School-B (1.56), School-A (1.37), t(12691)=6.51, p<0.001]. Results were consistent between morning [School-B (1.39), School-A (1.18), t(8203.3)=4.84, p<0.001] and afternoon times [School-B (1.90), School-A (1.71), t(4330.7)=6.41, p<0.001].
Figure 1: School PM2.5 concentration ratio to background level (Field) and monitor locations by time of day. The figure demonstrates the “plume” effect near the arrival/departure area of the school.

Discussion
Overall, this study found significant air pollution concentration differences between school arrival/departure sites, and that all monitor locations were higher than background. Morning arrival/ departure locations posed the greatest risk for student exposure, followed by morning front door location, and afternoon street. These findings add to prior work characterizing the variability, and corresponding risk, in exposure between environments, both in terms of micro-environments and systematic environmental differences [6,7,12]. School-B had higher overall mean PM2.5 to background ratios than School-A. We offer two possible explanations. First, School-B is located nearer to the urban city center and is more proximal an Interstate freeway compared to school-A. Second, our anecdotal observations suggest that School-A had many more students being driven to school, often in non-carpooling vehicles, whereas School-B tended to have more walking students. Though traffic volume for this area was unavailable, we suspect it to have an important influence on PM2.5 near School-B.
Prior work done in Cincinnati, Ohio describes high particulate matter due to busses [14,15]. Our study sites had few diesel busses that travel near them, but these findings confirm that schools tend to have a “plume” near the front door and arrival/departure areas linked to vehicular traffic. Future work should expand upon this pilot study by examining multiple schools in diverse neighborhoods. Though our study, as a pilot, is limited in scope, higher PM2.5 concentrations were observed at School-B, which is of significantly lower neighborhood-level socio-economic status compared with School-A. An additional expansion could include the students’ commuting environment, including exposure students experience while walking to school [12,26,27].
Discussion
Our recommendations are to encourage drop-offs/pickups further away from the front door of the school as well as for schools to encourage carpooling (i.e., taking more than one child to school from the neighborhood) and not waiting with an idling engine in the “pick up line.” Anti-idling campaigns may help reduce the air pollution plume around schools. Ryan PH et al. [28] showed this type of campaign was effective in reducing air pollution levels around one school with high bus traffic [28]. Public health practitioners should holistically consider the school environment when promoting health and safety. This consideration includes adult behaviors that affect school children such as idling or driving a child to school.
Acknowledgement
We thank the Provo School District for their support of this project.
Conflict of Interest
The authors have no financial interest in this project or conflicts of interest to declare.
References
- Bateson TF, Schwartz J (2007) Children’s response to air pollutants. J Toxicol Environ Health A 71(3): 238-243.
- Plunkett LM, Turnbull D, Rodricks JV (1992) Differences between adults and children affecting exposure assessment. In: Guzelian PS, Henry DJ, Olin, SS (Eds.), Similarities and Differences between Children and Adults: Implications for Risk Assessment, ILSI Press, USA, 21(5): 79-94.
- Barraza V, Sunyer J, Hernandez C, Escamilla NL, Sienra M, et al. (2008) Air pollution, airway inflammation, and lung function in a cohort study of mexico city schoolchildren. Environ Health Perspect 116(6): 832-838.
- James GW, Urman R, Edward A, McConnell R, Rappaport E, et al. (2015) Association of improved air quality with lung development in children. N Engl J Med Boston 372(10): 905-913.
- Schwartz J, Neas LM (2000) Fine particles are more strongly associated than coarse particles with acute respiratory health effects in schoolchildren. Epidemiology 11(1): 6-10.
- Ashmore MR, Dimitroulopoulou C (2009) Personal exposure of children to air pollution. Atmos Environ 43(1): 128-141.
- Wichmann J, Lind T, Nilsson M, Bellander T (2010) PM5, soot and NO2 indoor-outdoor relationships at homes, pre-schools and schools in Stockholm, Sweden. Atmos Environ 44(36): 4536-4544.
- Allen RW, Mar T, Koenig J, Liu LJ, Gould T, et al. (2008) Changes in lung function and airway inflammation among asthmatic children residing in a woodsmoke-impacted urban area. Inhal Toxicol 20(4): 423-433.
- Ebelt ST, Wilson WE, Brauer M (2005) Exposure to ambient and nonambient components of particulate matter: A comparison of health effects. Epidemiology 16(3): 396-405.
- Cohen EA, Sheldon LS, Burke JM, McCurdy TR, Berry, et al. (2000) Children’s exposure assessment: A review of factors influencing children’s exposure, and the data available to characterize and assess that exposure. Environ Health Perspect 108(6): 475-486.
- Aryal RK, Lee BK, Karki R, Gurung A, Baral B, et al. (2009) Dynamics of PM5 concentrations in Kathmandu Valley, Nepal. J Hazard Mater 168(2-3): 732-738.
- Chaney RA, Sloan CD, Cooper VC, Robinson DR, Hendrickson NR, et al. (2017) Personal exposure to fine particulate air pollution while commuting: An examination of six transport modes on an urban arterial roadway. PLoS One 12(11): e0188053.
- Zhang YL, Cao F (2015) Fine particulate matter (PM5) in China at a city level. Sci Rep 15(5): 14884.
- Hochstetler HA, Yermakov M, Reponen T, Ryan PH, Grinshpun SA (2011) Aerosol particles generated by diesel-powered school buses at urban schools as a source of children’s exposure. Atmos Environ 45(7): 1444-1453.
- Li C, Nguyen Q, Ryan PH, LeMasters GK, Spitz H, et al. (2009) School bus pollution and changes in the air quality at schools: A case study. J Environ Monit 11(5): 1037-1042.
- Richmond BJ, Bukiewicz L, Kalin R, Galarraga C, Mirer F (2011) A multi-site analysis of the association between black carbon concentrations and vehicular idling, traffic, background pollution, and meteorology during school dismissals. Sci Total Environ 409(11): 2085-2093.
- Martin JA, Hamilton BE, Osterman MJK, Driscoll AK, Drake P (2018) Births: Final data for 2017. Natl Vital Stat Rep 67(8): 1-50.
- University of Utah Kem C (2015) Gardner policy institute: US census bureau 2015 population estimates: Utah, USA.
- US Census Bureau: ACS age and sex 2013-2017 estimates: Provo, USA.
- Utah GIS Portal: Municipal boundaries, USA.
- US Census Bureau (2013) Median household income in the past 12 months (in 2013 inflation-adjusted dollars): Provo city, USA.
- US Census Bureau: Educational attainment 2013-2017 American community survey 5-year estimates: Provo city, USA.
- US Census Bureau: Total population in occupied housing unit by tenure universe: Total population in occupied housing units 2009-2013 American Community Survey 5-Year Estimates: Provo city, USA.
- US Census Bureau: US census bureau-Census explorer, USA.
- R Development Core Team: R: A language and environment for statistical computing, USA.
- Chillón P, Panter J, Corder K, Jones AP, Van Sluijs EMF (2015) A longitudinal study of the distance that young people walk to school. Health Place 31: 133-137.
- Rahman T, Cushing RA, Jackson RJ (2011) Contributions of built environment to childhood obesity. Mt Sinai J Med 78(1): 49-57.
- Ryan PH, Reponen T, Simmons M, Yermakov M, Sharkey K, et al. (2013) The impact of an anti-idling campaign on outdoor air quality at four urban schools. Environ Sci Process Impacts 15(11): 2030-2037.
© 2020 James DJohnston. This is an open access article distributed under the terms of the Creative Commons Attribution License , which permits unrestricted use, distribution, and build upon your work non-commercially.
 a Creative Commons Attribution 4.0 International License. Based on a work at www.crimsonpublishers.com.
Best viewed in


.jpg)


 Editorial Board Registrations
 Submit your Article
 Refer a Friend
 Advertise With Us
.jpg)


.jpg)


.bmp)
.jpg)
.png)
.jpg)


.jpg)


.png)

.png)


.png)


