
- About Us
- Information
-

The Author ensures that the research has been conducted responsibly and ethically with adherence to all relevant regulations. read more..
- For Authors
- For Reviewer
- Manuscript Guidelines
- Membership
- Publication Ethics
-
- Journals
- Reprints
- e-Books
- Videos
- Policies
- Contact Us
 COVID-19
- Submissions


Full Text
Annals of Chemical Science Research
Analysis of a Pet-Based Polymer Paper Sample and its Identification with an Infrared Absorption Spectrum, Differential Scanning Calorimetry Analysis and a Reflectance Graph
Κaterina Chryssou* and Eugenia Lampi
General Chemical State Laboratory, Β΄ Chemical Service of Athens, Department A΄ An. Tsocha 16, Greece
*Corresponding author:Κaterina Chryssou, General Chemical State Laboratory, Β΄ Chemical Service of Athens, Department A΄ An. Tsocha 16, Greece
Submission: April 18, 2023;Published: May 02, 2023

Volume4 Issue1May , 2023
Abstract
Paper printed matter of vehicle registrations was analyzed to find the content of synthetic fiber, polyester present in it by the sulfuric acid method 75% by weight. The total content of the synthetic fiber, polyethylene terephthalate (PET), present in it was found to be 36.3% by weight on dry mass of the finished product. Fluorescent fibers visible only in the ultraviolet were contained in the paper mass and were counted to be 0.10%w/w red fibers and 0.13%w/w green fibers. The endothermic peak in the DSC curve of PET present was observed at 261.7 ˚C or 534.85K. The FT-IR spectrum of the sample showed the ester group at 1728.45cm^-1. The mechanical properties of the paper sample of vehicle registrations were determined, like its puncture resistance at 848KPa. The folding endurance was found to be greater than 40,000 in the machine direction and greater than 20,000 in the counter machine direction with 0.5Kg applied tension. The tensile strength of the dry specimen was determined to be 86.9N in the machine direction and 85.8N in the counter machine direction. The tensile strength of the wet specimen was found to be 30.5% of the tensile strength of the dry specimen of the paper sample of vehicle registrations. The band gap of the material of paper vehicle registrations was estimated to be 1.165616495929150eV for permitted indirect transitions using the Kubelka-Munk function and reflectance measurements.
Keywords:Sulfuric acid method 75% by weight; Mechanical properties of paper; Tensile strength; Bursting strength; Tearing resistance; Differential scanning calorimetry (DSC); Polyethylene terephthalate (PET); Reflectance graph; Band gap
Introduction
The blending of synthetic polymers with a natural polymer such as cellulose fibers has been extensively employed to develop new polymeric materials with special advantages [1]. Paper and plastic are blended together to create a new material with different physical properties. Such polymeric composites have thus good tensile strength, bursting strength and tearing strength. They have new and superior properties thermal and mechanical compared with conventional paper materials [2]. To a first approximation the mechanical properties are additive [3]. Besides, paper sized with starch constitutes an ancient polymer blend [4]. Interest in synthetic polymer materials has been arisen principally from the ability to modify mechanical properties and to tailor properties for particular applications such as the high folding endurance, and tearing resistance of the paper sample of vehicle registrations, as well as to prolong the life of the paper material.
Poly(ethylene terephthalate) (PET) is a commercial thermoplastic polyester polymer that has been widely used in the textile industry owing to its excellent mechanical properties and chemical resistance [5-7]. Although PET is widely available and used in fiber and film, and with good thermal properties, because of its high crystallinity and poor water absorptivity, it has a low electrical conductivity [8] and like paper is inherently an electrical insulator. PET has characteristic high strength, transparency and safety. The textile fiber grade PET has a molecular weight of 15,000g/mol to 30,000g/mol and provides stiffness, toughness and creep resistance, giving sufficient flexibility to resist bursting and breaking under pressure [9].
The main application of PET by far is in the textile industry [10,11] and in this work, the cellulosic fibers of the paper sample of vehicle registrations were blended with PET. In order to determine the percentage of PET present in the end product of the paper sample, the product was dissolved with 75%w/w sulfuric acid [9] from a known dry mass of the mixture of it. The residue was collected, washed, dried and weighed. Its mass was expressed as a percentage of the dry mass of the mixture of cellulosic and polyester fibers. The ratio of dry cellulosic and polyester fibers were found from the difference. In this study, the end product was observed under an optical microscope and put under various mechanical tests to assess its endurance. The infrared spectrum of the sample of vehicle registrations will be recorded as well as thermal analysis of the end product will be conducted by differential scanning calorimetry. Differential scanning calorimetry [12] is a powerful analytical tool for the identification of the physical properties and thermal transitions of polymeric materials such as cellulose and PET. Finally, the reflectance graph of the paper sample of vehicle registrations will be recorded and calculation of the energy band gap will be studied.
Experimental
Equipment and Reagents
Apparatus
A drying oven Memmert GmbH UNE 400 was used which was capable of maintaining air temperature at 105 ˚C ± 2 ˚C and it was ventilated to maintain uniform temperature and extract the moisture from the paper sample pieces. An oven Memmert direct, capable of being controlled at 103 ˚C ± 2 ˚C was used for heating the glass crucible with the fiber residue in it to constant mass. Electronic balance Sartorius Basic plus AG Göttingen Germany BP 221S, with maximum capacity 220g, precision of four decimal places and accuracy to 0.1mg was used for weighing.
The differential scanning calorimetry (DSC) instrument used consisted of a thermal scanning chamber and a computer. The program on the computer was Pyris series-DSC 7. Two pans were used for heating in the thermal scanning furnace chamber. The first pan was used to hold the sample, while the second pan remained empty and was used as a reference. The purge gas used was nitrogen. The paper sample weight used was 5.500mg. The program Pyris series holded for 1.0min at 50.00 ˚C and then heated the paper sample from 50.00 ˚C to 270.00 ˚C at a 10.00 ˚C/min rate. At the end, the program holded for 1.0min at 270.00 ˚C. The endothermic peak observed at 261.7 ˚C or 534.85K in the DSC curve obtained, referred to an endothermic reaction by melting of the poly(ethylene terephthalate) (PET) macromolecule. The DSC curve of PET macromolecule was a graph of DSC mW/mg versus temperature in ˚C.
FT-IR spectra were obtained on Perkin Elmer Inc FTIR Spectrometer, Spectrum 2000 Version 5.0.2 Copyright 2004, using an ATR crystal which was diamond. A thermos-stated water bath memmert, was used, to maintain the conical flask at 50 ˚C ± 5 ˚C. Spectrophotometer CM-3630 BCMTS M Type 40605, S.N.43029, Touch Screen-M V 2.0, Frank-PTI, was used for obtaining of the UV-Vis spectrum of the paper sample of vehicle registrations. A TLS BT-10 bursting strength tester, with serial number 5333T097, range 50bar, speed 95/170cm^3/min, 220VAC, 50/60Hz, 500W, was used for measuring the bursting strength of the paper sample. Tensile strength tests were conducted in order to determine the strength of the paper sample of vehicle registrations as per standard ISO 1924-2 [13] with a cross head speed of 20mm/min. A tensile testing machine Zwick Roell Z2.5 BT1-FR 2.5th D14/2008, S.N. 181435/2008, which extended the paper test pieces of dimensions 15mmx210mm, at 20mm/min constant rate of elongation and measured the maximum tensile force was used. It had a strength force of 2.5KN. The tensile machine had a long stroke extensometer placed directly on the paper test piece for the measurement of its elongation. The machine had pneumatic grips of 2.5KN and a long stroke extensometer. A guillotine IDEAL 1043 GS DP 02050 made in Germany, for cutting the paper test pieces used in the tensile strength test to dimensions of 15mmx210mm, was used. An accredited ruler for measuring the width of the paper test pieces and also for measuring the rate of elongation was also used. An accreditated metallic ruler for measuring the width of the paper test pieces was used. A Lorentzen & Wettre tearing tester with serial number 1210 was used for measuring the tearing resistance of the paper product. A M.I.T. folding endurance tester Tinius Olsen Testing Machine CO Willow Grove PA USA, with serial number 7021-3481, was used for measuring double folds of the paper of vehicle registrations, with variable speed of 150 double folds per minute. A Glossmeter Model T480A of Technidyne Corporation New Albany Indiana USA was used for measuring gloss according to TAPPI T480 [14] of the finished product. An IGT Global Standard Tester 1 with printing force 1000N and printing velocity 1.25m/s, software Version 3.20, was used for the determination of the print penetration test IGT for the Machine Direction and Cross Direction. The IGT Print Penetration test liquid was with number 409.003.000. The tester was accompanied by an aluminum disc 50mm wide with smooth edges. There was also a rubber pack with a total thickness of 10mm.
A conditioning chamber that was capable of providing and maintaining standard conditions of temperature and humidity, where the paper test pieces were pre-conditioned at 23 ˚C ± 2 ˚C and 30%r.h.±5%r.h. for 24 hours and were conditioned at 23 ˚C ± 1 ˚C and 50%r.h.±2%r.h. for 12 hours in accordance with the ISO 187 standard [15]. The microscope used was a projection optical microscope SDL S.N. 232431, 220V, 60W, S1, with a round screen and no binoculars, and with a magnification of x10/0.2 to x20/0.4. The microscope slides used were of size 25mmx75mm. Rectangular microscope cover glasses of size 22mmx33mm were also used. An ultra-sonic disperser was used to prepare the paper fiber suspensions. A dropper which was a glass tube of 100mm in length and with an internal diameter 5mm with one end carefully smoothed and the other end fitted with a rubber bulb, which discharged 0.5ml of paper fiber suspension onto the microscope slides.
Ordinary laboratory apparatus
The equipment included a glass conical flask of 500ml capacity with a ground glass stopper. Glass desiccator, with a plate from por celain with holes, and with CaCl2 as desiccant for the transferring of the glass container, inside which were kept the cut test pieces of the paper sample of vehicle registrations, as well as the glass crucible. Glass containers NS ISOLAB Germany, with diameter of 80mm, height of 30mm and capacity of 80ml, with a glass lid, were used to keep the paper sample test pieces inside the oven and inside the desiccator, and finally weighed them dried. A glass crucible with diameter of 50mm, height of 45mm and capacity of 50ml, was used for filtering the fiber residue of the paper sample and a glass rod. Also, a graduated cylinder with a capacity of 100ml and beakers of capacity 250ml were used.
Reagents
All the chemicals were of analytical reagent grade quality and they were used without further purification. Solutions were prepared using deionized water of conductivity <1μS/cm. The reagents used were sulfuric acid 75%w/w±2%w/w and dilute ammonia solution. In order to prepare the 75%w/w sulfuric acid solution we added 700ml of dense sulfuric acid H2SO4 96%w/w, EMSURE SUPELCO, M.W.98.08g/mol, Lot:K5240073L018, Number 1.00731.1011 Sigma-Aldrich, with density of 1.84g/cm^3 at 20 ˚C with simultaneous cooling, and after careful addition to 350ml of distilled water. When the solution reached room temperature it was diluted with distilled water to the volume of one liter. In order to prepare the dilute ammonia solution, 80ml of concentrated Ammonium Hydroxide NH4OH 25%w/w solution, M.W.35.05g/mol, J.T. Baker Mallinckrodt Baker B.V. Holland, with density of 0.88g/cm^3 at 20 ˚C, was diluted with water to the volume of one liter.
Analysis of the paper sample of vehicle registrations
Procedure
The paper sample of vehicle registrations was cut with scissors in small pieces of dimensions of 1cmx1cm, of weight 1.0730g. The sample consisting of small paper pieces of dimension 1cm^2 was first placed in a weighed glass container with a glass lid previously dried of weight 127.3379g and was then put in the oven at 105 ˚C. The paper sample of vehicle registrations was dried overnight in the oven at 105 ˚C and the dried sample was weighed to be 1.0487g. The moisture content of the paper sample was found to be 2.27%w/w. The dried paper sample of vehicle registrations of 1.0487g was then placed in the ground-stoppered conical flask of 500ml capacity and 200ml of 75%w/w sulfuric acid were added as requested per 1gram of the paper sample of vehicle registrations from the method applied in our laboratory. The conical flask with the paper sample pieces was stoppered and shaken carefully continuously in the thermos-stated water bath memmert at 50 ˚C, in order to thoroughly moisten the paper sample. The flask was kept at 50 ˚C for one hour shaking continuously inside the thermos- stated water bath memmert. Then we filtered the contents of the flask using a glass rod through a dried and pre-weighed crucible weighing 73.8225g using vacuum created by the running tap water. The empty glass crucible was dried in the oven at 105 ˚C for 1 hour and was cooled in a desiccator for 1 hour and was weighed to be 73.8225g. The remaining fiber residue was transferred to the crucible by washing the conical flask with 5ml of 75%w/w sulfuric acid and using the glass rod. We then drained the crucible using vacuum and we washed the fiber residue on the filter once by filling the crucible with 75%w/w sulfuric acid. No vacuum was applied before the sulfuric acid had passed under the influence of gravity. We then washed the residue on the filter twice with cold water and then twice with the dilute ammonia solution. Finally, we washed the residue on the glass crucible with cold water. After each addition we vacuum drained the fiber residue on the glass crucible. No vacuum was applied until all the leaching fluid had passed under the influence of gravity. At the end, the last amounts of liquid were removed with the help of the vacuum, created by the running tap water. The crucible with the residue was dried and was put in the oven at 105 ˚C for 1hour. It was then cooled in a desiccator. Finally, it was weighed to be 74.1945g. The residue of synthetic fibers was then calculated to be 0.3720g, Yield: 35.47%w/w on dry mass of the finished product of the paper of vehicle registrations. There was then 35.47%w/w of polyester fiber in the paper of vehicle registrations and 64.53%w/w of cellulose. The whole procedure was repeated one more time. The yield from the second determination was found to be 37.03%w/w on dry mass of the finished product of the paper of vehicle registrations. So, the final yield of the above test procedure was the mean value of the two determinations carried out and it was found to be 36.25%w/w±1%w/w of polyester fiber present on dry mass of the finished product of the paper of vehicle registrations. The confidence limit of the result obtained by the above method was ±1%w/w for a confidence level of 95% and that was applicable for the homogeneous mixture of the finished product of the paper of vehicle registrations with synthetic fibers of polyester in it. The method described was applied for the binary mixture of cellulosic fibers of paper with polyester fibers in them. The method was applied after removing the non-fibrous material in the binary mixture of cellulose fibers with polyester fibers. It could also have been applied in binary mixtures of cotton, linen, hemp, ramie, chalcamonia fibers, modal, viscose, all along with the polyester fibers.
Results and Discussion
Determination of dry conditioned state tensile strength of the paper sample of vehicle registrations
Rectangular strips of paper (their geometry 210x15x1mm) in the machine direction were cut using a guillotine IDEAL 1043GSDP02050. Rectangular strips of paper (their geometry 140x15x1mm) in the cross direction were cut using the guillotine IDEAL 1043GSDP02050, also. The two ends of the dry paper test pieces strips were placed between the metallic pneumatic grabs in the Zwick-Roell Z.2.5KN tensile machine and the grabs moved apart at a constant speed of 20mm/min. The load cell was 2.5KN. The extensometer was a long stroke with code number 320109. We took ten (10) specimens from the paper sample of vehicle registrations in the machine direction (MD) and ten (10) test pieces in the cross direction (CD) making a total of twenty test pieces from the paper sample of vehicle registrations in the dry state.
The type of tensile-strength tester was used where each paper test piece was positioned vertically. The distance between the clamping lines was 180mm in the machine direction and 120mm in the cross direction. The tensile-testing apparatus was stretching the dry test piece of the sample at a constant rate of elongation of 20mm/min and was recording the tensile strength as a function of elongation on the computer LG (Figures 1,2).
Figure 1:Tensile force in the machine direction of the dry sample of vehicle registrations as a function of the strain of its paper specimens.

Figure 2:Tensile force in the counter machine direction, i.e., cross direction of the dry sample of vehicle registrations as a function of the strain of its paper specimens.

Tensile strength and other mechanical properties
The paper properties of basis weight, tensile strength, print penetration IGT, tearing strength of the paper product of vehicle registrations were measured inside the conditioning chamber with 23 ˚C ± 1 ˚C temperature and 50%±2% relative humidity. The paper sample had a dry tensile index of 26.45KN.m/Kg lengthwise in the Machine Direction or MD and of 26.08KN.m/Kg crosswise in the Counter machine Direction or CD and it was approximately equally strong in both directions, due to the presence of cotton rags along with chemical pulp cellulose in its structure and of course of PET fibers (Table 1,2). The elongation at break was measured in the machine direction of the dry specimen of the sample to be 13.1% and in the counter machine direction of the dry specimen to be 18.9% (Figure 1,2). The print penetration IGT of the product at 23 ˚C was calculated to be 16.8mm^-1 in the Machine Direction and 18.6mm^-1 in the cross-machine Direction.
Table 1:Tensile strength of the dry paper sample of vehicle registrations in KN/m and in N, in the two directions of the paper MD and CD.

Table 2:Tensile strength of the dry paper sample of vehicle registrations in MPa in the two directions of the paper MD and CD.

Rectangular pieces of paper (their geometry 760x630x- 1mm) in the machine direction were cut using a guillotine IDEAL 1043GSDP02050. Also, rectangular pieces of paper (their geometry 760x630x1mm) in the counter machine direction were also cut using a guillotine IDEAL 1043GSDP02050. The tearing resistance Elmendorf was measured according to ISO 1974 [16] to be 3146mN in the Machine Direction (MD) and 3274mN in the Counter machine Direction (CD).
Determination of wet conditioned state tensile strength of the paper sample of vehicle registrations
Rectangular strips of paper (their geometry 210x15x1mm) in the machine direction were cut using a guillotine IDEAL 1043GSDP02050. Rectangular strips of paper (their geometry 140x15x1mm) in the cross direction were cut using the guillotine IDEAL 1043GSDP02050, also. All ten strips of the paper sample cut along the machine direction were completely sank inside a glass beaker of 1000ml filled to the top with deionized water, and the other ten strips of the paper sample cut in the counter machine direction were completely sank inside another beaker of 1000ml filled to the top with deionized water. They were kept immersed for 24 hours and then they were tested according to ISO 3781[17] inside the conditioning chamber of constant temperature and relative humidity, of 23 ˚C ± 1 ˚C and 50±2% relative humidity.
The two ends of the wet paper test pieces strips were placed between the metallic pneumatic grabs in the Zwick-Roell Z.2.5KN tensile machine and the grabs moved apart at a constant speed of 20mm/min. The load cell was 2.5KN. The extensometer was a long stroke with code number 320109. We then took ten (10) specimens from the paper sample of vehicle registrations in the machine direction (MD) and ten (10) test pieces in the cross direction (CD) making a total of twenty test pieces from the paper sample of vehicle registrations in the wet state. The type of tensile-strength tester was used where each paper test piece was positioned vertically. The distance between the clamping lines was 180mm in the machine direction and 120mm in the cross direction. The tensile-testing apparatus was stretching the wet test piece of the sample at a constant rate of elongation of 20mm/min and was recording the tensile strength as a function of elongation on the computer LG, as for the dry test of the paper sample of vehicle registrations (Figure 3,4).
Figure 3:Tensile force in the machine direction of the wet sample of vehicle registrations as a function of the strain of its paper specimens.

Figure 4:Tensile force in the counter machine direction, i.e., cross direction of the wet sample of vehicle registrations as a function of the strain of its paper specimens.

The wet paper sample had a wet tensile index of 7.934KN.m/Kg lengthwise in the Machine Direction or MD, and of 8.071KN.m/Kg crosswise in the Counter machine Direction or CD (Table 3,4). The tensile strength of the wet paper sample of vehicle registrations was found for both directions on average to be 30.5% of the tensile strength of the dry paper sample. The elongation at break was measured in the machine direction of the wet specimen of the sample to be 7.0% and in the counter machine direction of the wet specimen to be 15.7% (Figure 3,4). A significant reduction in elongation at break was observed for the machine direction of the wet specimen but not for the wet specimen in the cross direction.
Table 3:Tensile strength of the wet paper sample of vehicle registrations in KN/m and in N, in the two directions of the paper MD and CD.

Table 4:Tensile strength of the dry paper sample of vehicle registrations in MPa in the two directions of the paper MD and CD.

Table 5:Physical and optical properties of the paper sample of vehicle registrations.

The L*, a*, b* values of colour coordinates indicated that the finished product of vehicle registrations had a natural green-yellow look as it did (Table 5), where L* represented lightness from black to white on a scale of zero to 100, while a* and b* represented chromaticity with no specific numeric limits. –a* represented the green colour while +a* represented the red colour. On the other hand, +b* represented the yellow colour while –b* represented the blue colour. The color of the printed matter of vehicle registrations was vegetable green.
Determination of the dry bursting strength of the paper sample of vehicle registrations
Ten (10) square pieces of paper (their geometry 100x100x- 1mm) in the machine direction were cut using a guillotine IDEAL 1043GSDP02050. The bursting strength of the paper sample of vehicle registrations, according to ISO 2759 was determined to be 847.76KPa or 122.96psi (LBf/in^2) (Figure 5).
Figure 5:Diagram of the pressure in KPa versus volume in cm^3, during the testing of bursting strength of the sample of vehicle registrations, according to ISO 2759[18], and single values of bursting strength for each of the ten specimens tested.

Acquisition of FT-IR-spectra
Infrared Transmittance data
The infrared spectra of the sample of vehicle registrations were recorded in solid state. The material of the ATR crystal was diamond. In the FT-IR spectrum (Figure 6) of the paper sample of vehicle registrations the characteristic bands of PET were observed at 2912.92cm^-1 and 2844.32cm^-1 due to C-H stretching of the CH2 groups present in it. Also, characteristic bands were observed at 1728.45cm^-1 that resulted from C=O stretching of the carboxylic ester group [7]. Moreover, the C=O absorption band of unsaturated and benzoate esters were in the region of 1730-1715cm^-1 [19]. In the spectra of the ester, where enolization could occur, a band was observed at 1652.00cm^-1 that resulted from bonding between the ester C=O and the enolic hydroxyl group of PET [19]. Also, characteristic bands appeared at 1454.27cm^-1 and 876.90cm^-1 that resulted from CH2 bending and CH2 rocking respectively of PET. Also, characteristic bands at 1232.81cm^-1 and 1103.63cm^-1 appeared due to C-C-O stretching of the ester group. Also, the C-O stretching vibration in alcohol produced a strong band in the 1260- 1000cm^-1 region of the spectrum. The C-O stretching mode was coupled with the adjacent C-C stretching vibration and vibration al mode was further complicated by branching. In the spectrum this asymmetric C-C-O stretching vibration of alcohol appeared at 1074.63cm^-1. At 1008.72cm^-1 in the spectrum (Figure 6) was observed the in-plane C-H stretching of the aromatic ring of PET. The absorption band that appeared in the spectrum at 673.75cm^- 1 was attributed to out-of-plane ring bending of the substituted benzene in PET molecule.
Figure 6:ATR-FTIR spectra of the cellulose and polyethylene terephthalate polymer in the finished product of vehicle registration sample.

Acquisition of DSC curve of the polyester fiber molecule present in the paper sample of vehicle registrations
Polyethylene terephthalate, commonly coded as PET was a thermoplastic polymer resin of polyesters and was used in liquid containers, drinks, food and synthetic fibers. Depending on its processing and thermal conditions PET may have existed both as amorphous and as semi-crystalline. The endothermic peak observed at around 250 ˚C, i.e., 261.7 ˚C, or 534.85K (Figure 7) referred to an endothermic reaction by melting of the polymer PET (polyethylene terephthalate). Crystallization after glass transition and subsequent melting were observed, indicating that the sample was in an amorphous state with little crystallization by quenching after heating.
Figure 7:DSC curve of PET macromolecule DSC mW/mg versus Temperature oC.

DSC measured how much energy the sample of paper absorbed or released during heating at 261.7 ˚C or 534.85K. In thermal analysis of the thermoplastic polymer by differential scanning calorimetry (DSC) the heat flow rate upon the temperature change was measured. Heating up the thermoplastic polymer and paper sample there was an endothermic phase transition. In order to perform the DSC testing a small amount of the paper sample 5.500mg was heated at a predetermined rate. From that 36.25%w/w was the polymer PET and thus 1.99375x10^-3g of PET were heated which were 0.066458333x10^-6mol of PET considering that a mol PET was approximately 30x10^3g. The energy required to heat the paper sample was compared to the inert reference material at the same temperature.
The paper sample under the test required more energy compared to the reference sample and was indicated as an endotherm process like in Figure 7. The enthalpy change was 62.592x10^-3J. Because 5.500mg of paper sample was 0.1833x10^-6mol and from that only 36.25%w/w was the polymer PET in the finished product, 0.066458333x10^-6mol was PET polymer and thus the molar enthalpy of combustion was calculated to be 941.82320KJ/mol PET or the enthalpy of combustion was 31.39410658J/g.
Diffuse Reflectance Spectrum (DRS) Studies of the paper sample of vehicle registrations
Reflectance measurements were carried out over the spectral range 400-700nm and processed to extract the band gap properties of the synthetic paper sample. The K/S ratio of the paper sample of vehicle registration was found according to equation (1) to be K/S=19.80202501 and the reflectance ISO brightness used was measured to be 41.58%. The ISO brightness measured was the numerical value of the reflectance of the paper sample at 457nm, blue light reflectance. Figure 8 depicted the diffuse reflectance spectrum (DRS) of the paper sample with synthetic polyester fiber present in it, as it was.
Figure 8:Reflectance graph, or DRS spectrum of the paper sample of vehicle registrations as it was.

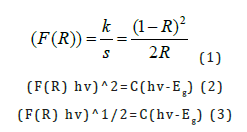
F(R) was calculated, where K was the absorption or coefficient of reflectivity, S was the coefficient of light scattering from the sample and R was the observed reflectivity for monochromatic light, and F(R) was the Kubelka-Munk function [20] or the remission, hv was the photon energy and C was a proportionality constant. The energy band gap Eg for permitted indirect transitions, of the paper sample, could be obtained based on the Kubelka-Munk model according to equation (2). From the plot of hv versus [(K/S) hv]^2 (Figure 9) graph of the cellulosic chromophore, of the C=O group and the double bonds, as well as of the polyethylene terephthalate polymer molecule chromophore, the band gap of the material was estimated to be 1.165616495929150eV for permitted indirect transitions. From the plot of hv versus [(K/S) hv]^1/2 (Figure 10) according to equation (3), the band gap of the material was estimated as 3.3903756517571100eV for permitted direct transitions. The structural disorder due to the presence of polyester molecules in the chemical pulp of the paper sample of vehicle registrations, at room temperature, was attributed to the low value in band gap for permitted indirect transitions, calculated. In previous studies, the value of permitted indirect band gap energy was calculated to be 1.16984469010026eV for a A4 copy paper sample [21] without poly-ethylene terephthalate present in its cellulose molecule, thus a higher band gap was observed due to lack of disorder in the cellulose chemical pulp.
Figure 9:The Tauc plot, i.e., hv versus (K/S hv)^2 graph of the chromophore present in the paper sample of vehicle registrations, for calculating the band gap energy for permitted indirect transitions. The linear part of the plot was extrapolated to the x-axis.

Figure 10:The Tauc plot, i.e., hv versus (K/S hv)^2 graph of the chromophore present in the paper sample of vehicle registrations, for calculating the band gap energy for permitted direct transitions. The linear part of the plot was extrapolated to the x-axis.

Conclusion
To conclude, the printed matter of paper vehicle registrations analyzed had dimensions of 240mmx143mm. When folded it had dimensions of 80mmx143mm and it had a vegetable-green color. Fluorescent fibers, visible only in the ultra-violet, were contained in its paper mass. The printed matter contained thus red fluorescent fibers 8 fibers/dm^2, and green, fluorescent fibers 10 fibers/dm^2 as per average. In the paper mass were contained red fluorescent fibers 0.10%w/w and green, fluorescent fibers 0.13%w/w, which were visible only in the ultra-violet. From microscopic observation were observed chemical pulp, cotton rags and synthetic fibers of polyester PET. The total content of the synthetic fibers, i.e., polyester was 36.3% by weight of the finished product. The finished product of vehicle registrations had puncture resistance of 848KPa, greater than the product specification.
The print penetration IGT was determined to be 16.8mm^- 1 in the machine direction (MD) and 18.6mm^-1 in the counter machine direction. Generally, the stain length in the paper sample was increasing when the roughness and the absorption of the paper was decreasing. The principle of the method was that between the printing disc and a paper strip on the sector of the Amsterdam multi-purpose printability tester. A drop of oil with an amount of 5.8mg was spread to a stain. The length of the stain was then measured. In print penetration IGT the large stain indicated a low roughness and or absorption of the paper. We used the reciprocal value of the stain length multiplied by 1,000 as an identifier of this property i.e., 1,000/(stain length in mm). This was called print penetration. At the moment of printing a quantity of varnish was absorbed by the surface of the paper sample. This amount was determined by the absorption of liquid in the surface recesses (i.e., roughness) and the absorption into the paper pores at the surface. The sum of these two phenomena determined the oil absorption or the varnish-ability. The reciprocal value of this was called print penetration. The higher the value of the print penetration was, the better was the print penetration. The value of 18.6mm^-1 for the CD dimension indicated a better print penetration than the value of 16.8mm^-1 for the MD of the sample.
The elongation at break of the dry sample specimen was found to be 13.1% for the machine direction and 18.9% for the counter machine direction. For the wet sample specimen, the elongation at break was found to be 7.0% for the machine direction and 15.7% for the counter machine direction. That meant that the elongation at break was diminished for the wet sample specimen especially for the machine direction. The grammage of the vehicle registrations was found to be 219.3g/m^2. The gloss of the finished product was found to be 18% and that meant that it had sheen gloss.
The folding endurance was found to be greater than 40,000 double folds in the machine direction, with variable speed 150 double folds per minute and with an applied tension of 0.5Kg. The folding endurance was found to be greater than 20,000 double folds in the counter machine direction using the variable speed of 150 double folds per minute and 0.5Kg of tension. Finally, the tensile strength of the dry specimen was determined and was found to be 86.9N in the machine direction and also 85.8N in the counter machine direction in tension. The addition of cotton rags in the finished product enhanced the tensile strength and tearing resistance, and folding endurance especially in the counter machine direction because of the effect of hydrogen bonding. The free OH- groups present in the cotton polymer molecule, apart from the glycoside bonds, provided furthermore sites for hydrogen bonding. The energy of this bond ranged then from about 5kcal/mol to 10Kcal/mol. Of course, the presence of polyethylene terephthalate (PET) molecule in the sample of vehicle registrations offered more OH- groups and also –C=O groups that provided sites for hydrogen bonding also. In the polyethylene part of the PET molecule the –CH2- units present had only weak van der Waals forces associated with them. The bonding energies of them ranged from only about 0.5Kcal/mol to 5Kcal/mol. The tensile strength of the wet specimen was determined to be 26.1N in the machine direction and 26.6N in the counter machine direction. The tensile strength of the wet specimen was found to be 30.5% of the tensile strength of the dry specimen paper sample. The differential scanning calorimetry curve obtained confirmed the presence of PET present in the finished product of vehicle registrations. The finished product of paper vehicle registrations had good mechanical properties although the synthetic polymer PET was only present at a rate of 36.25% w/w on a dry basis of the end product and the 63.75%w/w was cellulose. The band gap of the finished product was calculated to be 1.165616495929150eV for permitted indirect transitions lower than the band gap value of a copy paper sample due to the structural disorder caused by the polyester fibers present. The presence of PET was studied by the differential scanning calorimetry technique and the efficiency of the reaction was identified by the peak temperature of the reaction endotherm.
References
- Martin Alberto Masuelli (2013) Introduction of Fibre-Reinforced polymers-polymers and composites: Concepts, properties and processes. Fiber Reinforced Polymers, pp. 1-242.
- Markovic G, Visakh PM (2017) 1-Polymer Blends: State of art, recent developments in polymer macro, micro and nano blends, preparation and characterization, pp.1-15.
- Wojtowicz A, Janssen LPBM, Moscicki L (2009) Blends of natural and synthetic polymers. In: Janssen LPBM, Moscicki L (Eds.), Thermoplastic Starch: A Green Material for Various Industries, pp. 35-53.
- Sperling LH (2000) History and development of polymer blends and IPNS. Applied Polymer Science: 21st Century, Pergamon, pp.343-354.
- Seyyed Monfared Zanjani Jamal, Saner Okan Burcu, Menceloglu Yusuf (2016) Manufacturing of multilayer graphene oxide/poly(ethylene terephthalate) nanocomposites with tunable crystallinity, chain orientations and thermal transitions. Mater Chem Phys 176: 58-67.
- Catia S Nunes, Paulo R Souza, Adonilson R Freitas, Michael Jackson Vieira da Silva, Fernanda A Rosa, et al. (2017) Poisoning effects of water and dyes on the [Bmin][BF4] catalysis of poly(Ethylene Terephthalate)(PET) depolymerization under Supercritical Ethanol. Catalysts 7(43): 1-16.
- Sangyoon Park, Sarinthip Thanakkasaranee, Hojun Shin, Youngsoo Lee, Guman Tak, et al. (2021) PET/Bio-Based terpolyester blends with high dimensional thermal stability. Polymers 13(5): 728.
- Muralisrinivasan Natamai Subramanian (2017) Polymer blends and composites chemistry and technology, Scrivener Publishing Wiley, ISBN 978-1-118-11889-4, Chapter 2, Polymers, pp.25-26.
- Al-Sabagh AM, Yehia FZ, Eshaq Gh, Rabie AM, ElMetwally AE (2016) Greener routes for recycling of polyethylene terephthalate. Egypt J Pet 25(1): 53-64.
- Sang Ho Park, Seong Hun Kim (2014) Poly(ethylene terephthalate) recycling for high value-added textiles. Fash Text 1(1): 1-17.
- Kao CY, Cheng WH, Wan BZ (1997) Investigation of catalytic glycolysis of polyethylene terephthalate by differential scanning calorimetry. Thermochim Acta 292(1-2): 95-104.
- Mukesh Kumar Singh, Annika Singh (2022) Thermal characterization of materials using differential scanning calorimetry-Chapter 9. In: Mukesh Kumar Singh, Annika Singh (Eds.), In the Textile Institute Book Series, Characterization of Polymers and Fibres, Woodhead Publishing, pp. 201-222.
- ISO 1924-2 (2008) Paper and board-Determination of tensile properties-Part 2: Constant rate of elongation method (20mm/min), pp. 1-12.
- TAPPI T480 om-09-Specular gloss of paper and paperboard at 75 degrees, pp.1-6.
- ISO 187 (2022) Paper, board and pulps-standard atmosphere for conditioning and testing and procedure for monitoring the atmosphere and conditioning of samples, pp.1-8.
- ISO 1974 (2012) Paper-determination of tearing resistance-Elmendorf method, pp.1-14.
- ISO 3781 (2011) Paper and board-determination of tensile strength after immersion in water, pp.1-6.
- ISO 2759 (2014) Board-determination of bursting strength, pp.1-13.
- Silverstein, Bassler, Morrill (1981) Spectrometric identification of organic compounds, Fourth Edition, John Wiley and Sons Inc., 1981, Copyright 1963, 1967, 1974, 1981, by John Wiley & Sons Inc.
- Salmon Landi, Iran Rocha Segundo, Elisabete Freitas, Mikhail Vasilevskiy, Joaquim Carneiro, et al. (2022) Use and misuse of the Kubelka-Munk function to obtain the band gap energy from diffuse reflectance measurements. Solid State Communications 341: 114573.
- Chryssou K, Stassinopoulou M, Lampi E (2021) A study of the optical bandgap energy and urbach energy tail of two white A4 copy paper samples. Ann Chem Sci Res 3(1): 1-6.
© 2023 Κaterina Chryssou. This is an open access article distributed under the terms of the Creative Commons Attribution License , which permits unrestricted use, distribution, and build upon your work non-commercially.
Editor In Chief


.jpg)


Signup for Newsletter

Quick Links
 Editorial Board Registrations
 Submit your Article
 Refer a Friend
 Advertise With Us
Our Recent Edition

.jpg)


Top Editors


.jpg)


.bmp)
.jpg)
.png)
.jpg)


.jpg)


.png)

.png)


.png)


Financial Support

Sponsors

Latest e-Books

Latest Video

 a Creative Commons Attribution 4.0 International License. Based on a work at www.crimsonpublishers.com.
Best viewed in
a Creative Commons Attribution 4.0 International License. Based on a work at www.crimsonpublishers.com.
Best viewed in