
- About Us
- Information
-

The Author ensures that the research has been conducted responsibly and ethically with adherence to all relevant regulations. read more..
- For Authors
- For Reviewer
- Manuscript Guidelines
- Membership
- Publication Ethics
-
- Journals
- Reprints
- e-Books
- Videos
- Policies
- Contact Us
 COVID-19
- Submissions


Full Text
Annals of Chemical Science Research
Single Nanofluid of Intelligent Dimensional Analysis with Experimentation
Rong-Tsu Wang1* and Jung-Chang Wang2*
1Department of Leisure Management, Yu Da University of Science and Technology, Taiwan
2Department of Marine Engineering (DME), National Taiwan Ocean University (NTOU), Taiwan
*Corresponding author:Rong-Tsu Wang, Department of Leisure Management, Yu Da University of Science and Technology, Miaoli County, Taiwan and Jung-Chang Wang, Department of Marine Engineering (DME), National Taiwan Ocean University (NTOU), Keelung 202301, Taiwan
Submission: February 22, 2023;Published: March 07, 2023

Volume3 Issue4March, 2023
Abstract
The present study was conducted a two-step synthesis assisted by an ultrasound technique to prepare Al2O3 nanofluids for the thermal-electrochemistry experiment [1,2]. In addition, a sedimentation experiment verified suspensibility, stability, and thermal conductivity to determine the best mixing method. 0.5-2.5 wt.% single nanofluids were added into a battery cell with copper and Aluminium electrodes for an oxidation reduction reaction to test the generating capacity between 20 and 40 ˚C. The derived two empirical formulas of thermal conductivity and generating capacity for alumina nanofluids using the innovation dimensional analysis to examine the functional relationships between experimental parameters. The results of the property verification and experimentation indicated that Al2O3 nanofluid and emulsifying agent mixture at a concentration of 1wt.% had the best thermal conductivity, and that this decreases as the concentration increases. At 40 ˚C, 2.5 wt.% nanofluid also had the highest electric charge density; however, the rate of increase was less than 7% higher than that for 2 wt.% nanofluid. The 0.5-2.5wt.% Al2O3 nanofluid between 20 and 40 °C, inserting the temperature and concentration parameters can estimate the thermal conductivity and the electric charge density using the empirical formulas in the present study.
Keywords: Single nanofluid; Two-step synthesis; Thermal performance; Electrical performance; Dimensional analysis
Introduction
Single nano liquids are a type of working fluid that contain suspended nanoparticles that have a strong size effect for thermal conductivity and fluid behaviour on the micro-scale. They are widely used with regard to continuous physical measures such as temperature, pressure, internal energy, entropy and enthalpy, and thermal properties such as thermal conductivity, specific heat capacity, and viscosity. The geometry, cohesion situation, and surface obstruction of nanoparticles are the main variables controlling thermal conductivity enhancement in nanofluids. The particles in the liquid are not easily affected by gravity and do not aggregate or precipitate [3-5]. A two-step synthesis method, also known as the direct mixing method, was used to prepare Al2O3 nanofluid, adding nanoparticles into the working fluid. However, directly adding nanoparticles often results in clumping, reducing suspendibility. Therefore, the three following methods were used to stabilize the suspended matter: (1) The pH value of the nanofluid was changed to prevent sedimentation due to isoelectric points (IEP); (2) An ultrasonicate was used to disperse the particles; (3) A surfactant/dispersant was added (such as sodium Lauretha sulcate or oleic acid) to promote dispersal and suspension. Selection of the surfactant and dispersant was based on solvent and particle properties. The advantage of the two-step synthesis method is that the grain size and concentration can be better controlled as they can be selected based on usage needs [6-10]. In addition, this study also used emulsifying agent to increase the suspendibility of the particles in the aluminium oxide nanofluid. However, higher concentrations of the emulsifying agent reduce the zeta potential of the suspended particles and the thermal conductivity coefficient for the nanofluid. According to past literature, with a fixed 2% concentration of aluminium oxide powder and dispersant, an emulsifying agent concentration of 2% is optimal [11].
In 1799, Alessandro Volta invented the first power source, the voltaic pile (also called the voltaic cell), which was the first power source to store and provide a steady current. Volta used a damp cloth containing salt water to separate copper and zinc discs, then arranged them into a circular cylinder and used a wire to connect silver and zinc discs at both ends to generate a current [12-14]. In 1833, Michael Faraday [15] introduced two basic laws of electrolysis which defined the exchange relationship between electric energy and chemical energy. Afterward, the Nernst-Einstein equation of diffusion and electric conductivity, Bronsted–Lowry acid–base theory, and Nernst equation for electrode potential were introduced [15-17]. Because of these efforts in electrochemistry, a good foundation for battery development was built. Later, batteries have been improved, from a primary cell to rechargeable batteries and the common lithium-ion battery. Now nanofluid is used as a battery electrolyte and as nanofluid temperature increases, the current and output electrical quantity steadily rise [18-20]. Nanofluid is also another prospective cooling liquid with advantageous performances compared to conventional cooling liquid [21-23]. Heris et al. [24] showed that Alumina nanofluid had better thermophysical properties and thermal performances compared to CuO nanofluid using ultrasonic vibration method in heat-pipe thermosyphon system. Wu et al. [25] verified the effectiveness of nanofluid on improving the overall performance of MCHS on electronic cooling system. They found that Al2O3/H2O nanofluid exhibit dramatically enhanced thermal conductivity as well as strong temperature- and size-dependent thermophysical properties and can be achieved by adding solid particles with diameters below 100 nm in the traditional liquid working fluid.
Moraveji and Razvarz [26] investigated the thermal efficiency enhancement of a heat pipe using aluminium oxide nanofluid compared with pure water under the different operating state. Zhao et al. [27] present a three-dimensional numerical analysis to study the thermal conductivity and viscosity of Al2O3–water nanofluids through flat and circular tubes at constant heat flux boundary condition. Wang [28] used the alumina nanofluid as an electrolyte compared with the other aqueous solutions according to the Zeta potential, pH value, thermal conductivity, and viscosity to demonstrate the most favourable stability, particle fraction, thermal conductivity, and stable current output. The electrical performance of nanofluids has not been widely investigated. However, it is an important property. Only a few studies of electrical conductivity of nanofluids took into consideration. The electrical conductivity of nanofluids including metallic and ceramic particles (Cu, Al2O3 and CuO) has been conducted. The enhancement mechanism for electrical conductivity is completely different from that of thermal conductivity in nanofluids [29]. An experimental work on effective electrical conductivity of aqueous suspensions of aluminium oxide nanoparticles (nanofluids) indicated that the dependence of the effective electrical conductivity on temperature is much less than the volume fraction [30]. Minea and Luciu [31] obtained an empirical correlation of the electrical conductivity with volume fractions through a 3D statistical analysis. Zakaria et al. [32] established the thermo-electrical conductivity ratio (TEC) based on both thermal and electrical conductivity findings. The same researchers published another work the next year. Abdolbaqi et al. [33] also studied the thermal conductivity and electrical conductivity of Bio Glycol (BG)–water (W) mixed nanofluids containing Al2O3 nanoparticles using the two-step method. They found that electrical conductivity was observed to decrease as the volume concentration increased.
Research Methods
A nanofluid preparation method to test the comprehensive performances will be introduced in this section. During the process, a dispersant and an emulsifying agent were incorporated using ultrasonic vibration. Figure 1 shows the preparation procedure. Five nanofluids with different weight percent concentrations were utilized. The nanofluid preparation procedure is shown below [1,2].
Figure 1:Single Nanofluid preparation procedure.

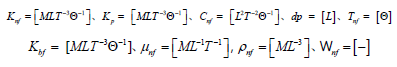
Mix Tween20 (HLB=16.7) and Span20 (HLB=8.6) into a HLB=12 emulsifying agent. (First use a stirrer at 200rpm. When the emulsion becomes less viscous, adjust the rotation speedily to 400rpm. Use the stirrer for 120 minutes until the emulsion becomes clear. Do not heat.) Mix the emulsifying agent and deionized water and then heat while stirring (80 °C with a rotational speed of 500rpm for approximately 40-60 minutes). Use a constant temperature bath at 25 °C or a natural cooling to cool the samples. (Attention must be paid to whether the water surface is over condensing tube or not and the water flow must not contaminate the samples.) Add the nanoparticles into the mixed and cooled emulsified deionized water (a respirator and gloves must be worn to avoid inhalation of nanoparticles or remnants on hands.) Stir the samples from step 4 for 10 minutes. Do not heat. While waiting for step 5 to be complete, add the dispersant into the samples and stir for approximately 10 minutes. Move the stirred samples into a so nicator acoustic hood (make sure the probe is below the sample surface or it might break.) Fix the probe and start oscillation at 80% power output. Because accumulated heat will generate charring in the nanofluid, the oscillation time should not last over 30 minutes. The nanofluid can be cooled to continue oscillation. The total oscillation time is approximately 60 minutes. Repeat these seven steps to prepare mixtures with concentrations of 0.5 to 2.5% Al2O3 nanoparticle powder, emulsifying agent and dispersant. The thermal conductivity coefficient is a numerical value that determines the thermal conductivity of the nanofluid. Theoretical models from which parameters can be obtained for this experiment were selected from past literature and incorporated to calculate the results in order to confirm these formulas and the differences in the thermal conductivities obtained for the aluminium oxide nanofluid in the present study. These are the basic nanofluid thermal conductivity model developed by Maxwell [42] and the model modified by Xuan [43] to consider stochastic force, grain size, concentration, and temperature. In those models, Knf is the thermal conductivity for the nanofluid, Kbf is the thermal conductivity for the base fluid, Kp is the thermal conductivity for the particles, φ is the particle volume fraction, p ρ is particle density, Cp,p is particle specific heat, kB is Boltzmann’s constant, Tnf is the nanofluid temperature, μnf is viscosity, and r is the particle radius [1,2].
Figure 2 shows the electrochemical experiment framework. The nanofluid currents and outputs were explored and the performance of the nanofluid as an electrolyte was verified. The experiment procedure was as follows [1,2]: Place the battery cell upon a heat source and apply thermal grease on the battery cell bottom for uniform heat transmission. Add the nanofluid (around 50ml) into the battery cell. Connect the anode (aluminium) and cathode (red brass) with a desktop ammeter respectively. Use thermocouples to monitor the electrolyte temperature. Turn on the constant temperature bath and set the temperature at 15 °C. For measurements below the ambient temperature, first place the samples in the constant temperature bath. After the samples cool, add the samples into the battery cell, wait for a few minutes and measure the temperature. Record the data when the current or output electrical quantity is steady. For measurements above ambient temperature, heat the battery cell with the heat source. When the electrolyte temperatures reach the target temperature, record the data and collate data on a computer. Clean the electrolytic cell and prepare the next sample. Repeat steps 2 to 7 to measure nanofluids with different concentrations.
Figure 2:Electricity generation experiment framework [1,2].

These can be used in Equation (2-1) [1,2].

Expression of all variables using M, L, T, and Θ resulted in the following.
They can be combined into Equation (2-2).
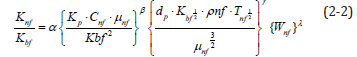
Substituting the nanofluid fluid properties obtained from the experiment into Equation (2-2) obtains values for α, β, γ and λ; which, after simplification, yields the thermal conductivity empirical formula for the nanofluid
For electric charge density output, the present analysis procedure is shown as follows [1,2]: Definition of correlated variables: nanofluid specific heat Cnf, nanofluid particle size dp, nanofluid temperature Tnf, thermal conductivity of base fluid Kbf, nanofluid viscosity nf μ , nanofluid densityρ nf , output electric charge density of battery with nanofluid electrolyte Ρnf , nanofluid zeta potential Vn, electric charge density of battery with water electrolyte below 30 °C Pw , and diluted Al2O3 weight percent concentration as Wnf. Output electric charge density of the battery cell was determined by these nine variables. Equation (2-3) shows five independent physical quantities; namely, mass (M), length (L), time (T), temperature (Θ), and voltage (V).

Five electric charge density dimensionless π numbers were determined and five repeated variables ( Pw , Ve, μnf, ρnf and Cnf) were chosen. Using the five independent variables to multiply the chosen five repeated variables, five dimensionless Π items were obtained. Equation (2-4) shows the electric charge density dimensionless equation.
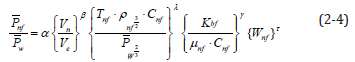
Substituting the experimental data into the equation above, values α, β, γ and λ were obtained. After arrangement, a nanofluid generating capacity empirical formula was derived [1,2].
Results and Discussion
This section describes the influence of adding HLB=12 emulsifying agent and dispersant to change the powder concentration on the particles and the stability of the nanofluid. Table 1 indicates that when the nanofluid emulsifying agent concentration increases, the thermal conductivity for the resulting nanofluid may not increase [1,2]. This is because the thermal conductivity for the emulsifying agent is only 0.1-0.2 W/m-k; therefore, while the emulsifying agent can envelope the aluminium oxide particles, increasing their surface tension so that they do not aggregate, it does not affect thermal conductivity. The thermal conductivities for the nanofluids change along with temperature. The concentration of aluminium oxide powder was the highest at 2.5%, but because the emulsifying agent concentration also increased, the increasing trend in thermal conductivity along with temperature became less apparent. Therefore, the thermal conductivity measured for the 2.5% nanofluid was the lowest in the present study. Finally, the experimental results were used in intelligent dimensional analysis to extrapolate an empirical formula with emulsifying agents.
Table 1:Nanofluid thermal conductivities at 20-40 °C [1,2].

A microgeneration experiment was conducted using different concentrations of Al2O3 and tap water as electrolytes in aluminium and red brass battery cells at different temperatures in this section. The current and voltage were measured to observe generating capacity. The generating efficiency was determined by electric current density and electric charge density. An empirical formula was derived using intelligent dimensional analysis of experimental data. The goal of the present study was to test the generating capacity experiment samples when used as electrolytes so that the results can be applied as a reference for future applications and studies. Thus, the current and output quantities have no effect on the outcomes. Tap water was employed as the benchmark in this microgeneration experiment as it contains a small number of ions; this benchmark was used to compare the generating capacity of the Al2O3 nanofluids. Al2O3 powder is insoluble in water; thus, the ions in the samples came from dissociation of the dispersant compounds and Al2O3. As such, it can be determined that the Al2O3 nanofluid created in this study has limited efficacy as an electrolyte.
Table 2 shows the currents, voltages, and electric quantities of the tap water electrolyte and 0.5-0.25% nanofluid electrolytes, respectively. As predicted before the experiment, the current and electric quantities increased as temperature increased, while the output quantities were minuscule. The nanofluid current and electric quantities increased as the temperature and concentration increased. However, temperature had a more obvious influence on the current and output electric quantities than the concentration. For instance, increasing the nanofluid concentration from 1.5% to 2% raised the current increased from 0.130 to 0.147 (around 13%), whereas increasing the temperature from 30 to 35 °C raised the current output increased from 0.147 to 0.203 (around 39%).
Table 2:Currents, voltages, and electric quantities of tap water and 0.5%, 1.0%, 1.5%, 2.0%, and 2.5% Al2O3 nanofluids [1,2].

Figure 3 shows that electric current densities of both tap water and the nanofluid were influenced by temperature and concentration and increased as the temperature rose. However, the nanofluid output a higher electric current density than tap water as the battery cell temperature raised. At 20 °C, the tap water electric current density was 4.255μA/cm2 and the 0.5-2.5% nanofluid electric current densities were 4.516, 4.733, 4.993, 5.297 and 6.166μA/cm2; the increase ratios compared to tap water electric current density were 6%, 12%, 17%, 24% and 45% higher, respectively. At 40 °C, the tap water electric current density was 6.166μA/cm2 and the 0.5-2.5% nanofluid electric current densities were 9.205, 11.724, 13.808, 15.284, and 15.719μA/cm2; the increase ratios compared to tap water electric current density were 49%, 90%, 124%, 148% and 155% higher, respectively. 2% nanofluid had the greatest increase ratios compared to tap water. When the temperature rose from 20 °C to 40 °C, the electric current density increase ratio rose from 24% to 148% (Table 3).
Table 3:Electric current density ratios for tap water and Al2O3 nanofluids [1,2].

Figure 3:Electric current densities for tap water and Al2O3 nanofluids [1,2].

Figure 4 shows the relationship between electric charge density and temperature for tap water and 0.5-2.5% Al2O3 nanofluids. At 20 °C, tap water electric charge density was 2.215μW/cm2 and 0.5- 2.5% nanofluid electric charge densities were 2.562, 2.692, 2.779, 3.083, and 3.561μW/cm2, respectively. Compared to tap water, the nanofluid electric charge density increase ratios were 16%, 22%, 25%, 39%, and 61%, respectively. At 40 °C, tap water electric charge density was 4.299μW/cm2 and 0.5-2.5% nanofluid electric charge densities were 6.34, 8.207, 9.509, 10.551, and 10.86μW/cm2, respectively. Compared to tap water, the nanofluid electric charge density increase ratios were 47%, 91%, 121%, 146%, and 153%, respectively. 1.5% nanofluid electric charge density increased the most from 20 to 40 °C. Compared to tap water, the electric charge density ratio increased from 25% to 121%.
Figure 4:Electric charge densities for tap water and Al2O3 nanofluids [1,2].

Figure 5 shows the electric charge density ratios between nanofluid and tap water. After conversion, the ratios for the nanofluid and tap water could be compared. Figure 5 shows that the electric charge density ratio trends are similar to those of electric current density; 0.5% nanofluid had the smallest electric charge density ratio. Thus, average electric charge densities for the same concentration between 20 and 40 °C were discussed. The average electric charge densities for 0.5-2.5% nanofluids were 1.384, 1.709, 1.852, 2.094, and 2.233, respectively. For every 0.5% increase in concentration, the electric charge density increase ratios were 23%, 8%, 13% and 6%, respectively. The electric charge density increased the highest when the concentration increased from 0.5% to 1% and the least from 2% to 2.5%.
Figure 5:Electric charge density ratios for tap water and Al2O3 nanofluids [1,2].

According to the results above, at 20 °C, aside from the 2.5% nanofluid which had the greatest increase in electric charge density, the increase ratios for other concentrations were less than 30%. This may be because the ions in the electrolytes were less active at 20 °C and ions in the electrodes and the electrolytes were dissociable, such that the concentrations and the electric charge densities were less correlative. However, as the temperature increased, ions in the electrolytes were more active; thus, Al2O3 concentration had a greater impact on electric quantities. When the temperature reached 40 °C, there was no significant difference between the generating efficiencies for the 2.5% and 2% nanofluids. The present study utilized a battery cell with red brass and aluminium electrodes and Al2O3 nanofluid as an electrolyte to conduct oxidation reduction reactions in order to test the generating capacity. Figure 5 shows the electrochemical reaction. The standard reduction potential of pure copper is 0.34V and the standard reduction potential of pure aluminium is -1.66V. The standard potential difference Ve of copper-aluminium electrodes is 2V. Because the main component of an aluminium alloy is aluminium and the main component of red brass is copper, for convenience, this study took the aluminium electrode as pure aluminium and the red brass as pure cooper. According to their activities, aluminium was used as the anode and copper as the cathode [1,2].
This study used intelligent dimensional analysis to create a thermal conductivity empirical formula so that, under certain conditions, only a few simple parameters are required for insertion into the formula and there is no need to use instruments in order to estimate the thermal conductivity of a nanofluid. According to the formula created using the experimental results, it is applicable for aluminium oxide nanofluids between 20 °C and 40 °C, with concentrations between 0.5% and 2.5%, with grain sizes between 170nm and 210 nm, and with an emulsifying agent.
Equation shows that Knf is determined by the aluminium oxide nanofluid temperature and concentration. Concentration was temporarily not considered. Setting λ=0 and using 1% nanofluid as a benchmark revealed that Knf changed along with temperature at 1%. The parameters in Refs. [1,2] show that the changes in temperature and thermal conductivity are similar for nanofluids at different concentrations. Therefore, 30 °C is used at the benchmark to find the λ values for different concentrations. The concentration was then a function of λ to obtain Equation (3-1):
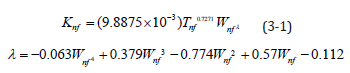
Table 4 shows a comparison of the measured and calculated values for the 0.5-2.5% aluminium oxide nanofluids. Initial estimations show that the calculated and measured values were similar. The largest error rate, 2.82%, was for 2% nanofluid at 20 °C, indicating that the overall error rates were small. Equation (3-2) shows the formula used to calculate error rates, where EK is the error of the measured and calculated thermal conductivity, Knf,e is the measured thermal conductivity, and Knf,f is the calculated thermal conductivity.
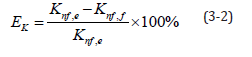
Table 4:Comparison of measured and calculated thermal conductivities of 0.5%, 1%, 1.5%, 2% and 2.5% nanofluid.

In this section, the measured data was substituted into the electric charge density empirical formula derived in Section 2. Refs. [1,2] showed the parameters to be input. Nanofluid density (ρnf) and specific heat (Cnf) were calculated using the water and Al2O3 nanoparticle weight percent concentration ratios. In this section, simple parameters in the empirical formula were used in order to estimate the nanofluid electric charge density generated in the battery cell. The empirical formula was suitable for Al2O3 nanofluids with the emulsifying agent, particle sizes from 170 to 210nm, and 0.5-2.5% weight percent concentration, and at temperatures between 20 °C and 40 °C. The electric charge density was estimated by substituting the known parameters into Equation (2-4). Finally, concentration was taken into consideration and 30 °C was adopted as the benchmark to find the value for τ . Equation (3-3) shows the electric charge density empirical formula.
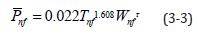
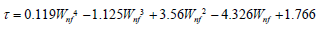
Table 5 compares the values for the 0.5-2.5% Al2O3 nanofluids measured by the output electric charge density equipment and those derived from the empirical formula. As mentioned above, many problems still existed in the battery cell reaction process that caused low and instable current and power output. At low temperatures, as the concentration increased, the electric charge density output did not increase correlatively. Equation (3-4) shows the error rate calculation, where EP is the error value between the measured value and calculated value, nf ,e P is the electric charge density measured by the equipment, and nf,f is the electric charge density calculated using the empirical formula.
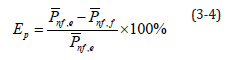
Table 5:Comparison between measured and calculated values of 0.5%, 1%, 1.5%, 2% and 2.5% nanofluid.

Table 5 shows the error rate. Because the empirical formula adopted 1% Al2O3 nanofluid at 30 °C as the benchmark, the error rate in the same condition was lower, with maximum error rate of 7.61%. However, at different concentrations and temperatures, the error rate may be greater than 10%; for 2% Al2O3 nanofluid at 20 °C, the error rate reached 27.58%.
Conclusion
This study used innovation dimensional analysis to determine an empirical formula for the thermal conductivity of an Al2O3 nanofluid with an emulsifying agent, kept at temperatures between 20 °C and 40 °C, and an aluminium oxide powder concentration between 0.5% and 2.5%; the error rate was below 3% [1,2]. At 20 °C, nanofluid concentration had no obvious influence on the increase in electric quantity. At 20 °C, 2.5wt.% nanofluid had the highest electric charge density, with a rate of increase of 60%. However, when the temperature had risen to 40 °C, as the concentration increased, the electric quantity increased more noticeably, except for the slight 3% increase when the concentration increased from 2% to 2.5% (20% higher than tap water). At 20 °C, the electric charge density output of the 2.5% nanofluid sample was markedly higher than those for the other nanofluid concentrations and there were no significant differences in electric charge density between the 0.5-2% nanofluid samples. At 40 °C, 2.5% nanofluid also had the greatest electric charge density; however, compared to the 2% nanofluid, the difference in electric charge density was only 0.31μW/cm2. After the microgeneration experiment, many Al2O3 nanoparticles were found on the copper and aluminium electrodes and some of them precipitated in the battery cell. Using dimensionless parameters and a dimensional analysis, this study derived an empirical formula for electric charge density output for an aluminium copper battery cell with 0.5-0.25% Al2O3 electrolyte between 20 °C and 40 °C. However, the error rates for the calculated and measured values were high due to unstable power outputs at low temperatures. Nevertheless, the formula was suitable for an approximate estimation [1,2].
References
- Yen PH, Wang JC (2019) Power generation and electric charge density with temperature effect of alumina nanofluids using dimensional analysis. Energy Conversion and Management 186: 546-555.
- Wang RT, Wang JC (2017) Intelligent dimensional and thermal performance analysis of Al2O3 Energy Conversion and Management 138: 686-697.
- Gupta S, Wang WS, Vanapalli SA (2016) Microfluidic viscometers for shear rheology of complex fluids and biofluids. Biomicrofluidics 10(4): 043402.
- Sajeesh P, Sen AK (2014) Particle separation and sorting in microfluidic devices: A review. Microfluidics and Nanofluidics 17(1): 1-52.
- Kundan L, Mallick SS, Pal B (2017) Prediction and optimization of nanoclusters-based thermal conductivity of nanofluids: Application of box-behnken design (BBD). Particulate Science and Technology 35(3): 256-276.
- Li Y, Zhou J, Tung S, Schneider E, Xi S (2009) A review on development of nanofluid preparation and characterization. Powder Technology 196(2): 89-101.
- Teng TP (2013) Thermal conductivity and phase-change properties of aqueous alumina nanofluid. Energy conversion and management 67: 369-375.
- Khattak MA, Mukhtar A, Afaq SK (2020) Application of nano-fluids as coolant in heat exchangers: A review. J Adv Rev Sci Res 66(1): 8-18.
- Xuan Y, Li Q (2000) Heat transfer enhancement of nanofluids. International Journal of heat and fluid flow 21(1): 58-64.
- Haas KH (2013) Industrial relevant production processes for nanomaterials and nanostructures. 29-61 CRC Press, Boca Raton, FL, USA.
- Chiang WC (2013) Investigations and developments on thermo-electric performance of nanofluids. (NTOU master’s dissertation).
- Routledge R (1881) A popular history of science. G Routledge and Sons.
- Ruben S, King CV (1975) The founders of electrochemistry. Journal of The Electrochemical Society 122(10): 346C.
- Zimmer N, Holst B (2002) Representations of electricity: The development of a visual language for electrical phenomena. Interdisciplinary Science Reviews 27(4): 257-270.
- Faraday M (1832) Experimental researches in electricity. Philosophical Transactions 122.
- Harned HS, Owen BB, King CV (1959) The physical chemistry of electrolytic solutions. Journal of The Electrochemical Society 106(1): 15C.
- Lewis PM, Rosenfeld JV (2016) Electrical stimulation of the brain and the development of cortical visual prostheses: An historical perspective. Brain research 1630: 208-224.
- Wang JC (2012) Novel green illumination energy for LED with ocean battery materials. International Journal of Materials and Product Technology 44(3-4): 187-200.
- Wang JC, Chiang WC (2013) Researches on thermo-electric properties of seawater and Al2O3 In Applied Mechanics and Materials 394: 14-19.
- Wang RT, Wang JC (2016) Alumina nanofluids as electrolytes comparisons to various neutral aqueous solutions inside battery. Journal of Mechanics 32(3): 369-379.
- Kakac S, Pramuanjaroenkij A (2009) Review of convective heat transfer enhancement with nanofluids. International Journal of Heat and Mass Transfer 52(13-14): 3187-3196.
- Ghadimi A, Saidur R, Metselaar HSC (2011) A review of nanofluid stability properties and characterization in stationary conditions. International Journal of Heat and Mass Transfer 54(17-18): 4051-4068.
- Minea AA (2017) Hybrid nanofluids based on Al2O3, TiO2 and SiO2: Numerical evaluation of different approaches. International Journal of Heat and Mass Transfer 104: 852-860.
- Heris SZ, Mohammadpur F, Shakouri A (2014) Effect of electric field on thermal performance of thermosyphon heat pipes using nanofluids. Materials Research Bulletin 53: 21-27.
- Wu J, Zhao J, Lei J, Liu B (2016) Effectiveness of nanofluid on improving the performance of microchannel heat sink. Applied Thermal Engineering 101: 402-412.
- Moraveji MK, Razvarz S (2012) Experimental investigation of aluminum oxide nanofluid on heat pipe thermal performance. International Communications in Heat and Mass Transfer 39(9): 1444-1448.
- Zhao N, Yang J, Li H, Zhang Z, Li S (2016) Numerical investigations of laminar heat transfer and flow performance of Al2O3–water nanofluids in a flat tube. International Journal of Heat and Mass Transfer 92: 268-282.
- Wang RT, Wang JC (2016) Alumina nanofluids as electrolytes comparisons to various neutral aqueous solutions inside battery. Journal of Mechanics 32(3): 369-379.
- Sarojini KK, Manoj SV, Singh PK, Pradeep T, Das SK (2013) Electrical conductivity of ceramic and metallic nanofluids. Colloids and Surfaces A: Physicochemical and Engineering Aspects 417: 39-46.
- Ganguly S, Sikdar S, Basu S (2009) Experimental investigation of the effective electrical conductivity of aluminum oxide nanofluids. Powder Technology 196(3): 326-330.
- Minea AA, Luciu RS (2012) Investigations on electrical conductivity of stabilized water based Al2O3 Microfluidics and Nano Fluidics 13(6): 977-985.
- Zakaria I, Azmi WH, Mohamed WANW, Mamat R, Najafi G (2015) Experimental investigation of thermal conductivity and electrical conductivity of Al2O3 nanofluid in water-ethylene glycol mixture for proton exchange membrane fuel cell application. International Communications in Heat and Mass Transfer 61: 61-68.
- Abdolbaqi MK, Azmi WH, Mamat R, Sharma KV, Najafi G (2016) Experimental investigation of thermal conductivity and electrical conductivity of Bio Glycol-water mixture based Al2O3 Applied Thermal Engineering 102: 932-941.
- Buckingham E (1915) The principle of similitude. Nature 96: 396-397.
- Adio SA, Mehrabi M, Sharifpur M, Meyer JP (2016) Experimental investigation and model development for effective viscosity of MgO-ethylene glycol nanofluids by using dimensional analysis, FCM-ANFIS and GA-PNN techniques. International Communications in Heat and Mass Transfer 72: 71-83.
- Wang JC, Wang RT (2011) A novel formula for effective thermal conductivity of vapor chamber. Experimental Techniques 35(5): 35-40.
- Wang JC, Wang RT, Chang TL, Hwang DS (2010) Development of 30Watt high-power LEDs vapor chamber-based plate. International Journal of Heat and Mass Transfer 53(19-20): 3990-4001.
- Wang JC (2011) Thermal investigations on LED vapor chamber-based plates. International Communications in Heat and Mass Transfer 38(9): 1206-1212.
- Vaschy A (1892) On the laws of similarity in physics. Telegraph Annals 19: 25-28.
- Buckingham E (1914) On physically similar systems; illustrations of the use of dimensional equations. Physical Review 4(4): 345.
- Hutter K, Jöhnk K (2013) Continuum methods of physical modeling. Continuum mechanics, dimensional analysis, turbulence. Springer Science & Business Media.
- Maxwell JC (1892) A treatise on electricity and magnetism. Clarendon, UK, Volume 1.
- Xuan Y, Li Q, Hu W (2003) Aggregation structure and thermal conductivity of nanofluids. AI ChE Journal 49(4): 1038-1043.
© 2023 Rong-Tsu Wang and Jung-Chang Wang. This is an open access article distributed under the terms of the Creative Commons Attribution License , which permits unrestricted use, distribution, and build upon your work non-commercially.
Editor In Chief


.jpg)


Signup for Newsletter

Quick Links
 Editorial Board Registrations
 Submit your Article
 Refer a Friend
 Advertise With Us
Our Recent Edition

.jpg)


Top Editors


.jpg)


.bmp)
.jpg)
.png)
.jpg)


.jpg)


.png)

.png)


.png)


Financial Support

Sponsors

Latest e-Books

Latest Video

 a Creative Commons Attribution 4.0 International License. Based on a work at www.crimsonpublishers.com.
Best viewed in
a Creative Commons Attribution 4.0 International License. Based on a work at www.crimsonpublishers.com.
Best viewed in