
- About Us
- Information
-

The Author ensures that the research has been conducted responsibly and ethically with adherence to all relevant regulations. read more..
- For Authors
- For Reviewer
- Manuscript Guidelines
- Membership
- Publication Ethics
-
- Journals
- Reprints
- e-Books
- Videos
- Policies
- Contact Us
 COVID-19
- Submissions


Full Text
Annals of Chemical Science Research
Estimating Soil Carbon Reservoir of the Yellow River Basin in China
Nie Lanshi1, Han Wei2,3*, Yang Fan2,3* and Song Yuntao3
1Key Laboratory of Geochemical Exploration of Ministry of Natural Resources, China
2Institute of Geophysical and Geochemical Exploration, Chinese Acamedy of Geologcial Sciences, China
3UNESCO International Centre on Global-scale Geochemistry, China
*Corresponding author:Han Wei and Yang Fan, Institute of Geophysical and Geochemical Exploration, Chinese Acamedy of Geologcial Sciences and UNESCO International Centre on Globalscale Geochemistry, China
Submission: December 12, 2022;Published: December 19, 2022

Volume3 Issue3December , 2022
Abstract
Soil carbon bank of the Yellow River basin in China was estimated, by using the total carbon concentration and organic carbon content in the top and deep soil, and soil type and bulk density data. The results show that, from 2010 to 2018, the organic carbon reserves and the total carbon reserves of surface soil in the Yellow River basin increased by 581×106t and 692×106t. And the total carbon reserves and the total carbon reserves of deep soil in the Yellow River basin increased by 803×106t and 596×106t. It is indicated that the soil carbon reserves in the Yellow River basin have a large increasing trend between 2010 and 2018. This result can provide reference for the study of ecological environment change in China and the world.
Introduction
The issue of global environmental change has attracted increasing attention from more and more countries, due to implementation of the International Geosphere-Biosphere Program (IGBP) initiated in 1980. The study of global change has aroused the attention of many scientists on the carbon balance, carbon storage and distribution in the terrestrial ecosystem, because the carbon stored in soil is about 2.5~3 times that in vegetation [1,2]. The carbon construction is an extremely important ecological factor in the global biogeochemical cycle, which has been well used in environment-ology, ecology, soil science, geography, etc. Therefore, the characteristic of distribution and transformation of soil carbon has become a research hotspot and one of the core contents of international global change research now [3]. This paper depicts a successful example for estimating soil carbon reservoir for study of global environmental change, which can be used as a reference for future environmental conservation studies.
The Yellow River is the second longest river in China with a basin area of about 894,000 square kilometers. The average elevation is over 4000 meters in the western area, which consists of a series of alpine mountains and glacial landform development. The elevation is between 1000 meters and 2000 meters in the central loess region. Due to serious land erosion, degradation and desertification, the carbon and biomass stored in the soil has been reduced obviously.
This paper aims to reveal the formation mechanism of change degree and trend of soil carbon reserves in the Yellow River Basin through the comparative study of carbon storage in 2010 and 2018 and to provide scientific basis for the study of ecological environment change in the Yellow River Basin.
Materials
The data used in this study is from the China Geochemical Benchmark Program [4]. One top-soil sample and one deep soil sample were collected from two catchment basins in each sampling grid (about 80km×80km) at the same time. In order to improve the representation of the samples, all sampling points were deployed according to watershed, with the area of each catchment basins ranging from 1000 square kilometers to 5000 square kilometers, and most of them ranging from 2000 square kilometres to 3000 square kilometres. The surface samples were collected from soil layer A (0-25cm), and the deep samples were collected from the soil layer below 100cm or the soil layer C. Each top sample was gathered from six sub-sites within 100 m of the designed sampling point. Samples were collected twice in 2010 and 2018 respectively, with a total of 455 sampling points in this area (Figure 1) and 910 samples were collected. Flood plain sediment or alluvial plain soil was collected in the eastern hilly and plain areas. Floodplain sediments were collected in the southwest alpine cutting area. The low-lying sediments of the basin were collected in the northern arid Gobi Desert area. Seasonal dry lake (quagmire) deposits were collected in the inner river basin of semi-arid grassland.
Figure 1:Map of sampling sites 1.Frigid plateau solonchaks; 2.Frigid calcic soils; 3.Alluvial soils; 4.Brown pedocals; 5.Paddy soils; 6.Fluvo-aquic soils; 7.Cumulated irrigated soils; 8.Gray-browndesrt soils; 9.Grey-cinnamon soils; 10.Sierozem; 11.Solonchaks; 12.Litho soils; 13.Lime concretion black soils; 14.Felty soils; 15. Meadow soils; 16. Cinnamon soils; 17. Aeolian soils; 18. Cultivated loessial soils; 19. Dark loessial soils; 20. Dark felty soils; 21. Chernozems; 22 Castanozems; 23.CGB sampling site.

All the samples were first air-dried at room temperature. After drying, the samples were sieved and gathered the size fraction of <2mm. Then, each of the <2mm samples was ground to <0.074mm. The analytical procedures followed those in the RGNR guidelines [5]. Certified reference materials (CRMs) developed by IGGE [6,7], equal to about 8% of the total samples, were inserted randomly into each batch of 50 samples and analyzed along with field samples. Organic carbon was determined by oxidative pyrolysis-potential method (POT). Total carbon was determined by oxidative pyrolysisgas chromatography method (GC). The detection limits of organic carbon and total carbon are both 1% .
Method of calculation
First, according to the actual survey information of 455 points, the calculated thickness and the soil types involved were determined. The final surface layer thickness was determined to be 0.3m, an deep layer thickness was 1.5m. Secondly, GIS method was used to determine the area of each soil type involved in this work [8]. Soil bulk density at each sampling site was gathered from the Harmonized World Soil Database (HWSD) constructed by Food and Agriculture Organization of the United Nations (FAO) and Vienna International Institute for Applied Systems (IIASA) [9]. When the bulk density contains many different values in a soil type , the arithmetic mean value is taken. Finally, carbon storage in the Yellow River Basin can be calculated as:
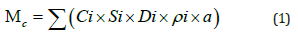
where Mc is the calculated carbon reserve value (t), Ci is the carbon content (%) of class i soil type, Si is the area of class i soil type (km2), Di is the sample’s collection depth (m) in class i soil type, ρi is the average soil bulk weight (g/cm3) in i soil type, and a is the conversion coefficient, the value of a is 104.
Results and Discussion
The results of soil carbon storage estimation in the Yellow River Basin are shown in Table 1. It can be seen that the area of soil types sampled accounts for 88% of the total area of the Yellow River Basin, and a small part of soil types are not covered. The organic carbon reserves of topsoil and deep soil accounted for 49% and 32% of the total carbon reserves respectively in 2018. While the organic carbon reserves of topsoil and deep soil accounted for 45% and 30% of the total carbon reserves respectively in 2010. It indicates that the proportion of organic carbon in this area is smaller than that in other areas of China [10], which is consistent with the results of soil desertification, less vegetation cover on the surface and less organic carbon stored in the Yellow River Basin.
Table 1:Note: CGB: China Geochemical Baselines; T: Top; D:Deep

The results show that the total carbon reserves and the organic carbon reserves of surface soil in the Yellow River basin increased 692106 tons and 581106 tons from 2010 to 2018 respectively. The total carbon reserves and the organic carbon reserves of deep soil in the Yellow River basin increased 596106 tons and 803106 tons from 2010 to 2018 respectively. It indicates that both topsoil and deep soil carbon reservoir in the Yellow River Basin have an increasing trend during the two working times, which means the Yellow River basin is a carbon sink and organic carbon sink is the main source of total carbon sink.
Organic carbon in soil refers to humus, animal and plant residues and microorganisms formed by microbial action. Surface vegetation can bring a large amount of organic carbon input to soil. Based on the special geographical location and geomorphic type of the Yellow River Basin, soil and water loss in this region is easy and soil carbon storage is continuously lost. However, through the unremitting efforts of human beings, according to China Ecological Governance Development Report (2020-2021) [11], it is believed that the ecosystem of the Yellow River Basin is continuously improving at a high speed. Some scholars have comprehensively evaluated the status of ecosystem quality in the Yellow River Basin from 2000 to 2018 based on the remote sensing ecological index [12] and the results shows that the improvement of ecosystem quality in the Yellow River Basin in recent 20 years is much higher than the degradation, and the ecosystem quality in the Yellow River Basin will be mainly improved in the future, and the continuous improvement will inevitably lead to carbon sink. which has been confirmed in this calculation results. The calculation results in our study is in good agreement with this point also.
Conclusion
In conclusion, the carbon storage in the Yellow River Basin increased from 2010 to 2018. This study directly proves that the regional ecosystem quality in the Yellow River Basin has been improved. This study will provide a scientific basis for explaining and predicting the improvement of ecosystem in the region.
<Conclusion
Paper colorimetric detectors can be used for testing different PDMS membranes to select the best one for the IMS instrument. We want to select a thin membrane, relatively strong due to the presence of mechanical support and modified with PEO or PPO derivatives rapidly reacting to the CWA simulants action in the gas phase.
References
- Post WM, Peng TH, Emanuel WR(1990) The global carbon cycle. American Scientist 78(4): 310-326.
- Houghton RA, Skole DL, Carbon A (1990) The earth as transformed by human action. Cambridge University Press, pp. 393-408.
- Wang YF, Chen ZZ, Larry T Tieszen (1998) Distribution of soil organic carbon in the major grasslands of xilingguole, inner mongolia ,China. Acta Phytoecologica Sinica 22(6): 545-551.
- Wang XQ, Zhou J, Xu S F(2016) China soil geochemical baselines networks: Data characteristics. Geology in China 43(5): 1469-1480..
- Yang F, Xie SY, Carranza EJM, Yao LY, Tian H, et al. (2019) Vertical distribution of major ore-forming elements and the speciation in the semiarid system above the concealed Baiyinnuoer Pb-Zn deposit in inner Mongolia, China. Geochem Explor Environ Anal 19: 46-57.
- Xie XJ, Yan MC, Li LZ, Shen HJ (1985) Usable values for Chinese standard reference samples of stream sediments, soils, and rocks: GSD 9-12, GSS 1-8 and GSR 1-6. Geostandards and Geoanalytical Research 9(2): 277-280.
- Xie XJ, Yan MC, Wang CS, Li LZ, Shen HJ (1989) Geochemical standard reference samples GSD 9-12, GSS 1-8 and GSR 1-6. Geostandards Newsletter 13(1): 83-179.
- Xiong Y, Li QK (1978) China Soil. Science Press, pp. 1-730.
- Nachtergaele F, Van Velthuizen H, Verelst L (2009) Harmonized World Soil Database Version 1.1.
- Xia XQ, Yang ZF, Yu T (2018) Series parameters of soil carbon density in China. Geology Press, Beijing, pp.191-197.
- Li Q, Yu FW, Sha T (2021) China ecological governance development report(2020~2021). Social Sciences Academic Press(China), pp. 245-269
- Li GW, Gao XQ, Xiao NW (2021) Spatial and temporal Changes of ecosystem quality based on key indicators in Yellow River basin from 2000 to 2018. Research of Environmental Sciences 34(12): 2945-2952.
© 2022 Han Wei and Yang Fan. This is an open access article distributed under the terms of the Creative Commons Attribution License , which permits unrestricted use, distribution, and build upon your work non-commercially.
Editor In Chief


.jpg)


Signup for Newsletter

Quick Links
 Editorial Board Registrations
 Submit your Article
 Refer a Friend
 Advertise With Us
Our Recent Edition

.jpg)


Top Editors


.jpg)


.bmp)
.jpg)
.png)
.jpg)


.jpg)


.png)

.png)


.png)


Financial Support

Sponsors

Latest e-Books

Latest Video

 a Creative Commons Attribution 4.0 International License. Based on a work at www.crimsonpublishers.com.
Best viewed in
a Creative Commons Attribution 4.0 International License. Based on a work at www.crimsonpublishers.com.
Best viewed in