
- About Us
- Information
-

The Author ensures that the research has been conducted responsibly and ethically with adherence to all relevant regulations. read more..
- For Authors
- For Reviewer
- Manuscript Guidelines
- Membership
- Publication Ethics
-
- Journals
- Reprints
- e-Books
- Videos
- Policies
- Contact Us
 COVID-19
- Submissions


Full Text
Annals of Chemical Science Research
The Determination of Optical Properties of Papers and a Paper Board
Katerina Chryssou* and Eugenia Lampi
General Chemical State Laboratory, Β΄ Chemical Service of Athens, Greece
*Corresponding author: Katerina Chryssou, General Chemical State Laboratory, Β΄ Chemical Service of Athens, An. Tsocha 16, 11521 Athens, Greece
Submission: May 02, 2022;Published: May 20, 2022

Volume3 Issue1May, 2022
Abstract
Reflection graphs of four paper samples were recorded at room temperature in the wavelength range 400-700nm. From the UV-Vis data and using the Kubelka-Munk equation we calculated the indirect band gap energies of four different paper samples. The indirect band gap for tissue paper was estimated to be 1.169844796675eV, that of copy paper A4 axion sample of 1.169844772981780eV, of velvet board of 1.169844786551eV, and finally of Α4 copy paper maestro of 1.1698447698146900eV. The indirect band gap value was higher for tissue paper and proceeded decreasing from velvet board to copy paper A4 axion, and finally copy paper A4 maestro. The band gap energy was determined using the Tauc method. The Urbach energy for tissue paper was calculated to be 199.23meV. The Urbach energy for axion Α4 copy paper was calculated to be 324.23meV. The Urbach energy for velvet board was calculated to be 71.12meV. And finally, the Urbach energy for Α4 copy paper maestro was calculated to be 341.17meV. The Urbach energy varied inversely to the band gap for all four paper samples.
Keywords: Paper samples; Reflection graph; Kubelka-Munk equation; Indirect band gap; Tissue paper; Copy paper A4; Velvet board; Urbach energy
Introduction
Paper samples are interesting and useful materials for applications in optoelectronics. In view of this UV-VIS spectrophotometry [1] offers an easy and reliable way of investigating the band gap [2,3] of paper samples and the tailing in the band gap. The difficulties encountered in the analysis of real samples such as A4 copy paper, tissue paper and paper board, stem from their chemical complexity as there are differences between fibre properties and paper properties [4]. In general, most of the samples encountered in quantitative analysis laboratory are not real, because they are generally homogeneous, usually stable, readily soluble, and chemically simple [5]. As a consequence, there are not found in the literature well-tested analytical routes for the kind of the above samples and existing procedures must be modified to take into account compositional differences between the samples present and the samples for which the original method was designed.
The knowledge of the optical properties of paper is important in the papermaking industry. The Kubelka-Munk model is a successful model of describing the optical properties of paper samples. With this model the optical properties of paper are studied under diffuse illumination [6]. In this work an instrument for the measurement of the diffuse radiance factor (reflectance factor) is used [7-9]. This radiance factor, because the paper samples measured contain fluorescent whitening agents, is the sum of the reflected radiance factor and the luminescent radiance factor.
Most white papers, like tissue paper, copy paper and paper board appear colorless but are in reality tinted with dyes or colored pigments to maintain a specific shade of white. This is true of white printing paper [10], but also of the coated paper and board, and tissue. The band gap energy (Eg) is a characteristic feature of all materials which determines their application potential. It depends on the material as well as on its characteristics like crystallinity [11] and stoichiometry. Most optical and electrical properties of semiconductors are well explained by the band gap model [12]. Estimation of band gap is very significant in the characterization of the material. Diffuse Reflectance Spectroscopy is a simple but powerful spectroscopic tool to estimate the band gap energy of solid samples such as paper. From the diffuse reflectance spectra, the band gap of each paper sample could be estimated. The optical properties are also useful in studying absorption characteristics and the disorder present in the materials. The relation is examined between Eg (band gap energy) and thickness and the tailing in the Eg. In this work the reflection graphs, the thicknesses [13], the band gap energies Eg and Urbach energy tails (Eu) of the four paper samples are studied [14].
Materials and Methods
Instruments and materials
A spectrophotometer CM-3630 was used for the measurement of the optical properties of the paper samples. It was a model BCMTS M Type 40605, with Touchscreen M software of the company Frank-PTI, Germany. The spectrophotometer was connected to a computer Asus with windows 7Pro, a flat display Hanns. G, a keyboard Logitech K120, a mouse Logitech RX250, and a printer HP Laser Jet P1102. The reflectometer had reference standards for its calibration, a non-fluorescent standard CNF-082, and a fluorescent standard CF-082. It also had a non-fluorescent calibration plate of ceramic, a non-fluorescent working standard, Konica Minolta, made in Japan, no20286101. It was also accompanied by a black cavity, made in Japan, for calibration of the low end of the photometric scale. The black cavity was stored in a black box with a protective cover, so it was in a dust-free environment.
The instrument was specifically intended for the measurement of diffuse radiance factor or diffuse reflectance of paper, paper board, pulp and related products. The spectrophotometer employed an integrating sphere optical system as defined by ISO standard 2469 [8]. The measurements taken with this instrument were termed diffuse reflectance (diffuse radiance factor) and measurements like the brightness were also included, which were referred to as directional reflectance measurements. The optics of the spectrophotometer contained the integrating sphere, the lamps and all associated optical components. Diffuse reflectance spectra were collected for the samples in the wavelength range of 400- 700nm. In the instrument used the light source was daylight with UV defined. It was the standard illuminant D65 with color temperature 6504K and had similar spectral distribution to illuminant C. The D65 standard illuminant was similar in spectral distribution to illuminant C in the visible part of the electromagnetic spectrum. The D65 illuminant was defined in the UV, but the illuminant C was not.
For the measurements in this work, with regard to paper brightness tester, it was used diffuse geometry and it was the diffuse illumination-0o viewing (d/0o) geometry. The light source was the actual light energy striking the specimen during the measurement. On the other hand, the illuminant, was the light striking the sample in a measuring instrument, and it was provided by a source, filtered quartz tungsten halogen lamp, which was filtered in order to alter its spectral energy distribution. The thickness of the copy paper samples was measured using a digital precision micrometer TMI (Testing Machines INC) Model No 49-61-01-0002, S.N. 33421-01 with range 0-1.270mm. The thickness of the paper samples was measured in the range 100±10μm and with ±5.5μm uncertainty.
The structural properties of the paper samples used for the measurement of the optical properties
When a ray of light struck a sheet of paper, they occurred four possible results, i.e., specular reflection (gloss), transmission, scattering and absorption (heat). The reflection was primarily reflection from the top surface of the sheet of paper and was known as specular reflectance [15]. The cellulosic fibers were colorless and thus a cross-section of a sheet of paper could be thought of as a mass of intertwined cellulosic fibers. As the light struck a cellulosic fiber some of the light rays would specularly reflect from the surface of the fiber and other rays would pass through the nearly transparent fiber and would be refracted as they passed through [16]. As the direction of the light ray had been changed by one cellulosic fiber it would then encounter another fiber and its direction would be changed again. Of course, the paper samples entering our laboratory for tests were not composed of pure cellulose only, but they contained lignin and other colored impurities. In this case light absorption occurred because the light ray struck a nontransparent or colored matter in the sheet of paper. The light ray struck the colored matter in the paper sample and the light energy was absorbed and converted to heat, and thus the light was not reemitted from the sheet of paper, and the reflectance measured was lowered.
Measurement of brightness
Brightness was the reflectance of blue light. This light had a very specific spectral distribution as defined in ISO 2469 [8]. This function had an effective wavelength of 457nm and it was distributed throughout the spectral range of 400nm to 500nm. The brightness measurement took into consideration only the blue part of the visible spectrum and ignored the yellow and the red portion of the spectrum. For the measuring of brightness, we took from the pack of the paper sample 10 sheets of paper, without surface marks into specimens of 100mmx100mm dimension [17]. The paper specimens were put one of top of the other and from the same side of the paper sheet and they formed a packet of ten specimens. The measuring of brightness was performed without any sample conditioning. The measurement of brightness was performed on common laboratory conditions (22 ˚C and 52%r.h.). The procedure of measurement included the measurement of each paper specimen having the rest as backing. For each side of paper were taken 10 measurements.
Results and Discussion
In this work we measured the diffuse radiance factor (reflectance factor). Since light cannot penetrate opaque, solid samples, it was reflected on the surface of the paper samples. Incident light reflected symmetrically with respect to the normal line was called specular reflection while incident light scattered in different directions was called diffuse reflection. With the integrating sphere, measurement was performed by placing the sample in front of the incident light window and concentrating the light reflected from the sample on the detector using a sphere with barium sulfate-coated inside. The obtained value became the reflectance (relative reflectance) with respect to the reflectance of the reference standard which was taken to be 100%.
The reflectance values obtained from experiments on four samples of white papers and boards in our laboratory were collected over the full visible spectral range (VIS). For the measurements in this work, we used the diffuse illumination 0o viewing (d/0o) geometry which corresponds to ISO Standard 2469 [8]. This geometry averaged the non-uniformities in the sample of paper, and it also averaged directionality effects, so the machine direction measurement and the cross-machine direction measurement were the same. The UV-Vis reflectance spectrum was utilized to investigate the various characteristics of the paper samples. The reflection graphs for each of the four paper samples were presented. The optical absorption spectra of the paper samples were recorded at room temperature in the wavelength range 400-700nm. UV-VIS spectrophotometry was used to explore the optical bandgap with associated Urbach (Eu).
The equation of Kubelka-Munk [6] states that:
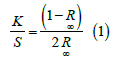
The K/S ratio for the tissue paper was found to be K/ S=41.91082683, and the reflectance ISO brightness used was measured to be 85.81%. The ISO brightness measured was the numerical value of the reflectance of the paper samples at 457nm, blue light reflectance (Figure 1,2).
Figure 1:Reflection Graphs for tissue paper sample: 1: D65 brightness, 2.ISO brightness (Reflection% C/2) 3.ISO brightness-UV (Reflection% with filter) 4. Opacity (Reflection% over black).

Figure 2:(K/S hv)2 versus hv graph of the cellulosic chromophores in tissue paper for the calculation of band gap energy for permitted indirect transitions n=2.

UV-Vis data revealed the value of indirect bandgap energy [18] of 1.169844796675eV for tissue paper sample. The K/S ratio for the A4 AXION copy paper sample was found to be K/S=47.52515251 and the reflectance ISO brightness used was measured to be 97.04% (Figure 3,4).
Figure 3: Reflection Graphs for copy paper A4 AXION sample: 1: D65 brightness, 2.ISO brightness (Reflection% C/2) 3.ISO brightness-UV (Reflection% with filter) 4. Opacity (Reflection% over black).

Figure 4: (K/S hv)2 versus hv graph of the cellulosic chromophores in copy paper A4 axion for the calculation of band gap energy for permitted indirect transitions n=2.

UV-Vis data revealed the value of indirect bandgap energy of 1.169844772981780eV for copy paper A4 axion sample. The K/S ratio for the velvet board was found to be K/S=44.05554939 and the reflectance ISO brightness used was measured to be 90.10% (Figure 5,6).
Figure 5: Reflection graphs for velvet board sample: 1: D65 Brightness, 2.ISO Brightness (Reflection% C/2) 3.ISO Brightness-UV (Reflection% with filter) 4. Opacity (Reflection% over black).

Figure 6: (K/S hv)2 versus hv graph of the cellulosic chromophores in velvet board for the calculation of band gap energy for permitted indirect transitions n=2.

UV-Vis data revealed the value of indirect bandgap energy of 1.169844786551eV for velvet board sample. The K/S ratio for the A4 maestro paper was found to be K/S=48.4600551 and the reflectance ISO brightness used was measured to be 98.91% (Figure 7,8).
Figure 7: Reflection graphs for copy paper A4 maestro sample: 1: D65 Brightness, 2.ISO Brightness (Reflection% C/2) 3.ISO Brightness-UV (Reflection% with filter) 4. Opacity (Reflection% over black)

Figure 8: (K/S hv)2 versus hv graph of the cellulosic chromophores in copy A4 maestro paper for the calculation of band gap energy for permitted indirect transitions n=2.

UV-Vis data revealed the value of indirect bandgap energy of 1.1698447698146900eV for copy paper A4 maestro sample. The linear absorption coefficient was determined by using the reflectance spectra of the four paper samples via following relation [19],
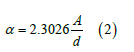
where α was the absorption coefficient [20,21], A was the absorption in % as estimated from the UV-Vis reflectance data and d was the thickness of the paper samples.
For the calculation of direct and indirect band gap energies the following equation was applied

where Eg was the band gap energy and was direct or indirect depending on the value of x, and K was a proportionality constant, and α was the absorption coefficient. For permitted indirect transitions x had the value 2. If x=1/2, then the above equation (3) gave the values of the allowed direct transition.
In the Urbach’s tail range the absorption coefficient α [22] showed an exponential dependence on photon energy E, and obeyed the relation
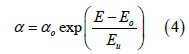
where α was the absorption coefficient, αο was a constant, E was energy, Eo corresponded to the energy close to that of the bandgap at low temperature, and Eu was the Urbach energy [23] i.e., the width of the band tail of the localized states in the bandgap [24]. The slope of the ln(α) versus hv plot in the lower photon energy region was used for the calculation of Eu (Urbach energy) of each paper sample [25]. The values of the Urbach energy Eu [26], were calculated by taking the reciprocals of the slopes of the linear portion of the lnα versus hv curves in the lower photon energy regions. These values for all paper samples are given in Table 1.
Table 1: Optical band gap energies (eV) [27], Urbach energies (m eV), and thicknesses (mm) of the four paper samples, and basis weight (g/sqm) [28]. Urbach energy of paper samples was calculated by the slope of the best fit line through vertical slope segments of plots from (Figure 9-12).

The Urbach energy of the copy paper A4 maestro was calculated by the slope of the best fit line through the vertical segment of the plot of Figure 9. The slope was calculated to be 2.9311eV and the Urbach energy of 341.2meV for A4 copy paper maestro as listed in Table 1. Also, the slope was calculated to be 3.0842eV and the Urbach energy of 324.2meV for axion A4 copy paper as listed in Table 1 (Figure10). The slope was calculated to be 5.0192eV and the Urbach energy of 199.2meV for tissue paper as listed in Table 1 (Figure 11). The slope was calculated to be 14.06eV and the Urbach energy of 71.1meV for velvet board as listed in Table 1 (Figure 12).
Figure 9: Plot of ln(α) versus photon energy hv for the calculation of Urbach energy of the copy paper A4 maestro.

Figure 10: Plot of ln(α) versus photon energy hv for the calculation of Urbach energy of the copy paper A4 axion copy paper.

Figure 11: Plot of ln(α) versus photon energy hv for the calculation of Urbach energy of the tissue paper.

Figure 12: Plot of ln(α) versus photon energy hv for the calculation of Urbach energy of the velvet board.

Figure 13: Plot of ln(αhv) versus photon energy hv for the calculation of Urbach energy of the copy paper A4.

The Urbach energy of the copy paper A4 maestro was calculated again by the slope of the best fit line through the vertical segment of the plot of Figure 13. The slope was calculated to be 2.0353eV and the Urbach energy was of 491.328meV for A4 copy paper maestro. The density [29] of tissue paper was calculated to be 0.264256g/ sqm. The density of axion Α4 copy paper was calculated to be 0.7499g/sqm. The density of velvet board was calculated to be 1.1370g/sqm. The density of A4 copy paper maestro was calculated to be 0.8002g/sqm. The specific volume [29] of tissue paper was calculated to be 3.784209252cm3/g. The specific volume of A4 axion copy paper was calculated to be 1.333517845cm3/g. The specific volume of velvet board was calculated to be 0.879481106cm3/g. The specific volume of A4 copy paper maestro was calculated to be 1.24965119cm3/g. The higher value of specific volume of tissue paper indicated a higher bulk. Then the specific volume of A4 axion copy paper was higher and calculated to be 1.333517845cm3/g. Then the bulk diminished from A4 copy paper maestro, and then to 0.879481106cm3/g for velvet board. The band gap energy of tissue paper had the higher value, then it was velvet board, and then axion A4 copy paper and finally maestro A4 copy paper.
Conclusion
In this work UV-VIS spectroscopy was performed to calculate the indirect band gap energies and Urbach energies of four paper samples. In summary we observed trends in the optical properties of paper samples. Band gap energy was determined using the Tauc method [30]. The band gap energy of a semiconductor describes the energy needed to excite an electron from the valence band to the conduction band. An accurate determination of the band gap energy was crucial in predicting photophysical and photochemical properties of semiconductors, like thin paper samples. A decrease in Urbach energy with an increase in thickness and an increase in energy band gap with an increase in thickness was observed for the four different paper samples tested at room temperature. The Urbach energy varied inversely to the band gap for all four paper samples [31]. The compositional decrease in Urbach energy can be explained by decreasing of the disorder in the paper samples. This work contributed to understanding that the energy tails can be optimized to engineer the optical band gap for applications in the field of thin paper samples.
References
- Patrycja M, Michal P, Wojciech M (2018) How to correctly determine the band gap energy of modified semiconductor photocatalysts based on UV-Vis spectra. J Phys Chem Lett 9(23): 6814-6817.
- Nicola S, Lucrezia A, Roberta T, Roberto V (2017) Spectrophotometric method for optical band gap and electronic transitions determination of semiconductor materials. Opt Mater 64: 18-25.
- Ghobadi N (2013) Band gap determination using absorption spectrum fitting procedure. Int Nano Lett 3(2): 1-4.
- Anna J (2011) Correlations between fibre properties and paper properties, Master Thesis in Pulp Technology, KTH, School of Chemical Science and Engineering (CHE) Sweden, pp.1-49.
- David H (2021) Obtaining and preparing samples for analysis, Chemistry Libre Texts, DePauw University,
- Vesna D, Zeljka B, Katarina I (2012) Kubelka-Munk theory in describing optical properties of paper. Technical Gazette 19(1): 191-196.
- Arthur JR (1981) Measurement of reflectance factors under daily and intermittent irradiance variations. Appl Opt 20(19): 3336-3340.
- ISO 2469:2014, Paper, board and pulps-measurement of diffuse radiance factor (diffuse reflectance factor), pp.1-19.
- ASTM E313-10 Standard practice for calculating yellowness and whiteness indices from instrumentally measured color coordinates, pp. 1-6.
- Casey JP (1980) Pulp and paper, chemistry and chemical technology. (3rd Edn), 3(19):
- Ovshinsky SR, Fritzsche H (1971) Reversible structural transformations in amorphous semiconductors for memory and logic. Metall Trans 2: 641-645.
- Tauc J (1968) Optical properties and electronic structure of amorphous Ge and Si. Mat Res Bull 3(1): 37-46.
- Vedeshwar AG (1995) Optical Properties of Amorphous and Polycrystalline Stibnite (Sb2S3) Films. J Phys III France 5: 1161-1172.
- Qindeel RN, Alonizan MR, Baig WA, Farooq SS, Al-Ghamdiand MS, Al-Garawi, (2015) Study of optical properties of alpha and Nd:YAG Laser Irradiated Cellulose Nitrate Polymer. Org Opto-Elect 1(1): 17-24.
- Alexandra CS, Pascal B, Katia D (2019) Material category determined by specular reflection structure mediates the processing of image features for perceived gloss. bio Rxiv,1-45.
- Yu Y (2015) UV interactions with fibers and fibrous structures, Thesis submitted in fulfilment of the requirements for the degree of Doctor of Philosophy, Deakin University, Australia, 1-283.
- ISO 2470-1:2009 Paper, board and pulps-measurement of diffuse blue reflectance factor. Part 1: Indoor daylight conditions (ISO Brightness) pp.1-10.
- Omer Bahadir M, Ertan A, Selim K, Onder P (2018) Effects of GNP addition on optical properties and band gap energies of PMMA films. Polym Compos 40(5): 1-8.
- Mahbubur Rahman M, Hussein AM, Zhong-Tao J, Mohmmednoor A, Lee Siang C, et al. (2017) Investigation of the post-annealing electromagnetic response of Cu-Co oxide coatings via optical measurement and computational modelling. RSC Adv 7: 16826-16835.
- Chaudhry MA, Anwar Manzoor R, Altaf and Shakeel Bilal M (1995) Optical characteristics of some binary and ternary phosphate glasses. Aust J Phys 48: 887-892.
- Cody GD, Tiedje T, Abeles B, Moustakas TD, Brooks BY, Goldstein Y (1981) Disorder and the optical absorption edge of hydrogenated amorphous silicon. Phys Rev Lett 47(20): 301-304.
- Nadeem MY, Sadhana TB, Altaf MA (2004) Optical band gap in MnO-CdO-P2O5 Glasses. J Res Sci 15(3): 245-251.
- Subashiev AV, Oleg S, Zhichao C, Serge L (2010) Urbach tail studies by luminescence filtering in moderately doped bulk InP, Appl Phys Lett 97(18): 1-4.
- Shportko KV (2019) Disorder and compositional dependences in Urbach-Martienssen tails in amorphous (GeTe)x(Sb2Te3)1-x alloys. Scinetific Reports 9: 6030.
- Imtiaz A, Suhail HS, Ali R, Sajjad M (2021) Spectroscopic analysis for harnessing the quality and potential of gemstones for Small and Medium-Sized Enterprises (SMEs). J Spectrosc, pp. 1-12.
- Ravindra NM, Demichelis F (1985) Cody disorder: Absorption-edge relationships in hydrogenated amorphous silicon. Phys Rev B Condens Matter32(10): 6591-6595.
- Shaltout I, Yi Tang R, Braunstein EE (1996) FTIR spectra and some optical properties of tungstate-tellurite glasses. J Phys Chem Solids 57(9): 1223-1230.
- ISO 536:2012-Paper and board-Determination of grammage, pp.1-4.
- ISO 534:2011 (en)-Paper and board-Determination of thickness, density and specific volume, pp.1-13.
- Satheesh DJ, Jayakumari I (2014) Optical analysis, urbach and bandgap energy of Mn0.8+xZn0.2TixFe2-2xO4 with x=0.15-Manganese-Zinc Ferrite System doped with Titanium IJSR, pp. 605-610.
- Igweoko AE, Augustine C, Idenyi NE, Okorie BA, Anyaegbunam FNC (2018) Influence of processing conditions on the optical properties of chemically deposited Zinc Sulphide (ZnS) thin film. Mater Res Express 5(3): 036413
© 2022 Katerina Chryssou. This is an open access article distributed under the terms of the Creative Commons Attribution License , which permits unrestricted use, distribution, and build upon your work non-commercially.
Editor In Chief


.jpg)


Signup for Newsletter

Quick Links
 Editorial Board Registrations
 Submit your Article
 Refer a Friend
 Advertise With Us
Our Recent Edition

.jpg)


Top Editors


.jpg)


.bmp)
.jpg)
.png)
.jpg)


.jpg)


.png)

.png)


.png)


Financial Support

Sponsors

Latest e-Books

Latest Video

 a Creative Commons Attribution 4.0 International License. Based on a work at www.crimsonpublishers.com.
Best viewed in
a Creative Commons Attribution 4.0 International License. Based on a work at www.crimsonpublishers.com.
Best viewed in