
- About Us
- Information
-

The Author ensures that the research has been conducted responsibly and ethically with adherence to all relevant regulations. read more..
- For Authors
- For Reviewer
- Manuscript Guidelines
- Membership
- Publication Ethics
-
- Journals
- Reprints
- e-Books
- Videos
- Policies
- Contact Us
 COVID-19
- Submissions


Full Text
Annals of Chemical Science Research
Measurement of Raman Spectra for Surfactants Contained in a Textile Detergent Product and Three House Washing Detergent Products
Katerina Chryssou* and Eugenia Lampi
General Chemical State Laboratory, B’ Chemical Division of Athens, Greece
*Corresponding author: Katerina Chryssou, General Chemical State Laboratory, B’ Chemical Division of Athens, Greece
Submission: January 27, 2022;Published: February 10, 2022

Volume3 Issue1January, 2022
Abstract
Four common use detergent products were analyzed and their soluble-insoluble matter ethanolic 95%w/v was determined. Their soluble matter ethanolic was used to acquire their Raman spectra. Their pH values at 298K were measured also. Several Raman bands were related to –C-C- skeletal stretching vibrations in the region between 1000cm-1 and 1150cm-1, and a peak at 1430cm-1 was related to δ(CH2) deformation for the first detergent product. A band at 1290cm-1 was related to the -SO4 stretch for the surfactant lauryl sulphate. For the alcohols C12-14 ethoxylated sulphated sodium salts in the second detergent product the 1440cm-1 peak was attributed to C-H scissoring. The 1060cm-1 peak was corresponded to –C-C- skeletal stretching of the saturated fatty acid present also. The presence of the aromatic group in the surfactant benzene sulphuric acid C10-13 alkyl derivatives sodium salts was identified at 1615cm-1 in the Raman spectrum of the third detergent product. In the spectrum of the fourth detergent product a peak at 1300cm-1 was attributed to in-phase methylene twisting deformation vibration of the fatty acid sodium oleate. Also, the peaks at 1730cm-1 and at 1270cm-1 were attributed to sodium oleate. Then the alcohols ethoxylated Raman spectrum changes with pH were studied and shifting to longer wavelengths was observed for the second detergent product due to less coupling of the –C-C- stretching vibration to the –C-O- stretching vibration. The ratio of the intensities of anti-Stokes to Stokes lines was found to increase as the temperature increased for 20K for Raman scattering with the 1064nm excitation. Finally, the dissociation energy Do of the bond –C-C-O- in the alcohol C13-15 ethoxylated in the first detergent product was determined to be 386.148449cm-1, or 0.04787507086eV using the Birge-Sponer extrapolation.
Keywords: Surfactants; Alcohols ethoxylated; pH; Raman spectra; Stokes lines; Anti-Stokes lines; Dissociation energy; Birge-Sponer extrapolation
Introduction
To improve product performance and safety, surfactants [1,2] are used in combination in detergent products as anionic surfactants, nonionic, cationic or amphoteric surfactants. For the de-formulation of detergent mixtures different analytical methods [3] are used, like spectroscopic techniques, such as Raman spectra. Raman spectroscopy has an important role to play in organic structural analysis as have infrared spectra [4]. Vibrational spectra are ordinarily measured by two very different techniques. In infrared (ir) spectroscopy, light of all different frequencies is passed through the sample and the intensity of the transmitted light is measured at each frequency [5]. In Raman spectroscopy we do not observe transmitted light but light scattered by the sample [6]. In ir spectra all of the absorbed energy causes excitation of vibrational states, but in Raman only some of it does. The unabsorbed energy is scattered and its changed wavelength is detected and plotted in wavenumbers vs intensity. Unlike ir, Raman can detect vibrational absorptions even though there is no change in the dipole moment. A vibrational transition is ir active if the dipole moment of the molecule changes during the vibration. A transition is Raman active if the polarizability of the molecule changes during the vibration. Laser Raman spectroscopy is an ideal technique for the study of conformations of molecules, especially in aqueous solutions. Raman spectroscopy relates the spectrum of inelastically scattered light to the bond structure and chemical composition of the scattering material.
Raman spectrum was used to map the variations across living cells within their native environment, and investigate differences between chondrocytes and the relation between the lipid content of cells and their surrounding matrix [7]. Also, vibrational spectroscopy (FT-IR, FT-Raman) has been applied in typical conservational experimental analysis [8]. Raman spectra were used to explore carbon single-wall nanotubes (SWNTs) dispersed in various surfactants to determine the sensitivity of the metallic BWF (Breit-Wigner-Fano) line shape feature to bundling and nanotubesurfactant interactions [9-11]. Using Raman mapping, whereas single point Raman scattering spectrum was obtained before, was one of the techniques which were used to characterise the secondary structure of a tripeptide lysine-dityrosine (KYY) [12]. There were amide marker bands present, indicating the formation of a secondary structure with some stacking of tyrosine rings. Also, sample handling for the Raman study was simpler than for infrared because the measured wavenumber differences were between two visible frequencies [13]. In this study we try to analyze four commercial detergent products and to discover their structure using Raman spectroscopy.
Experimental
Reagents
All compounds were AR quality and they were used without further purification. All solutions were prepared using deionized water of conductivity <1μS/cm. Ethanol absolute anhydrous (1L) Carlo Erba UN1170 Gradient grade was used. Also, ethanol 95% v/v solution neutralized to the phenolphthalein solution was used.
Apparatus
pH measurements were obtained using a pH-meter Metrohm 716 DMS Titrino, Swiss made, with electrode. The accuracy precision of the instrument was given at ±0.2 from the manufacturer. Temperature of measurement was between 15 oC-25 oC (278K-298K). For the calibration of the instrument three buffers were used with accuracy ±0.5. One near the neutral point pH 7±0.5, the second at pH 4±0.5 and the third at pH 10±0.5. An Analytical balance Mettler Toledo AB 204-S/FACT accurate to 0.1mg, and with maximum capacity 220g, was used. Oven Memmert direkt, capable of being controlled at 103 0C ± 2 0C was also used. The water bath FALC, 220/240V, 50Hz was used.
FT-Raman spectra were obtained using a portable Rigaku Progeny ResQ spectrometer instrument with a 512pixel TE cooled In Gas detector, and laser excitation at 1064nm. The instrument had model number Progeny ResQ and serial number SN P14270001. The software version was 1.7.0.0 and the library version was 1.7.0.0. Raman Progeny ResQ Analyzer used a laser-emitting diode to produce a laser beam with specific properties for analyzing the samples. The instrument used a class 3B laser. The laser beam properties of Progeny ResQ were the laser output power, which was adjustable between from 30 to 490mW, the frequency which was 1064nm, the lens focal length was 11mm and the focused spot diameter was 25microns. The laser was operated to give 490mW power for liquid samples. The MPE (Maximum Permitted Exposure) for the instrument was 50W.m-2. The laser wavelength was set at 1064nm, next generation with minimal fluorescence issues. All spectra were recorded in the spectral range from 200 to 2500cm-1(1087-1450nm). The exposure time was from 1.5s-7.0s. Averages taken were from 1 to 3. The resolution spectral was 8-11cm-1 (FWHM) (Full width at half maximum) across range. The dispersion mode was transmissive VPG (Volume Phase Gratings). The collection optics were NA=0.25. Software was RAD Progeny ResQ. The internal battery was a 14.4V Li-Ion, 3100mAh, RAD part number 1004596, 18V DC, 2.5A. The external battery charger was 100-240VAc, 50-60Hz. The use of long wavelength laser such as the 1064nm InGaAs laser used for FT-Raman spectroscopy resulted in a significant reduction in fluorescence background. Care was taken to avoid wavelengths that caused the samples to fluoresce or to photo decompose. All spectra reported were recorded at room temperature (20 oC – 25 oC) (293K-298K).
Ordinary laboratory apparatus were beakers of capacity 250ml, 500ml volumetric flasks, funnels with diameter 80mm, glass containers Schott Duran of capacity 250ml, watch glasses with diameter 140mm, glass rods, filter paper Macherey-Nagel with diameter 125mm, and small bottles with cap ALWSCL for Raman spectra, of capacity 3ml.
Sample preparation
The samples of the detergent samples were analyzed directly and no sample preparation was required on the finished detergent products. The products composition was known according to safety data sheets. Four detergent products were analyzed, namely the textile detergent Dr. Beckmann, the house detergent Flos, the Ultra detergent for floors, and the Drolio detergent for marbles and tiles.
Analysis of detergent products
Procedure
Determination of soluble–insoluble matter ethanolic 95%w/v for the four detergent products and calculation of their percentage yield
We weighed 25.4557g of the textile detergent sample Dr. Beckmann, or 16.7832g of detergent sample Flos, or 15.6267g of detergent sample Ultra, or 25.3594g of detergent sample Drolio, in a 250ml beaker. We added 75ml ethanol 95w/v and we heated on a water bath for 2 hours while stirring often with a glass rod. The glass beaker was covered with a watch glass at all times. We then dried a filter paper to be used for the filtration of the insoluble matter, in the oven controlled at 103o ± 2 ˚C for 1hour. We allowed it to cool to ambient temperature in a desiccator for 20min and we weighed it to be 0.9732g for the sample Dr. Beckmann, or 1.0199g for the sample Flos, or 0.9748g for the sample Ultra, or 1.0136g for the sample Drolio. We placed it in a funnel mounted on a glass container on the water bath. When the dissolution of the detergent appeared to be complete, we decanted the supernatant liquid, on to the filter paper. After decantation we added 25ml of ethanol 95%w/v to the 250ml glass beaker and after heating it to near its boiling point, we transferred the insoluble matter to the filter paper with the aid of small quantities of the warm ethanol. The filter paper and the residue were washed with the warm ethanol until entirely free from detergent. We then dried the filter paper, in air and we placed it in the oven at 103o ± 2 ˚C. We also placed the beaker with the glass rod in the oven at 103o ± 2 ˚C. After 1hour we removed the filter paper, as well as the glass beaker and we left them in the desiccator for 20min for them to cool and we weighed them. Yield: 0.2693g, 1.06% w/w for Dr. Beckmann, or 0.0176g, 0.11%w/w for Flos, or 0.0165g, 0.1056w/w for Ultra, or 0.0128g, 0.05% w/w for Drolio detergent sample. The percentage yield was calculated as [(mass of insoluble matter ethanolic in g)*100/ (mass of detergent sample in g)]. The ethanolic solution of the filtrate in the glass container on the water bath was then heated. We evaporated off all of the ethanolic solution. We then heated the glass container with the soluble matter to constant mass in the oven controlled at 103˚ ± 2 ˚C. We finally cooled it in a desiccator and we weighed the contents. Yield:3.3566g–13.19%w/w for sample Dr. Beckmann, or 0.5691g-3.39%w/w for detergent sample Flos, or 0.2973g-1.903%w/w for sample Ultra, or 1.3184g-5.199%w/w for sample Drolio. The percentage yield was calculated as [(mass of soluble matter ethanolic in g)*100/(mass of detergent sample in g)].
Results and Discussion
Determination of pH of the four detergent products
The pH of the textile detergent Dr. Beckmann as it was, was measured pH 8.61 at 25 ˚C (298K). The pH of the detergent Flos as it was, was measured pH 6.91 at 25 ˚C (298K). The pH of the detergent Ultra as it was, was measured pH 7.33 at 25 ˚C (298K). Finally, the pH of the detergent Drolio as it was, was measured pH 8.47 at 25 ˚C (298K). The pH values obtained for the detergent products were pH 8.61, 6.91, 7.33, 8.47 respectively suggesting that macroscopic variations in pH were to some extent responsible for the differences seen as a function of surfactant [9].
Detergent products composition
The four detergent products composition was known according to safety data sheets. Firstly, a synthetic mixture of three surfactants contained in a Dr. Beckmann commercial textile detergent product, was composed of three major surfactants, alcohols C13-15 ethoxylated (R(OC2H4)nOH), R:C13-15, sodium 2-ethylhexyl sulphate (C8H17NaO4S), and sodium laureth sulphate (CH3(CH2)10CH2(OCH2CH2)nOSO3Na. The three identified raw materials composed the consumer household product. The constraints were defined based on the safety data sheet: non-ionic agent less than 10%w/w, anionic agent sodium laureth sulphate less than 5%w/w and sodium 2-ethylhexyl sulphate less than 5%w/w. The product composition was known according to safety data sheet. That was called the first detergent product.
Secondly, a synthetic mixture of two surfactants contained in a Flos commersial liquid detergent of general use for all surfaces in the house, washing product, was composed of two major surfactants, alcohols C12-14 ethoxylated sulphated sodium salts (<2.5 E.O.), CH3(CH2sub>)11sub>(OCH2CH2)nOSO3Na, an anionic surfactant, and poly(oxy-1,2-ethanediyl) alpha-tridecyl-omega-hydroxybranched, C15H32K3O6P, a non-ionic surfactant. This product composition was anionic 1%w/w and non-ionic 3%w/w. That was called the second detergent product.
Also, a synthetic mixture of two surfactants contained in an Ultra commercial liquid detergent for floors and surfaces washing product, was composed of two major surfactants, alcohols C12- 15 ethoxylated, R(OC2H4)nOH, R:C12-15,1%w/w, a non-ionic surfactant, and benzenesulfonic acid C10-13-alkyl derivatives sodium salts, C17H27NaO3S, 1%w/w, an anionic surfactant. That was called the third detergent product. Finally, a synthetic mixture of two surfactants contained in a Drolio commercial liquid detergent product for marbles and tiles with soap, was composed of two major surfactants, alcohols, C12-15, ethoxylated (7mol EO average molar ratio), (C2H4O)1-3(CH2sub>)10-13C2H6O, a non-ionic surfactant 4%w/w and soap sodium oleate, C18H33NaO2, 0.5%w/w, and solvent 2-butoxyethanol (C6H14O2) 2.4%w/w. That was called the fourth detergent product.
Acquisition of Raman-spectra of the four detergent products
Glass was employed for sample holder, for the Raman spectra. Water was a weak scatterer of Raman radiation. Thus, ethanolic solutions of the detergent samples, with traces of water, were employed for the Raman study. The pH of the first detergent product Dr. Beckmann (Figure 1), as it was, was measured pH 8.6 at 298K. The composition of the first detergent product was based on the safety data sheet, non-ionic 10%w/w, anionic sodium laureth sulphate 5%w/w, sodium 2-ethyl-hexyl sulphate 5%w/w. For the soluble matter ethanolic, for the first textile detergent product, the Raman spectra showed a Raman band related to the skeletal v(C-C) stretching vibration in the region between 1000 and 1150cm-1, a band at 1290cm-1 related to ν(SO4) stretch and one at 1430cm-1 related to δ(CH2) deformations [14] all related to lauryl sulphate. In the case of sodium laureth sulphate in the textile detergent product the 1084cm-1 peak appeared as a shoulder in the 1063cm-1 peak [2]. In the same product for the alcohols C13- 15 ethoxylated [15] in the methylene rocking region the 1143cm-1 line attributed to -C-O- stretch was more intense than the 1128cm-1 line attributed to –C-C-stretch and -CH2 wag. The presence of the 1082cm-1 peak showed that a significant amount of gauche isomers was present. The 1143cm-1 line was attributed to –C-O- stretch. The –C-O- stretching was coupled here with the adjacent –C-Cstretching vibration, thus as in primary alcohols, this vibration could better be described as an asymmetric (shorter wavelength, higher frequency), –C-C-O- stretching vibration. The 1128cm-1 line was attributed to –C-C- antisymmetric stretch and -CH2 wag [2]. The 1242cm-1 was attributed to CH2 twist. The band from 859cm-1 to 909cm-1 was attributed to –C-C- skeletal vibration, intense CH2 wagging mode frequencies. The 1130cm-1 was a polarized Raman band CH3(CH2)5. The 1063cm-1 band [2] was attributed to –C-Csymmetric stretching. The peak at 839cm-1 was attributed to ROSO 3 stretch [2]. The peak at 408cm-1 was attributed to SO3 rocking [2].
Figure 1: Raman spectra (intensity versus Raman shift) of the soluble matter ethanolic, of the first commercial textile detergent product, composed of sodium laureth sulphate 5%w/w, alcohols C13-15 ethoxylated 10%w/w, and sodium 2-ethylhexyl sulphate, 5%w/w, at 293K. Abscissa is Raman shift (cm-1) and ordinate is intensity. Τhe laser was operated at 490mW power and the exposure time was 3000ms, averages taken 1.

For the alcohols C13-15 ethoxylated in the high frequency spectrum of the C13 alcohol the splitting of the methylene bending mode near 1440cm-1 (i.e., 1446cm-1) has been attributed to a crystal field effect but the same splitting was associated before with both odd and even alcohols [2]. These assignments were based on previous comparative analysis of the spectra of a wide series of surfactants of different chain length and of different head groups and on the basis of earlier assignments made on Raman spectra for n-paraffin solids and liquids [2].
The pH of the second liquid detergent for all surfaces Flos (Figure 2) in the house, as it was, was measured 6.9 at 298K. The composition of the second detergent product was based on the safety data sheet: non-ionic, (alcohols C13, branched ethoxylated) 3%w/w, and anionic 1%w/w. For the alcohols C12-14 ethoxylated sulfated sodium salts the 1440cm-1 line was attributed to C-H scissoring. The peak at 1295cm-1 was attributed to methylene CH= twisting. The peaks at 1133cm-1 and 1060cm-1 are related to skeletal C-C stretching modes antisymmetric and symmetric respectively. The peak at 685cm-1 was attributed to P-C- stretching. Also, the peak at 652cm-1 was attributed to P-C- stretching [16]. For the peak at 1204cm-1 the P=O stretching was attributed. The P-CH2 peak was attributed at 1487cm-1 [16]. For the anionic surfactant the lines at 1060cm-1 and 1133cm-1 corresponded to intense –C-C- symmetric and anti-symmetric skeletal stretching modes. There was a rather sharp and intense methylene twists peak at 1295cm-1. The 1295cm-1 peak corresponded to CH2- twisting for saturated lipids. The 1440cm-1 peak corresponded to CH2 scissoring in lipids. The 1060cm-1 peak corresponded to –C-C- skeletal stretching saturated fatty acid. At 1750cm-1 there was an ester peak [17]. The 1606cm- 1 band was attributed to –C-C- aromatic ring stretching. The nonionic surfactant showed here a more intense band at 1606cm-1 as it had a shorter chain.
Figure 2: Raman spectra (intensity versus Raman shift) of the soluble matter ethanolic of the commercial liquid detergent for all surfaces in the house (Flos), composed of alcohols C12-14 ethoxylated sulphated sodium salts (<2.5 E.O.) 1%w/w, and poly(oxy-1,2 ethanediyl)alpha-tridecyl-omega-hydroxy-branched) 3%w/w, at 293K. Abscissa is Raman shift (cm-1) and ordinate is intensity. The laser was operated at 490mW power and the exposure time was 1500ms, averages taken 3.

The pH of the third liquid detergent for floors and surfaces (Figure 3) in the house, as it was, was measured 7.3 at 298K. The composition of the product was based on the safety data sheet: non-ionic agent 1%w/w (alcohols C12-15 ethoxylated), and anionic agent 1%w/w (benzene sulfonic acid C10-13-alkyl derivatives sodium salts). The peak at 1448cm-1 merged to two peaks at 1453cm-1 and 1467cm-1 on reduction of the ethylene oxide unit from 30 to 9. The intensity of the band at 1301cm- 1 due to δ(CH2)n deformations, changed as the fat contained more double bonds. The peak at 1296cm-1 and the band around 1450cm-1 arose from the methylene twisting and bending modes respectively. The peak at 888cm-1 and at 960cm-1 had their origin in the C-N stretching, ρ(CH3) rocking and ρ(CH2) rocking modes, respectively. The shorter chain surfactants, with reduction of the ethylene oxide unit, showed a more intense band at 1615cm-1. The presence of the aromatic group was confirmed by identifying a fingerprint band near 1600cm-1. The non-ionic surfactant showed a more intense band at 1615cm-1 since it had a short chain. Raman spectra of pure fatty acids and fats were collected before and could be distinguished from the other groups by typical bands at about 1300cm-1 and 1448cm-1 [18]. In the methylene rocking region, the 1143cm-1 line appeared as a shoulder of the 1130cm-1 line due to –C-C- antisymmetric stretching.
Figure 3: Raman spectra (intensity versus Raman shift) of the soluble matter ethanolic of the commercial liquid detergent for floors and surfaces (Ultra), composed of alcohols C12-15 ethoxylated 1%w/w, and benzene sulfonic acid C10-13 alkyl derivatives sodium salts 1%w/w, at 293K. Abscissa is Raman shift (cm-1) and ordinate is intensity. The laser was operated at 490mW power and the exposure time was 3000ms, averages taken 1.

The pH of the fourth detergent for marbles and tiles with green soap, Drolio, as it was, was measured 8.5 at 298K. The composition of the product was based on the safety data sheet, non-ionic agent 4%w/w, and soap sodium oleate 0.5%w/w. The Raman spectra (Figure 4) showed a band with a peak at 1300cm-1 attributed to in-phase methylene twisting deformation vibration of fatty acid sodium oleate [19]. The band from 1405cm-1 to 1455cm-1 was attributed to the –CH2, -CH3 of the moieties [18,19]. The peaks at 1730cm-1 and at 1270cm-1 were attributed to the unsaturated fatty acid, sodium oleate. The Raman spectra obtained from the detergent agreed with the presence of compounds in the safety data sheet as a mixture of alcohols, C12-15 ethoxylated (7 mol E.O. average molar ratio) and sodium oleate, suggesting that these two compounds were the main constituents of the detergent in the concentrations shown in the above Figure 4. The composition of the product was based on the safety data sheet: non-ionic (alcohols C12-15 ethoxylated) 4%w/w, and sodium oleate 0.5%w/w. The peak at 1372cm-1 was attributed to the carboxylic salt. The band from 1315cm-1 to 1435cm-1, i.e., 1372cm-1 was attributed to the carboxylate salt. The band from 1050cm-1 to 1150cm-1 (i.e., 1130cm- 1) was attributed to -C-C- antisymmetric stretching vibrations [18]. The band from 800cm-1 to 900cm-1, i.e., 860cm-1, was attributed to the -CH3-rocking. The band at 1060cm-1 was attributed to the –C-Cskeletal stretching of the fatty acid sodium oleate. Also, the peak at 1130cm-1 was attributed to the –C-C- skeletal stretching. The peak at 1300cm-1 was attributed to δ(CH2) twisting. The peak at 1442cm- 1 was attributed to CH2 scissoring of lipids. Sodium oleate was studied in 298K by using Fourier transform Raman spectroscopy. The bands in the –C-C- stretching region (1050cm-1-1150cm-1) i.e., 1060cm-1 and –CH3 rocking region (800cm-1-900cm-1) (i.e., 860cm- 1) have characterized its alkyl chains. The moderate Raman band at 1730cm-1 was attributed to stretching vibrations of conjugated –C=O of the carboxylate salt [17]. Also, the moderate Raman band at 1372cm-1, between 1315cm-1-1435cm-1 was attributed to the carboxylate salt. No ester peak appeared at 1750cm-1 indicating that the lipid present was in the form of free fatty acid.
Figure 4: Raman spectra (intensity versus Raman shift) of the soluble matter ethanolic of the fourth commercial liquid detergent for marbles and tiles with green soap (Drolio) composed of alcohols C12-15 ethoxylated (7mol E.O. average molar ratio) 4%w/w, and sodium oleate 0.5%w/w. Abscissa is Raman shift (cm-1) and ordinate is intensity. The laser was operated at 490mW power and the exposure time was 7000ms, averages taken 2.

Alcohols ethoxylated Raman spectrum changes with pH
In this study, it should be noted here that as the pH values of the four detergent sample products remained to the alkaline region the intensity of the Raman band attributed to –C-C- antisymmetric stretch raised, independently of the amount of the non-ionic surfactant present, i.e., alcohols C13-15 ethoxylated, or alcohols C13 branched ethoxylated, or C12-15 ethoxylated, and also shifted. Depending upon the pH of the solution, the surfactants of the four detergent products existed in different ionic forms. It was important to understand how these ionic forms influenced their spectroscopic response. More precisely the 1143cm-1 line was attributed to –C-Ostretch. The 1128cm-1 Raman peak for the alcohols ethoxylated in the first detergent product at pH 8.61 at 298K, corresponding to the –C-C- antisymmetric stretching mode Raman peak, shifted to 1133cm-1 as pH decreased from 8.61 to 6.91 at 298K (no coupling to the –C-O- stretching mode attributed at 1143cm-1) for the second detergent product, and lowered, and then shifted to 1130cm-1 as pH increased to 7.33, at 298K with high intensity, for the third detergent product, and shifted again at 1130cm-1 as the pH increased to 8.47 at 298K, with high intensity again, for the fourth detergent product, because then there was coupling of the –C-O- stretching vibration to the adjacent –C-C- stretching vibration. In the ethoxylated alcohols surfactant the –C-O- vibration when coupled to the adjacent –C-C- vibration, could better be described as an asymmetric –C-C-O- stretching vibration, meaning shorter wavelength, higher frequency. The 1133cm-1 Raman peak appearing in Figure 2, for the second detergent product, was shifted to longer wavelength, due to less coupling of the -C-C- stretching vibration to the –C-O- stretching vibration, compared to the peak at 1128cm-1 for the first detergent product, and to the peak 1130cm-1 for the third detergent product, where there was extensive coupling of the –C-C- stretching vibration to the –C-O- stretching vibration, and finally to the peak at 1130cm-1 for the fourth detergent product.
The observed changes in the Raman spectrum reflected the change in molecular structure, the ionic structure, as the pH varied between pH 8.61 to pH 6.91 and then to 7.33 and finally 8.47 [20]. The variation of the ionic form in alcohols ethoxylated with pH of their ethanolic solutions as well as of their aqueous solution, have influenced the electronic structure of the molecule, the ratio of its ionic forms, and thus its spectroscopic response. Their absorption spectrum depended directly on their ionic form. The higher intensity of the Raman peak for the alcohol ethoxylated of the detergent sample of pH 8.61, than that of pH 6.91, indicated that different structures were present.
Calculation of the ratios of the intensities of the anti- Stokes and Stokes lines for the -SO4 stretch at 1290cm- 1, in the Raman spectrum of the first detergent product
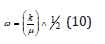
Laser radiation was produced at 1064nm. For the vibrational states, then the Boltzmann equation [21], at 293K could be written as
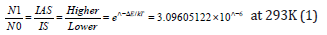
where No and N1 were the populations of the lower and higher energy states respectively, ΔE was the energy difference between the states, k was Boltzmann’s constant, and T was the temperature in K. For temperature of 20 ˚C (293K) we have calculated the ratios of the intensities of the anti-Stokes (IAS) and Stokes lines (IS) for the -SO4 stretch at 1290cm-1, in the first textile detergent product Dr. Beckmann.
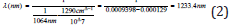
The stretch appeared at 1233.4nm according to the equation
For the vibrational states, the Boltzmann equation [21] at 313K could also be written as
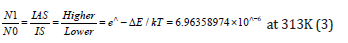
Thus, the ratio of (IAS) Anti-Stokes to (IS) Stokes intensities [22,23] increased with temperature, because a larger fraction of the molecules was in the first vibrationally excited state under these circumstances. Raman spectroscopy was derived from inelastic scattering of the laser radiation by matter. Raman shifted photons had either lower energy-it was the Stokes scattering-or higher energy than the elastic Rayleigh line, it was the anti-Stokes scattering. It should be noted that the intensity of Raman scattering with 1064nm excitation, varied as the fourth power of the frequency of the exciting source as

Calculation of the dissociation energy of the bond –C-CO- in the molecule of the surfactant alcohol ethoxylated C13-15, using the Birge-Sponer extrapolation, in order to assess its energetics namely, to calculate the energy to promote it from the ground state to an unbound state
The first five observed vibrational energy levels of the bond –C-C-O-in the molecule of the C13-15-ethoxylated alcohol were 1242cm-1, 1143cm-1, 1128cm-1, 1082cm-1, 859cm-1 respectively, from the Raman spectrum of Figure 1, for the first detergent product. The vibration of that bond could better be described as an asymmetric –C-C-O- stretching vibration. Then the observed vibrational energy level separations of the molecule of the ethoxylated alcohol lied at the following values for υ 1←0, 2←1, 3←2,…, respectively in cm-1: 15cm-1, 46cm-1, 99cm-1, 223cm-1. We then drew up the following Tables 1 and 2 as follows
Table 1: The first five vibration energy levels of the of the bond –C-C-O- of the molecule C13-15 alcohol ethoxylated were presented, and also the difference transition wavenumbers ΔGυ+1/2 separations.

Table 2: The difference transition wavenumbers ΔGυ+1/2 separations were presented and also the vibrational quantum numbers υ, υ+1…, were presented also.

Figure 5: The area under the plot of the difference transition wavenumber ΔGυ+1/2/(cm^-1) against the vibrational quantum number υ was equal to the dissociation energy of the bond –C-C-O- in the molecule of the ethoxylated alcohol. The assumption that the four difference transition wavenumbers approach zero linearly was the basis of the Birge-Sponer extrapolation.

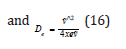
Hence xeṽ= 67.7cm∧-1/2 =33.85cm-1. Since ṽ-2xeṽ=197.3cm-1, it followed that ṽ=265cm-1 which was the vacuum wavenumber. Then the dissociation energy was obtained by assuming that the molecule was described by a Morse potential well and that the constant De in the expression for the potential was an adequate first approximation for it [24]. Then
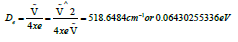
However, the depth of the potential well De differed from Do, the dissociation energy of the bond, by the zero-point energy, and it was then
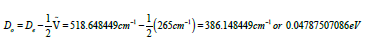
So, the dissociation energy of the bond was calculated to be Do=0.04787507086eV [24,25].
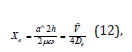
In general spectroscopy provides detailed information about the identities, the structures and the energy levels of a molecule. In this study we considered the vibrational energy levels of the molecule of the ethoxylated alcohol and we used the properties of the harmonic oscillator. We also took into account anharmonicities because the molecule was highly excited. We used its vibrational spectrum to obtain the dissociation energy of the bond –C-C-O-. The approach to the calculation of the energy levels in the presence of anharmonicity was to use the function that resembled the true potential energy, the Morse potential energy which was
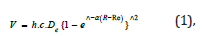
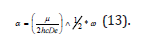
where De was the depth of the potential minimum, Re the bond length at the minimum of a potential energy curve of a diatomic molecule, and h was Planck’s constant, and c the speed of light. Then, α was
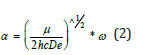
where μ was the effective mass of the atoms consisting of the bond, and ω was
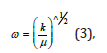
where k was the force constant of the bond.
For the Morse potential the permitted energy levels were
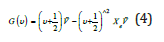

and xe was the anharmonicity constant, and ṽ the vacumm wavenumber. The number also of vibrational levels of the Morse oscillator was finite and υ=0,1,2,……,υmax, where υ was the vibrational quantum number, and υmax representing the point of bond dissociation.
In greater detail, because there were several vibrational transitions detectable, the graphical technique called Birge-Sponer extrapolation was used here to determine the dissociation energy Do of the bond –C-C-O-. The depth of the potential well De differed from Do by the zero-point energy:
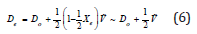
Τhe basis of the Birge-Sponer extrapolation was that the sum of successive energy separations ΔGυ+1/2 from the zero-point level to the dissociation limit was the dissociation energy Do,
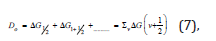
where G were the vibrational terms of the molecule, the energies of the vibrational states expressed in wavenumbers. So,
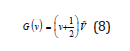

with
and υ=0,1,2,3…, where

where ν was the frequency of the radiation emitted or absorbed, and ṽ was the vacuum wavenumber, and υ the speed. When the source was emitting electromagnetic radiation of frequency ν then receded with a speed υ. Also, c was the speed of light, where h was Planck’s constant, μ was the effective mass of the two atoms consisting the bond of masses m1 and m2. The vibrational terms depended on the effective mass (μ) of the molecule, not directly on its total mass. Also, k was the force constant of the bond, and xe was called the anharmonicity constant, whereas
where De was the depth of the potential minimum and
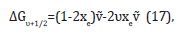
Τhe construction in Figure 5 showed that the area under the plot of ΔGυ+1/2 against υ was equal to the sum, and therefore to Do. The successive terms decreased linearly when only the xe anharmonicity constant was taken into account and the inaccessible part of the spectrum was estimated by this linear extrapolation. This actual plot differed from a linear plot, so the value of Do obtained in this way was an overestimate of the true value. The wavenumbers of the transitions with Δυ=±1 was
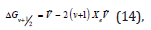
Where
Therefore since
Conclusion
We can conclude that the advantages of Raman spectroscopy in this study included the small sample requirement, the minimal sensitivity toward interference by traces of water present in the ethanolic solutions analyzed, the spectral detail acquired, and conformational sensitivity. The results in this work tried to improve our understanding of surfactants contained in common textile and house washing products, in relation to their solution pH. They were used to explain differences seen in their Raman spectra.
We presented Raman spectra of four different detergent products containing different groups of molecules. Most of these spectra could be easily distinguished from each other. The spectra of the first two detergent products showed similarities. The spectra of the third and the fourth detergent product showed almost no similarities but differed in intensity of the Raman peaks, from the first two spectra. The spectra of the anionic and non-ionic surfactants, in all four Raman spectra, could be recognized by three intense bands in the region from 1000cm-1 until 1200cm-1, and also bands at about 1296cm-1 and 1440cm-1. For the fats the most prominent bands were those at approximately 1295cm-1, 1440cm-1, and 1730cm-1-1750cm-1.
Using Raman spectroscopy and 1064nm excitation we showed that the alcohol ethoxylated –C-C- stretching mode peak, could be present at four Raman shifts, (i.e., 1128cm-1, 1133cm-1, 1130cm-1, 1130cm-1) corresponding to different ionization states of the nonionic surfactant, its different carbon chain, and also coupling of the –C-C- stretching mode to the –C-O- stretching mode present. We concluded that the ratio of anti-Stokes (IAS) to Stokes (Is) intensities could increase twice their value with a temperature increase of 20K in our Raman spectra recorded. Finally, we calculated the dissociation energy of the bond –C-C-O- in the molecule of the non-ionic surfactant, in the first detergent product, using the Birge- Sponer extrapolation with the intercept and slope of a linear plot.
References
- Gaubert A, Clement Y, Bonhomme A, Burger B, Jouan-Rimbaud BD, et al. (2016) Characterization of surfactant complex mixtures using Raman spectroscopy and signal extraction methods: Application to laundry detergent deformulation. Anal Chim Acta 915: 36-48.
- Kalyanasundaram K, Thomas JK (1976) On the conformational state of surfactants in the solid state and in micellar form. A laser-excited raman scattering study. J Phys Chem 80(13): 1462-1473.
- Clement Y, Gaubert A, Bonhomme A, Marote P, Mungroo A, et al. (2019) Raman spectroscopy combined with advanced chemometric methods: A new approach for detergent deformulation. Talanta 195: 441-446.
- Jones RN, Ripley RA (1964) The raman spectra of deuterated methyl laurates and related compounds. Canadian J Chem 42: 305-325.
- Tennyson J (2014) Vibration-rotation transition dipoles from first principles. J Molec Spectrosc 298: 1-6.
- Harris DC, Bertolucci MD (1989) Symmetry and Spectroscopy, an introduction to vibrational and electronic spectroscopy, Chapters 2 and 3, Dover Publications, Inc., New York, USA.
- Mansfield JC, Winlove CP (2017) Lipid distribution, composition and uptake in bovine articular cartilage studied using Raman micro-spectrometry and confocal microscopy. J Anat 231(1): 156-166.
- Moosavinejad SM, Madhoushi M, Vakili M, Rasouli D (2019) Evaluation of degradation in chemical compounds of wood in historical buildings using FT-IR and FT-Raman vibrational spectroscopy. Maderas Cienc Technol 21(3): 381-392.
- Blackburn JL, Engtrakul Chaiwat, McDonald TJ, Dillon AC, Heben MJ (2006) Effects of surfactant and boron doping on the BWF feature in the raman spectrum of single-wall carbon nanotube aqueous dispertions. J Phys Chem B 110(50): 25551-25558.
- Leyton P, Lizama-Vergara PA, Campos-Vallette MM, Becker MI, Clavijo E, et al. (2005) Surface enhanced raman spectrum of nanometric molecular systems. J Chil Chem Soc 50(4): 725-730.
- Le KC, Henriksson J, Bengtsson PE (2021) Polarization effects in raman spectroscopy of light-absorbing carbon. J Raman Spetrosc 52: 1115-1122.
- Sloan-Dennison S, Lampel A, Raßlenberg E, Ulijn RV, Smith E, et al. (2021) Elucidation of the structure of supramolecular polymorphs in peptide nanofibers using Raman spectroscopy. J Raman Spectrosc 52: 1108-1114.
- Bumbrah GS, Sharma RM (2016) Raman spectroscopy-basic principle, instrumentation and selected applications for the characterization of drugs of abuse. Egypt J Forensic Sci 6(3): 209-215.
- DeVeij M, Vandenabeele P, De Beer T, Remon JP, Moens L (2009) Reference database of raman spectra of pharmaceutical excipients. J Raman Spectrosc 40(3): 297-307.
- Soutzidou M, Glezakou VA, Viras K, Helliwell M, Masters AJ, et al. (2002) Low-frequency raman spectroscopy of n-alcohols. LAM vibration and crystal structure. J Phys Chem B 106: 4405-4411.
- Kulshreshtha AK, Dweltz NE (1981) Analysis of flame-retardant finishes on textiles using laser-raman spectroscopy. Indian J Text Research 6: 135-138.
- Adar F (2021) A simple introduction to raman spectral identification of organic materials. Spectrosc 36(11): 8-15.
- DeGelder J, DeGussem K, Vandenabeele P, Moens L (2007) Reference database of Raman spectra of biological molecules. J Raman Spectrosc 38: 1133-1147.
- Toma W, Guimaraes LL, Brito Alba RMS, Santos AR, Cortez FS, et al. (2014) Safflower oil: An integrated assessment of phytochemistry, antiulcerogenic activity, and rodent and environmental toxicity. Rev Bras Farmacogn 24(5): 538-544.
- Malyshev D, Öberg R, Landstrom L, Andersson PO, Dahlberg T, et al. (2022) pH induced changes in Raman, UV-Vis absorbance, and fluorescence spectra of dipicolinic acid (DPA). Spectrochim Acta A Mol Biomol 271: 120869.
- Hagiwara Y, Takahata K, Torimoto J, Yamamoto J (2018) CO2 Raman thermometer improvement: Comparing hot band and Stokes and anti-Stokes Raman scattering thermometers. J Raman Spectrosc, pp. 1-6.
- Kauffmann TH, Kokanyan N, Fontana MD (2019) Use of stokes and anti-stokes raman scattering for new applications. J Raman Spectrosc Wiley 50(3): 418-424.
- Venkateswarlu K (1941) Relative intensities of stokes and anti-stokes raman lines in crystals. Proc Indian Acad Sci (Math Sci.) 13: 64-67.
- Gaydon AG (2002) The determination of dissociation energies by the Birge-Sponer extrapolation. Proc Phys Soc 58(5): 525.
- Atkins PW (1995) Physical chemistry, (5th edn), Chapter 16, Oxford University Press, USA.
© 2021 Katerina Chryssou. This is an open access article distributed under the terms of the Creative Commons Attribution License , which permits unrestricted use, distribution, and build upon your work non-commercially.
Editor In Chief


.jpg)


Signup for Newsletter

Quick Links
 Editorial Board Registrations
 Submit your Article
 Refer a Friend
 Advertise With Us
Our Recent Edition

.jpg)


Top Editors


.jpg)


.bmp)
.jpg)
.png)
.jpg)


.jpg)


.png)

.png)


.png)


Financial Support

Sponsors

Latest e-Books

Latest Video

 a Creative Commons Attribution 4.0 International License. Based on a work at www.crimsonpublishers.com.
Best viewed in
a Creative Commons Attribution 4.0 International License. Based on a work at www.crimsonpublishers.com.
Best viewed in