- Submissions

Full Text
Annals of Chemical Science Research
A Study of the Optical Bandgap Energy and Urbach Energy Tail of Two White A4 Copy Paper Samples
Katerina Chryssou*, Maria Stassinopoulou and Eugenia Lampi
General Chemical State Laboratory, B’ Chemical Division of Athens, Greece
*Corresponding author: Katerina Chryssou, General Chemical State Laboratory, B’ Chemical Division of Athens, Department A’ Tsocha 16, Greece
Submission: November 13, 2021;Published: December 02, 2021

Volume2 Issue5November, 2021
Abstract
Two white Α4 copy paper samples Q-Connect and Laser Copy were tested for the fiber component of their pulps using the optical microscope and were determined as chemical pulps. UV-VIS data revealed the values of Urbach energies of 498.2meV and 498.1meV of the two copy paper samples respectively, when the thickness of both samples was d=1mm. The value of indirect bandgap energy was calculated to be 1.16984469010026eV for Q-Connect copy paper sample, and 1.1698449010027eV respectively, with the Laser Copy paper sample. The Urbach energy of the A4 copy paper sample Q-Connect was calculated to be 333.7meV when its thickness was d=0.101mm whereas the Urbach energy of the A4 copy paper sample Laser Copy was calculated to be 330.2meV when its thickness was d=0.094mm. A decrease in Urbach energy with a decrease in thickness from 101μm to 94μm, and an increase in energy band gap, were observed for the two copy paper samples, respectively.
Keywords: Cellulose; White A4 copy paper sample; Optical bandgap; Absorption spectra; Kubelka-Munk K/S value; Urbach energy (Eu); Band gap energy (Eg); Thickness
Introduction
Paper samples are interesting materials for applications in optoelectronics. Many
workers have investigated the optical properties of other materials, stones, thin films, doped
thin films, coated glass substrates, and have studied the relation between bandgap energy
Eg and thickness and the tailing in the band gap (Eu) [1,2]. The optical properties are useful
in studying the electronic band structure, absorption characteristics, and the disorder
present in the materials. Urbach has proposed an empirical rule for the optical absorption
coefficient α(ω) associated with electronic transition from the valence to the conduction band
tail in disordered solids [3]. The relations are examined between Eg (band gap energy) and
thickness and the tailing in the Eg [4]. The increase of band gap energy Eg with film thickness
is attributed to the improvement of the crystallinity of the material studied when it becomes
thicker [5].
In this work a fiber furnish analysis is carried out under the optical microscope and it
is used to determine the fiber component of the pulps of two white A4 copy paper samples
quantitatively which were found to be chemical pulps. Then, reflectance measurements are
carried out over the spectral range 400-700nm and are processed to extract the spectroscopic
and band gap properties of the two white A4 copy paper samples [1,2]. In the present work
the thickness dependence of the band gap Eg and Urbach energy tail (Eu) for the two A4 copy
paper samples is reported.
Experimental
The microscope, a projection optical microscope SDL S.N. 232431, 220V, 60W, S1, was used with a round screen and no binoculars, and with a magnification of x10/0.2 to x20/0.4. Optical properties of the two A4 copy papers were investigated using a UV-Vis spectrophotometer, a CM-3630, BCMTS M Type 40605, S.N. 43029, Touch Screen-M V2.0 Frank-PTI spectrophotometer equipped with an integrating sphere, at room temperature (293K-298K). Important optical parameters like Eg and Eu were calculated by analyzing the reflectance spectra obtained at normal incidence geometry and diffused reflectance spectra were collected for both the samples in the wavelength range of 400-700nm [6]. The thickness of the two copy paper samples was measured using a digital precision micrometer TMI (Testing Machines INC) Model No 49-61-01-0002, S.N. 33421-01 with range 0-1.270mm. The thickness of the two A4 paper samples was measured in the range 100±10μm and with ±5.5μm uncertainty. As we set the thickness of the paper samples with more significant digits, during the course of this work, we could calculate the Urbach energy more accurately, and we could separate the Urbach energies of the two A4 copy paper samples better.
Results and Discussion
The K/S ratio of the first A4 copy paper sample, Q-Connect, was found to be K/S=46.63024934 and the reflectance ISO brightness used was measured to be 95.25% whereas those for Laser copy were 46.67024494 and 95.33% respectively. The ISO brightness measured was the numerical value of the reflectance of the two A4 copy paper samples at 457nm, blue light reflectance. The value of absorption coefficient at a particular wavelength [7] was the ratio of absorption to sample thickness and was represented as α,

where α was the absorption coefficient, A was the absorption and d was the thickness of the sample, here d=1mm.
For the calculation of Urbach energy (Eu) the following equation [8] was used,

where α was the absorption coefficient, αο was a constant, and hν was the photon energy. The slope of the logarithm [9,10] of ln(α) versus hν plot in the lower photon energy region was used for the calculation of Eu (Urbach energy) of the two copy paper samples.
For the calculation of direct and indirect band gap energies the following equation applied,

where Eg was the band gap energy and was direct or indirect depending on the value of x. Also, α was proportional to the Kubelka-Munk function F(R) given as follows,

where (F(R)) was the Kubelka-Munk function, R was the
reflectance, K was the absorption, and S was the scattering from the
samples, and was used for the calculation of Urbach energy and the
band gap energy.
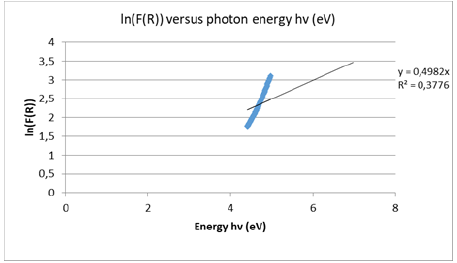
The slope of the ln(α) versus hv plot in the lower photon energy
region was used for the calculation of Eu (Urbach energy) of each
A4 copy paper sample [11]. The Urbach energy for copy paper
Q-Connect was calculated by the slope of the best fit line through
the vertical segment of the plot of Figure 1. The slope was calculated
to be 2.340036622eV and the Urbach energy of 498.2meV for
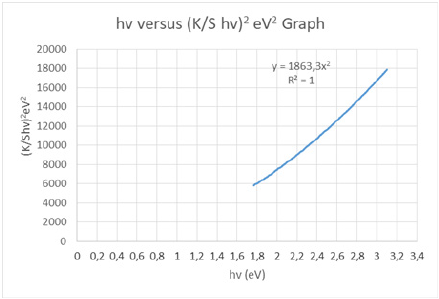
copy paper sample Q-Connect. UV-V is data revealed the value of
Urbach energy of 498.2meV and the value of indirect bandgap
energy of 1.16984469010026eV (Figure 2) for copy paper sample
Q-Connect. Also, the value of Urbach energy was estimated to be
498.1meV (Figure 3) and the value of indirect bandgap energy of
1.1698449010027eV (Figure 4) for copy paper sample Laser Copy
[12]. The thickness of both samples was taken as d=1mm.
Figure 1: Plot of ln(F(R)) versus photon energy hv for the calculation of Urbach energy of the first copy paper sample
Q-Connect where  where K was the absorption or coefficient of reflectivity and S was the coefficient of
light scattering, and R was the observed reflectivity for monochromatic light.

Figure 2: (K/S hv)2 versus hv graph of the cellulosic chromophores i.e., C=O group and double bonds, in the first copy paper sample, Q-Connect consisting of 100% cellulose, for the calculation of band gap energy for permitted indirect transitions n=2.

Figure 3: Plot of ln(F(R)) versus photon energy hv for the calculation of Urbach energy of the second A4 copy paper sample Laser Copy.

Figure 4: (K/S hv )2 versus hv graph of the cellulosic chromophores i.e., C=O group and double bonds, in the second copy paper sample, Laser copy consisting of 100% cellulose, for the calculation of band gap energy for permitted indirect transitions n=2.

The structural disorder due to the presence of impurities in the
chemical pulp of the two copy paper samples, at room temperature,
was attributed to the low values of Urbach energies and high values
in band gaps [13]. The thickness of the two paper samples was also
measured as per ISO 534 [14]. The thickness of the Q-Connect A4
paper sample was measured to be 101μm and that of Laser Copy
A4 paper sample 94μm. Thus, a decrease in Urbach energy with
decrease in thickness and an increase in energy band gap with
a decrease in thickness was observed for the two A4 copy paper
samples at room temperature [13]. The Urbach energy varied
inversely to the band gap [15,16].
The slope of the ln(α) versus hv plot in the lower photon energy
region was used again for the calculation of Eu (Urbach energy)
of each A4 copy paper sample when the thickness of the sample
was now d=0.1mm. The Urbach energy for copy paper Q-Connect
was calculated by the slope of the best fit line through the vertical
segment of the plot of Figure 5. The slope was calculated to be
2.340036622eV and the Urbach energy of 333.2meV for both A4
copy paper sample Q-Connect, and A4 copy paper sample Laser
Copy.
Figure 5: Plot of ln(F(R)) versus photon energy hv for the calculation of Urbach energy of the first A4 copy paper
sample Q-Connect where  where K was the absorption or coefficient of reflectivity and S was the
coefficient of light scattering, and R was the observed reflectivity for monochromatic light, when the thickness of the
sample was d=0.1mm.

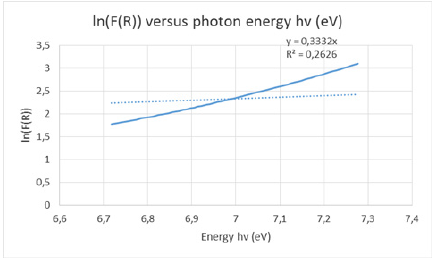
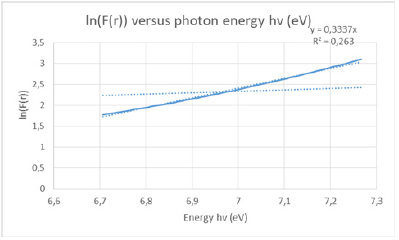
Also, the slope of the ln(α) versus hv plot in the lower photon energy region was used again for the calculation of Eu (Urbach energy) of A4 copy paper sample Q-Connect when the thickness of the sample was d=0.101mm and, also of the A4 copy paper sample Laser Copy when its thickness was d=0.094mm. The Urbach energy for copy paper Q-Connect was calculated by the slope of the best fit line through the vertical segment of the plot of Figure 6 and also for the copy paper Laser Copy through the vertical segment of the plot of Figure 7 (Table 1). The slope was calculated to be 2.340036622eV and the Urbach energy of 333.7meV for A4 copy paper sample Q-Connect. Also, the slope was calculated to be 2.340036622eV and the Urbach energy of 330.2meV for A4 copy paper sample Laser Copy as listed in Table 1.
Figure 6: Plot of ln(F(R)) versus photon energy hv for the calculation of Urbach energy of the first A4 copy paper
sample Q-Connect where  where K was the absorption or coefficient of reflectivity and S was the
coefficient of light scattering, and R was the observed reflectivity for monochromatic light, when the thickness of the
sample was d=0.101mm.

Figure 7: Plot of ln(F(R)) versus photon energy hv for the calculation of Urbach energy of the second A4 copy paper
sample Laser Copy where  where K was the absorption or coefficient of reflectivity and S was the
coefficient of light scattering, and R was the observed reflectivity for monochromatic light, when the thickness of the
sample was d=0.094mm.

Table 1: Urbach energies (meV) and thicknesses (mm) of the two A4 copy paper samples.

Conclusion
In this work UV-VIS spectroscopy was performed to calculate the Urbach energies and indirect band gap energies of two A4 white copy paper samples. The indirect band gap energy involved interaction of photon with an electron in the valence band which subsequently got excited into the conduction band, across the fundamental band gap. In the case of the indirect transition, interaction with lattice vibration also took place. Thus, the appearance of optical band gap in thin A4 copy paper samples was affected by the microstructure, like the presence of defects. Urbach energy tailing was estimated into the band gap in each paper sample. Urbach energy tail (Eu) has been estimated to account for the optical disorder of the two paper samples [17,18]. The width of Urbach tail decreased on going from the thicker to the thinner copy paper sample which meant that from order to disorder. Thus, the present work contributes to understanding that the energy tails can be optimized to engineer the optical band gap for various applications in the field of thin film devices, and therefore of thin copy paper samples.
References
- Imtiaz Ahmad, Suhail HS, Ali Rizwan, Malik Sajjad M (2021) Spectroscopic analysis for harnessing the quality and potential of gemstones for small and medium-sizes enterprises (SMEs). J Spectrosc, pp. 1-12.
- Dhanaraj A, Das K, Keller JM (2020) A study of the optical band gap energy and Urbach energy of fullerene (C60) doped PMMA nanocomposites. AIP Conf Proc.
- Chavez M, Juarez H, Pacio M, Mathew X, Gutierrez R, et al. (2016) Optical band gap energy and Urbach tail of CdS: Pb2+ thin films. Rev Mex De Fis 62: 124-128.
- Hassan AS, Aboode MA, Shallal IH (2020) Heterojunction solar cell (NiPcTs/CdS) Organic/Inorganic. IOP Conf Ser: Mater Sci Eng 757: 1-16.
- Ben Rabeh M, Khedmi N, Fodha MA, Kanzari M (2014) The effect of thickness on optical band gap and n-type conductivity of CuInS2 thin films annealed in air atmosphere. Energy Procedia 44: 52-60.
- Neha Sharma, Prabakar K, Ilango S, Dash S, Tyagi AK (2017) Optical band-gap and associated Urbach energy tails in defected AIN thin films grown by ion beam sputter deposition: Effect of assisted ion energy. Advanced Materials Proceedings 2(5): 342-346.
- Louis P, Subha S (1981) An optical classification of coastal and oceanic waters based on the specific spectral absorption curves of phytoplankton pigments, dissolved organic matter, and other particulate materials. Limnol Oceanogr 26(4): 671-689.
- Rahman MM, Miran HA, Zhong-Tao J, Altarawneh M, Lee Siang C, et al. (2017) Investigation of the post-annealing electromagnetic response of Cu-Co oxide coatings via optical measurement and computational modeling. RSC Adv 7(27): 16826-16835.
- Omkar VR, Anil Kumar, Aanchal Sati, Pankaj RS (2021) Exploring the Interrelation between Urbach Energy and Dielectric Constant in Hf-Substituted BaTiO3. ACS Omega pp. A-H.
- Bakry AM (2008) Influence of film thickness on optical properties of hydrogenated amorphous silicon thin films. Egypt J Solids 31(1): 11-22.
- Neha Sharma, Shilpam Sharma, Prabakar K, Amirthapandian S, Ilango S, et al. (2016) Optical band gap and associated band-tails in nanocrystalline AIN thin films grown by reactive IBSD at different substrate temperatures. arXiv: 1507.04867v2, pp. 1-22.
- Patrycja M, Michal P, Wojciech M (2018) How to correctly determine the band gap energy of modified semiconductor photocatalysts based on UV-Vis spectra. J Phys Chem Lett 9(23): 6814-6817.
- Shadia Jamil I, Ahmad-Bitar RN (2013) A study of the optical bandgap energy and Urbach tail of spray-deposited CdS: In thin films. J Mater Res Technol 2(3): 221-227.
- ISO 534 (2011) Paper and board-Determination of thickness, density, and specific volume, pp. 1-13.
- Anyaegbunam FNC, Augustine C (2018) A study of optical band gap and associated Urbach energy tail of chemically deposited metal oxides binary thin films. Dig J Nanomater Bios 13(3): 847-856.
- Belahssen O, Temam HB, Benramache S (2015) A study the calculation of the optical gap energy and Urbach energy in the semiconductor doping. Int J Renew Energy Res 5(1): 177-182.
- Halimah MK, Daud WM, Sidek HAA, Zaidan AW, Zainal AS (2010) Optical properties of ternary tellurite glasses. Mater Sci Poland 28(1): 173-180.
- Shportko KV (2019) Disorder and compositional dependences in Urbach-Martienssen tails in amorphous (GeTe)x (Sb2Te3)1-x alloys. Nature 9: 6030.
© 2021 Katerina Chryssou. This is an open access article distributed under the terms of the Creative Commons Attribution License , which permits unrestricted use, distribution, and build upon your work non-commercially.
 a Creative Commons Attribution 4.0 International License. Based on a work at www.crimsonpublishers.com.
Best viewed in


.jpg)


 Editorial Board Registrations
 Submit your Article
 Refer a Friend
 Advertise With Us
.jpg)


.jpg)


.bmp)
.jpg)
.png)
.jpg)


.jpg)


.png)

.png)


.png)


