- Submissions

Full Text
Annals of Chemical Science Research
Electronic Waste; A Potential Pollution Source in Ground Water Near Dumpsite in Karachi Pakistan
Abdul Rafeeq1*, Syed Azhar Ali2 and Asad Khan Tanoli2
1Department of Chemistry, University of Karachi, Pakistan and Peoples Steel Mills Ltd, Pakistan
2Department of Chemistry, University of Karachi, Pakistan
*Corresponding author: Abdul Rafeeq, Department of Chemistry, University of Karachi, 75270, Karachi, Pakistan and Peoples Steel Mills Ltd, Pakistan
Submission: July 06, 2021;Published: September 24, 2021

Volume2 Issue4September, 2021
Abstract
The effect of e-waste activities on tap and ground water quality was evaluated. Sampling was carried out during dry season (May to June). Four distance points and three depths were selected to represent the ground water. The metal toxicity was the focus area and only the main metallic constitute in electronic waste (e-waste), which could be possible to be the part of e-waste were selected to determine like, Cd, Cr, Cu, Fe, Ni, Pb and Zn. Analysis was carried out using standard ASTM (D1971) digestion and analysis protocol on Atomic Absorption Spectrometer (AAS). The estimated data were compared with the levels allowed by the National and International standards i.e. Pakistan environmental protection agency (Pak- EPA), EC50 and WHO (world health organization) guidelines. The maximum elemental concentration were remained as Cd 0.006, Cr 0.009, Cu 0.098, Fe 0.065, Ni 0.032, Pb 0.151 and Zn 0.091mg/l for 50meter distance from the dumpsite in the ground water. Pb and Ni are found higher than the WHO & Pak-EPA recommendations while Cd is higher than WHO but within the Pak-EPA acceptable limit. It is clear that the presence of these metals in the media will cause serious health problems to the residence of the area and as well as to the city. It is concluded that the dumping of electronic waste (e-waste) is the major source of contamination of heavy metals in the studied media of the city. It emphasizes that the e-waste must be recycled properly to prevent the media from being polluted.
Keywords: e-waste; Toxicity; Pak-EPA; EC50; ASTM-D1971
Introduction
About 200 billion m3 useable fresh water is available in Pakistan for drinking, household and industrial purpose [1]. 75% of this water (i.e. 150 billion m3) is utilized. Most of this used in irrigation and the industry as Pakistan based on cotton and leather industry which needs plenty of water for the product treatment. Since the Karachi is the most populated city of the country therefore, it required 820 to 1200 MGD (million gallons per day) from the main stream but it receives 665 MGD approximately which is not quite enough for the city population (about 20-25 million) [2]. This short fall more surprises when the water management was not anxious to resolve the drainage of fresh water, therefore most of the city residential area is dependent on the ground water which is mostly salty as the city is a seaport too [3]. The stream pollution comes from the different discharge of waste into the water similarly the ground water pollution becomes due to the unwanted waste activities on to the ground for a long period of time [4]. As a fact this is known that the ground water is polluted because of incineration or leaching of the unwanted toxicants from surface to depths [5].
E-waste is nothing except the waste from electrical and electronics equipments/appliances used in homes, offices and industries. These items very frequently replaced in developed countries, as the newer and advanced version launched in market [6]. Existing versions are constantly being relegated to the back and subsequently being replaced and mostly disposed, whereas industries replacing only the part of equipments with spare parts which must be 100 or more times higher in quantity [7,8]. The composition of e-waste is differs across different categories. Although e-waste contains a charm for valuable recyclable component such as Au, Pt, & Ag, however potentially toxicants are also the part of e-waste in such amount, which could not be negligible particularly when the waste were managed improperly [9,10]. The global quantity of e-waste is growing with an annual growth rate of 4-5%. it is estimated that 20-50 million tons of e-waste is generated per year, Pakistan also producing 11.7kg per capita per year, whereas only 20- 30% was recycling and remaining goes directly into landfills and incinerators. Most of e-waste generated in developed countries and from where 75-80% is shipped to developing countries in Asia and Africa for recycling and disposal [11-15]. Worker performs e-waste recycling in these countries without any environmental or worker health precautions [15]. The process of dismantling and disposing of e-waste may caused the environmental impact as the release of hazardous substances contaminated the soil and ground water as well as air [14-18]. This affects the land, sea animals, crops and human beings [18]. This is because the developing countries facing the health challenging issues by pollutions. Surface soil, depth soil and ground water are the main source that can provide information about the level of incineration and contamination [19,20].
The composition of soil and water can be indirectly an indicator of pollutants such as heavy metal contamination in the atmosphere [21]. Pakistan, where environmental laws exist but not implemented efficiently [22]. Therefore for the pollutions of environment the e-waste is must be a reason that causing the damage to the people and their immediate environment [23]. All electronic items contains heavy metals like cadmium, lithium and lead found in batteries and cathode ray tubes. An environmental report stated that about 75% of heavy metals founds in landfills comes from e-waste [7,24]. People working on recycling and dumping sites can expose to heavy metals through inhalation, ingestion and skin absorption and the exposure can results in acute and chronic toxicity [25,11]. Most heavy metals has no biological role and negatively affects human in significant ways. Like the lead level in dust have been significantly associated with lead levels in children blood and Blood Lead Levels (BLL) greater than an international level of 10 micro gram per deciliter has been associated with a decrease in IQ [15,26-28]. The verse affect of heavy metals is that when organic waste breaking down the heavy metals remain unaffected and their incineration occurs timely. These heavy metals come back in contact through leached into the ground water, after a certain concentration limit they impose toxic effects on living organism [29-31]. Today, mobile and other smart communication devices usage has grown exponentially in Pakistan both in terms of number of users and the amount of activity. Pakistan had crossed the number of 50 millions subscribers in the fiscal years 2020, the government has extended support to mobile handsets imports while reducing the custom duty. In only 2008-09, the cellular mobile companies in Pakistan added over 6.3 million subscribers [32].
Materials and Methods
Location of study
The geographical coordinate of the Karachi city is 24o51’36»N and 67o00’36»E. Altitude 8-meter AMSL, Density 3394 persons/ km2, Elevation 8-meter (26ft). The city is along the coast of Arabian Sea. Therefore, the city serves as an industrial hub and international sea transportation point. The city is spread over an area around 3527km2. The average rainfall of the city is around 7 inches/annum. However, the monsoon season in July-August; experiences bulk precipitation. May and June are the hottest months in the country and as well in the city; the temperature rises often 45 °C, indicating the summer is scorching. The temperature in the winter’s season drops up to 5 °C during December and January. The city is also graded as a beta world city. Karachi is the 7th largest agglomeration in the world and the largest city in the Muslim world. The two rivers namely the Malir River and the Lyari River flow through the city both are the biggest dumping zones of Karachi, second one is our study area [13,22,33].
Water sampling
The analysis of heavy metals was determined in the samples of groundwater collected from the residential area in 2015, to determine the leaching effect of underground water. Furthermore, the drinking water (tap water) is supplied through pipes for the inhabitants. The residential area is present along both sides of the dumped site. A large number of people are living in the Shershah area of the city. The analysis of heavy metals in water samples of both sides of the dumpsite was done. The samples were collected from tap water designated as (WT) and the groundwater present in the well or bore designated as (WB). Furthermore, the scanty volume of water is provided to the area by the municipality for drinking and domestic use. The inhabitants are compelled to use bore water to continue their lives in the populated city. The area distance for water sampling was kept about 50 meters and 100 meters far from the dumpsites. The depths of the well were selected as nearly100ft,120ft and 150ft for the collection of water samples for heavy metal analysis. The three replicate samples were collected after allowing 100 litre water to collect in other containers through motors. The samples were mixed and the composite sample was taken to behave as the representative sample for well water. The composite samples collected from the east side of the dumpsite designated as EBW (100), EBW (120), EBW (150) and from the west side as WBW (100), WBW (120), and WBW (150). The samples were collected in the plastic containers previously washed with nonionic detergent. The containers were washed with the tape water and soaked in 10% HNO3 for 24 hours. Finally, the containers were rinsed with the deionized water. They were stored in the refrigerator at 4 °C to save the samples from contamination and evaporation. The stored samples were marked and labelled for further analysis [9,34].
Results and Discussion
The concentration for the heavy (toxic) metals such as Cd, Cr, Cu, Fe, Ni, Pb and Zn were analyzed in water samples that were collected from the either side of e-waste dumpsite in shershah market Karachi. 50 meter and 100 meter distance with three different depths 100ft, 120ft and 150ft were the focused point of sampling to check the distance and depth affected by heavy metal dumping contamination. Table 1 represents 50 meter east side water sample concentration in mg/L. the Cd concentration were 0.004mg/L for 100 and 120ft depths (Figure 1). For 100 meter east side Cd was not detected, whereas for 50 meter west side Cd was 0.006mg/L (Table 2) for 100 ft bore water, similarly on 100 meter distance Cd was remain 0.003mg/L (Table 3,4). Cd was not detected in tap water supplied by Municipal Corporation. Chromium in 50 & 100 meter east side were 0.005 & 0.004 for 100, 120 & 150ft (Table 1 & 3). The 50 meter west sides were found more concentrations for Cr as 0.009, 0.006 & 0.004mg/l for the depth of 100, 120 & 150ft (Table 3). Similarly it was 0.002mg/l for 100ft 0.001mg/l for 120ft and not detected for 150ft (Figure 2,3).
Figure 1: Heavy metal concentrations (mg/l) in tap and ground water from e-waste dumpsite 50-meter east (Akortia et al. 2017).
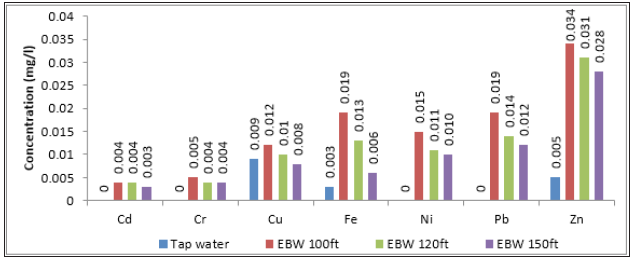
Figure 2:Heavy metal concentrations in Tap and Ground water samples for 100-meter east (Mohod et al.,2013).
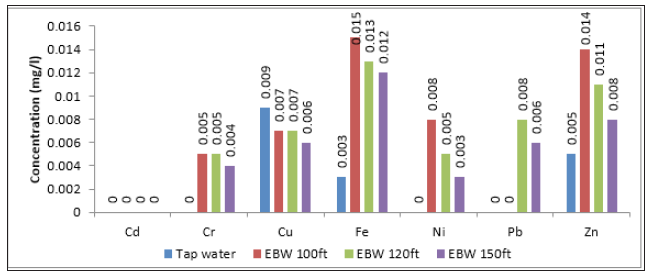
Figure 3:Total elemental concentrations (mg/L) in tap and groundwater from (recycling side) dumpsite 50 meter west.(Demir et al., 2015).
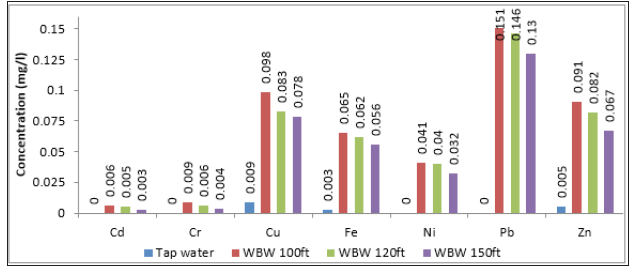
Table 1: Heavy metal concentrations (mg/l) in tap and ground water from e-waste dumpsite 50-meter east.

Table 2:Heavy metal (mg/l) in tap and groundwater from (recycling side) dumpsite 50 meter west.

Table 3:Tap and ground water heavy metal concentrations (mg/l) from the 100-meter east side.

Table 4:Concentrations (mg/l) in tap and groundwater from (recycling side) dumpsite 100 meter west

Tap and ground water both were showing the presence of Cu. In 50 meter east Cu was 0.012 to 0.008mg/l (Table 1). The maximum Cu was detected in 100ft and minimum in 150ft. while for tap water Cu was 0.009mg/l. Cu is zinc balancing metal and essentially required for human body in limited extent. In 100 meter east side water analysis Cu was detected as low as 0.009 to 0.006mg/l (Table 3). West side 50 meter distance water sample results presented in Table 2, indicating Cu concentration as 0.098, 0.083, 0.078 & 0.009mg/l for 100, 120 ,150ft & tap water. The concentration order found as 100ft > 120 > 150 > tap water. Similarly for 100 meter west side Cu was 0.032 to 0.019mg/l. the minimum in 100ft and maximum in 150ft. tap water supplied for both side and distance from the same source. Tap and bore water iron concentrations were remain from 0.065, 0.062 and 0.056mg/l in recycling side 50 meter west for 100, 120 & 150ft depths (Table 2). For 100 meter west sides it was 0.025, 0.019 & 0.016mg/l (Table 4) respectively (Figure 4). Similarly for 50 meter east Fe were 0.019, 0.013, 0.006mg/l (Table 1) and for 100 meter east it was 0.015, 0.013 0.006 mg/l (Table 3) for the depths of 100, 120 & 150ft relatively. Nickel concentration were found 0.041, 0.040 & 0.032 mg/l for 50 meter west in 100, 120 &150ft (Table 2), 0.022, 0.016 & 0.011mg/l for 100 meter west (Table 4), 0.015, 0.011 & 0.010 mg/l for 50 meter east (Table 1) and 0.008, 0.005 & 0.003mg/l for 100 meter east relatively. The maximum nickel was detected 0.041mg/l for 50 meter west side and minimum Ni 0.003mg/l for 100 meter east. All high nickel values were for 100 ft depth while the lower one for 150ft. Ni is also a carcinogenic metal.
Figure 4:Concentrations (mg/L) in tap and groundwater from (recycling side) dumpsite 100 meter west.
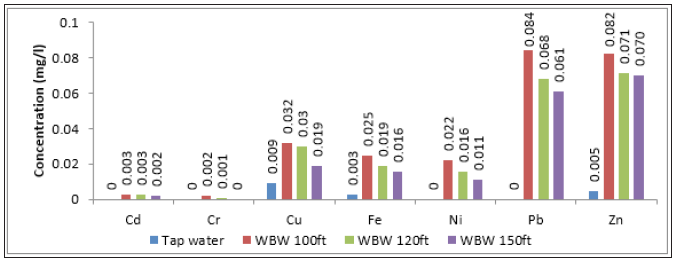
The most toxic metal in water is Pb this harms the bone and brain equally and causes to lower the human IQ level, immediately effective for children’s [9,35,36]. Pb concentrations were 0.019, 0.014 & 0.012mg/l (Table 1) for 100, 120 & 150ft bore water taken from 50 meter east. 100 meter east side water Pb was very low as 0.008 & 0.006mg/l for the depth of 120ft and 150ft (Table 3). Lead concentrations for 50 meter west sides were 0.151, 0.146 & 0.13mg/l for 100, 120 & 150ft. this was the highest lead toxicity found in water samples. The level of lead toxicity was 100ft > 120ft > 150. 100 meter west side water also containing the lead contamination as 0.084mg/l for 100ft, 0.068mg/l for 120ft and 0.061mg/l for 150ft (Table 4). The west side is also the recycling side of the e- waste. The most essential heavy metal after iron is zinc [9]. It was also detected in bore and tap water. 50 meter east side Zn was 0.034mg/l to 0.028mg/l for 100, 120 and 150ft, while for tap water zinc was only 0.005mg/l (Table 1). 100 meter east side Zn was detected more low as 100ft > 120ft > 150ft (Table 3). The west side Zn was presented in Table 2 as 0.091, 0.082 & 0.067mg/l for 100ft, 120ft and 150ft depths. Similarly it was 0.082mg/l for 100ft, 0.071mg/l for 120ft and 0070mg/l for 150ft (Table 4). Zinc is not of health concern at levels found in drinking-water it may affect acceptability of drinking water [37]. The pH for tap water was 7.05 and for bore water it was 7.70 to 7.96 indicating the presence of lighter and heavy metals in bore or ground water. Tap water pH was showing the suitability for safe drinking and other house hold usage.
Table 5 & 6 were presented for the highest heavy metals concentrations in tap and ground water at 50 & 100 meter distance from the dumpsite in Karachi, Pakistan & Lagos state Nigeria with EC50, Pak-EPA and WHO recommended values in mg/l [38-41]. Comparison indicating the too much safer water than Nigeria is present in Pakistan soil or ground. The comparison with the WHO and Pak-EPA recommended values representing the actual status as Cd is higher than the WHO value 0.003mg/l but lower than the Pak- EPA recommendation 0.01mg/l [42,37]. Cr, Cu and Zn were within the control limit for both WHO and Pak-EPA limits. Ni is at safe level for WHO value but higher than the Pak-EPA acceptable value for safe drinking water. Pb concentration 0.151mg/l is much higher than the WHO & Pak-EPA values 0.01 and <0.05mg/l respectively. All heavy metal concentrations in water were lower than the EC50 values [38]. It may be due to the dumpsite at the edge of river close to sea and most of incineration into the ground not occurs as it was in Nigeria [13,43,44].
Table 5:Maximum concentrations (mg/l) in tap and ground water 50 meter from dumpsite.

(Nigeria)*= Lagos state Nigeria, EC50 – Effective concentration of a substance in water that will cause irreversible damage in one half of a population; NR*; not reported; ND; not detected, NA; not available
Table 6: Maximum heavy metal concentrations (mg/l) in tap and ground Water 100 meter from dumpsite.

Direct intake from water rather than soil exposure is very toxic for the human health. High lead concentration in drinking water may results in metallic poisoning that manifests in symptoms such as tiredness, lassitude, slight abdominal discomfort, irritations and anemia [4,45,46]. Zn excessive level in drinking water can cause problem of bitter, astringent taste and opalescent appearance. Ni causes skin damage and asthma. Over a long period use of Cr containing water, although the concentration is very small, becomes a cause of high blood pressure and kidney and DNA damage, and has been linked to asthma and bronchitis. Cu at certain level is required to the human bodies even infants takes the copper from mother milk. Deficiencies in Cu may stops many enzymatic and catalytic reaction in living bodies. The nature has arranged system to fulfill the requirement of all metal from the natural source. Any irrelevant source of supply of these metals, without any monitoring, must exceeds the optimum condition level which is basically come under the definition of toxicity [6,47-51].
Conclusion
The analysis of heavy metals were carried out in various samples collected from the e-waste dumpsite around area of the Shershah market in Karachi. The maximum concentration was found as Cd 0.006mg/l, Cr 0.009 mg/l, Cu 0.098mg/l, Fe 0.065, Ni 0.032mg/l, Pb 0.151mg/l and Zn 0091mg/l, for 50 meter west distance from the dumpsite in bore or well or ground water. As compared to EC50 (Table 5) values these concentrations are very low but very high than detected in tap water. The 100 meter distance well water higher detected values were 0.082, 0.084 0.010, 0.002 and 0.032mg/l for Zn, Pb, Ni, Cr & Cu. Ni & Pb are crossing the WHO acceptable limits while Cr, Cu & Zn falling within the permissible limits for both WHO & Pak-EPA. Cd is also up to standard for Pak-EPA but, less than WHO limit. All determined heavy metals are less than 0.1mg/l, only the lead is showing 0.151mg/l which is higher than the acceptable limit. These heavy metals most probably are coming in water from the leaching of metals on dumpsite in the soil and after many years when excess amount leached inside the ground water these heavy metals comes in contact of human from the bore water used in homes. This may not show immediate effects but continual usage of contaminated water will be dangerous as body absorbs the metals and reflects in the form of typical diseases. The pH of the samples was 7-8, showing the alkaline nature of the samples. This study inhibits the ground water to drink and will be valuable for selecting appropriate mitigation for the e-waste-impacted deteriorated environments and to safeguard the environment and people from potential hazards.
Acknowledgements
Authors acknowledge financial support from the department of chemistry, University of Karachi, Karachi, Pakistan and People Steel mills Ltd, Karachi Pakistan for technical assistance.
References
- Daud MK, Nafees M, Ali S, Rizwan M, Bajwa RA, et al. (2017) Drinking water quality status and contamination in Pakistan. BioMed Research International 2017: 1-18.
- WWF R (2019) Situatnal analysis of water resoyrce in karachi.
- Waseem A, Arshad J, Iqbal F, Sajjad A, Mehmood Z, et al. (2014) Pollution status of Pakistan: A retrospective review on heavy metal contamination of water, soil, and vegetables. BioMed Research International 2014: 1-19.
- Azizullah A, Khattak MNK, Richter P, Häder DP (2011) Water pollution in Pakistan and its impact on public health - A review. Environment International 37(2): 479-
- Iqbal M, Syed JH, Breivik K, Chaudhry MJI, Li J, et al. (2017) E-Waste driven pollution in Pakistan: The first evidence of environmental and human exposure to flame retardants (FRs) in Karachi city. Environmental Science and Technology 51(23): 13895-
- Li W, Achal V (2020) Environmental and health impacts due to e-waste disposal in China–A review. Science of the Total Environment 737:
- United Nations University (2014) One global definition of E-waste. Step Initiative, 3576.
- Song Q, Li J (2014) A systematic review of the human body burden of e-waste exposure in China. Environ Int 68: 82-
- Olafisoye OB, Adefioye T, Osibote OA (2013) Heavy metals contamination of water, soil, and plants around an electronic waste dumpsite. Polish Journal of Environmental Studies 22(5): 1431-
- Reuter M (2013) Metal recycling opportunities. UNEP, Kenya.
- Umair S, Anderberg S, Potting J (2016) Informal electronic waste recycling in Pakistan. The Journal of Solid Waste Technology and Management 42(3): 222–235.
- Masood M, Barlow CY (2013) Framework for integration of informal waste management sector with the formal sector in Pakistan. Waste Management and Research 31(10 Suppl): 93-105.
- Rafeeq A, Ali SA, Tanoli AK, Shah AR, Khan A, et al. (2020) Soil contamination due to heavy metals at electronic waste dumpsites in Karachi, Pakistan. Pakistan Journal of Analytical and Environmental Chemistry 21(2): 332-
- Iqbal M, Breivik K, Syed JH, Malik RN, Li J, et al. (2015) Emerging issue of e-waste in Pakistan: A review of status, research needs and data gaps. Environmental Pollution 207: 308-
- Sajid M, Sye JH, Iqbal M, Abbas Z, Hussain I, et al. (2019) Assessing the generation, recycling and disposal practices of electronic/electrical-waste (e-waste) from major cities in Pakistan. Waste Manag 84: 394-
- Iqbal M, Syed JH, Breivik K, Chaudhry MJI, Li J, et al. (2017) E-Waste driven pollution in Pakistan: The first evidence of environmental and human exposure to flame retardants (FRs) in Karachi city. Environmental Science and Technology 51(23): 13895-
- Iqbal M, Syed JH, Katsoyiannis A, Malik RN, Farooqi A, et al. (2017) Legacy and emerging flame retardants (FRs) in the freshwater ecosystem: A review. Environmental Research 152: 26-
- Baldé CP, Wang F, Kuehr R (2016) Transboundary movements of used and waste electronic and electrical equipment: Estimates from the European union using trade statistics.
- Zimring C, Rathje W, Ellis AD (2012) Encyclopedia of consumption and waste: The social science of garbage, SAGE Publications, USA, pp. 6-
- Alam N, Ahmad SR, Qadir A, Ashraf MI, Lakhan C, et al. (2015) Use of statistical and GIS techniques to assess and predict concentrations of heavy metals in soils of Lahore City, Pakistan. Environ Monit Assess 187(10): 636.
- Zheng X, Xu X, Yekeen TA, Zhang Y, Chen A, et al. (2016) Ambient air heavy metals in PM2.5 and potential human health risk assessment in an informal electronic-waste recycling site of China. Aerosol and Air Quality Research 16(2): 388-
- Umair S, Björklund A, Petersen EE (2015) Social impact assessment of informal recycling of electronic ICT waste in Pakistan using UNEP SETAC guidelines. Resources, Conservation and Recycling 95: 46-57.
- Singhal D, Lyngdoh T (2021) Knowledge, attitude and practice study of health risks among E-waste recyclers in Delhi. J Health Pollut 11(29): 210306.
- Ahmed K, Hassan N, Akhter N, Mumtaz M (2019) Chemical and morphological characteristics of heavy and hazardous metals in settled dust associated with different functional areas of Karachi, Pakistan. J Bio Env Sci 46(3): 46-
- Rani B, Singh U, Maheshwari R, Chauhan AK (2012) Perils of electronic waste: Issues and management strategies. Journal of Advanced Scientific Research 3(1): 17-
- Strachan S (2010) Trace elements. Current Anaesthesia and Critical Care 21(1): 44-
- Uwah EI, Jonathan II, Udosen IE (2020) Risk assessment of trace metals in roadsides vernonia amygdalina obtained in Abak, Nigeria. Modern Chemistry 8(4): 48-
- Fu J, Zhou Q, Liu J, Liu W, Wang T, et al. (2008) High levels of heavy metals in rice (Oryza sativa L.) from a typical E-waste recycling area in southeast China and its potential risk to human health. Chemosphere 71(7): 1269-
- Grant K, Goldizen FC, Sly PD, Brune MN, Neira M, et al. (2013) Health consequences of exposure to e-waste: A systematic review. The Lancet Global Health 1(6): e350-
- Wu YC, TH (2010) Effective e-waste management-The role of international cooperation and fragementation. MPRA 46733: 6-
- Wang Z, Zhang B, Yin J, Zhang X (2011) Willingness and behavior towards e-waste recycling for residents in Beijing city, China. Journal of Cleaner Production, 19(9-10): 977-
- Bureau F, Government S (2020) Compendium on environment statistics of Pakistan.
- Hassan N, Naseem A, Hussain SS, Mumtaz M (2020) Study of alkali metal oxides, alkaline earth metal oxides and non-metal oxides in settled dust of assorted regions of Karachi, Pakistan.
- Ehi-Eromosele CO, Adaramodu AA, Anake WU, Ajanaku C, Edobor-Osoh A (2012) Comparison of three methods of digestion for trace metal analysis in surface dust collected from an E-waste recycling site. Journal of Chemical Information and Modeling 10(10): 1689-
- Idoko OM, Ologunorisa TE, Okoya AA (2012) Temporal variability of heavy metals concentration in rural groundwater of Benue state, middle belt, Nigeria. Journal of Sustainable Development 5(2): 2-
- Liu J, Xu X, Wu K, Piao Z, Huang J, et al. (2011) Association between lead exposure from electronic waste recycling and child temperament alterations. NeuroToxicology 32(4): 458-
- Edition F (n.d.) Guidelines for Drinking-water Quality.
- Ogunseitan OA, Schoenung JM (2012) Human health and ecotoxicological considerations in materials selection for sustainable product development. MRS Bulletin 37(4): 356-363.
- UNDP (2016) Human development report 2016: Human development for everyone. United Nations Development Programme, USA.
- Dil AS, Qazi IA, Baig MA, Khan EA, Tahir A (2008) Quality drinking water: Standards for Pakistan.
- WHO (2017) Guidelines for drinking‑water quality.
- Network E (2010) Aquatic system 51(8): 951-
- Khwaja MA, Aslam A (2018) Comparative assessment of Pakistan national drinking water quality standards with selected Asian countries and world health organization. Turkish Journal of Emergency Medicine 12: 27-33.
- Adaramodu AA, Osuntogun AA, Ehi-Eromosele CO (2012) Heavy metal concentration of surface dust present in e-waste components: The westminister electronic market, lagos case study. Resources and Environment 2(2): 9-
- Seidu J, Ewusi A (2020) Assessment of groundwater quality and health risk of heavy metals : A study from the Tarkwa mining area, Ghana 20(2): 1-
- Ugwu KE, Ofomatah AC (2021) Concentration and risk assessment of toxic metals in indoor dust in selected schools in Southeast, Nigeria. SN Applied Sciences 3(1): 1-13.
- Wang H, Han M, Yang S, Chen Y, Liu Q, et al. (2011) Urinary heavy metal levels and relevant factors among people exposed to e-waste dismantling. Environ Int 37(1): 80-
- Zeng X, Xu X, Boezen HM, Huo X (2016) Children with health impairments by heavy metals in an e-waste recycling area. Chemosphere 148: 408-
- Patil RA, Ramakrishna S (2020) A comprehensive analysis of e-waste legislation worldwide. Environ Sci Pollut Res Int 27(13): 14412-14431.
- Juneng L, Latif MT, Tangang F (2011) Factors influencing the variations of PM10 aerosol dust in Klang valley, Malaysia during the summer. Atmospheric Environment 45(26): 4370-
- Rafeeq A (2019) Determination of toxic metals from Karachi region electronic waste dumpsite in (karachi). HEC Pakistan, Pakistan.
© 2021 Abdul Rafeeq. This is an open access article distributed under the terms of the Creative Commons Attribution License , which permits unrestricted use, distribution, and build upon your work non-commercially.
 a Creative Commons Attribution 4.0 International License. Based on a work at www.crimsonpublishers.com.
Best viewed in


.jpg)


 Editorial Board Registrations
 Submit your Article
 Refer a Friend
 Advertise With Us
.jpg)


.jpg)


.bmp)
.jpg)
.png)
.jpg)


.jpg)


.png)

.png)


.png)


