- Submissions

Full Text
Annals of Chemical Science Research
Influence of Ph on Copy-Paper Mechanical Properties Such as the Tensile Strength and Printability
Chryssou K*, Stassinopoulou M and Lampi E
General Chemical State Laboratory, Β΄ Chemical Service of Athens, Greece
*Corresponding author: Chryssou K, General Chemical State Laboratory, Β΄ Chemical Service of Athens, Greece
Submission: June 09, 2021Published: July 01, 2021

Volume2 Issue4July, 2021
Abstract
Nine series of experiments were conducted on nine different copy paper samples to determine whether there is a correlation between their pH values, their tensile strengths, and printability with statistical tests which confirmed the connection. Ιn this work, all statistical tests were performed via SPSS software. The regression analysis and statistics have confirmed that there was a connection. In more detail the ANOVA with significant value 0.001 led us to reject the null hypothesis that there was no connection between the parameters of the pH value the tensile force MD, the pick picking IGT MD and the ratio MD/ CD tensile strength. In coefficients the predictor variable pick-picking IGT was significant because its p-value was 0.000. The p-value for the ratio MD/CD tensile strength was lower than 0.05, i.e., 0.011 which indicated that it was statistically significant too. The Kruskal-Wallis test confirmed also the connection between the mean values of tensile force MD and pH value and pick-picking IGT and ratio MD/CD tensile strength. From the test of normality, the p=0.019 suggested an evidence of non-normality for the data set of pH and ratio MD/CD tensile strength. Also, the ANOVA with significant value 0.000 led us to reject the null hypothesis that there was no connection between the parameters of the pH, the tensile force CD, the pick picking IGT MD and the ratio MD/CD tensile strength. From the Kruskal-Wallis H test again a p-value of 0.118 confirmed the null hypothesis that the group medians were all equal when the pH value, the CD tensile strength, the pick-picking IGT MD and ratio MD/CD tensile strength were concerned. A boxplot was produced from the descriptive statistics, for the latter parameters i.e., the pH value, the CD tensile strength, the pick picking IGT MD and the ratio MD/CD tensile strength. The dataset had a negative kurtosis i.e., -0.916 and was considered to be a “light-tailed” dataset. From the one-sample t-test we concluded in a level of importance α=0.01 that there was a difference between all the average pH values measured. Finally, the optimal pH values were identified during the analysis of the nine samples of copy paper at the beginning of the year 2021, to be 10.7 when measuring the tensile strength MD, and 10.5 when measuring tensile strength CD, pick picking IGT and the ratio MD/CD tensile strength.
Keywords: pH; Tensile strength; Pick-picking IGT; Ratio MD/CD tensile strength; SPSS; Anova; Kruskalwallis H test; Shapiro-Wilk test; Test on normality
Introduction
The aim of this study was to investigate the effect of pH on the final copy paper product properties and thus on paper-fiber characteristics. The pH level of paper pulp affects the surface charge, the fiber swelling, and finally the paper strength. Thus, there may be a correlation between the pH, the tensile strength and pick picking IGT of the copy paper samples tested in this work. It has already been stated that the pH level certainly affects the fiber surface charge, and thus the fiber network structure of the copy paper sheets [1]. In this work tested paper properties were the pH, the tensile strength, pick picking IGT, and the ratio of tensile values MD versus CD.
At high pH, alkaline pH, the concentration of H+ ions decrease [1]. The hydrolysis rate though depends on the hydrogen ion concentration. At alkaline pH, the hydrolysis rate depends on hydrogen ion concentrations due to the fact that acid hydrolysis of β(1→4) glycosidic bonds, which link the glucose monomers that make up cellulose, is lowered, and in turn the hydrogen bonding is lowered [2]. The swelling of the fibers then is increased, and the cellulose crystalline structure is preserved and tensile strength and printability attain high values. A glycosidic bond or glycosidic linkage is a type of covalent bond that joins a carbohydrate molecule and may also be formed another carbohydrate [3]. A glycosidic bond and may also be formed between the hemiacetal or hemicetal group of a saccharide and the hydroxyl group of some other compounds such as an alcohol. On the other hand, the N-glycosidic bonds in nucleosides [4] are highly stable in neutral and alkaline media and prone to hydrolysis in the presence of mineral and organic acids. An increased pH value leads to a higher amount of surface charges which leads to greater swelling of the cellulose fibers.
The tensile strength test was conducted to determine the strength of the copy paper samples as per standard ISO 1924-2:2008 [5] with a cross head speed of 20mm/min. The specimens of each copy paper sample were tested 20 times in the MD dimension and 20 times in the CD dimension and their average values were calculated. The mechanical testing (tensile) was carried out on the Zwick Roel testing machine [6]. We have also conducted nine series of experiments measuring the pH of the aqueous extracts of copy paper A4 and A3 samples, as per standard ISO 6588-1:2020 [7], since the beginning of the year 2021. The pH values of the nine paper samples were measured at different temperatures between 20-25 0C and were corrected using the Nernst equation.
Finally, the pick picking IGT printability test was held as per ISO 3783:2006 [8], for all nine samples for the MD and CD direction, and the MD value was recorded in this work. Analyses and statistics estimates were conducted for all nine values of the parameters of the pH and the corresponding values of the tensile strength MD and CD, and the pick picking IGT MD, as well as the tensile strength ratio. The optimal pH value for better tensile strength value MD and CD and pick-picking IGT value MD was to be evaluated by analyzing the nine copy-paper samples.
Experimental
The tensile testing machine Zwick Roell Z2.5 BT1-FR 2.5th D14/2008, S.N.181435/2008, which extended the paper test pieces of dimensions 15mm x 210mm, at 20mm/min constant rate of elongation and measured the maximum tensile force was used. It had a strength force of 2.5KN. The tensile testing machine measured the maximum tensile force to an accuracy of ±1% of the true force. The machine had a long stroke extensometer placed directly on the paper test piece for the measurement of its elongation. The machine was connected with a computer LG. The tensile testing machine included two clamps for holding the paper test pieces of 15mm width. The clamps grabbed the test pieces firmly along the straight line across the full width of the test pieces and adjusted the clamping force pneumatically. The machine had pneumatic grips of 2.5kN, and a long stroke extensometer. A guillotine IDEAL 1043 GS DP 02050 made in Germany, for cutting the paper test pieces used in the tensile strength test to dimensions of 15mm x 210mm, was also used. An accredited ruler for measuring the width of the paper test piece and also of measuring the rate of elongation was also used.
An IGT Global Standard Tester 1 with printing force 350N and printing velocity 4.00m/s, and a high-speed inking unit 4, software Version 3.01, consisting of 5 inking drums having contact with the top-roller was used for the determination of the pick-picking IGT value MD. The IGT pick test oil was of middle viscosity with number 404.004.020 and consisted of poly-isobutene’s. The tester was accompanied with an aluminum disc 10mm wide with smooth edges, and a diameter of 65.0mm. There was also a paper packing consisting of 6 layers of paper with a total thickness of 1.5mm. There was also an ink pipette for applying an accurate quantity of pick-test oil to the inking device, having a volume of 2ml. The distributing time of the ink was 15s and the inking time of the aluminum disc was 10s. The speed during inking time was 0.4m/s and the temperature was kept at 23.2 °C. The ink layer thus formed was approximately 8μm thick. Also, a pick-start viewer was used to determine the starting point of pick, which had a light source providing grazing incident light to the paper test piece and observed pick velocity. Petroleum ether 60°-80 °C of analytical reagent grade solvent was used to wet the cleaning rag, lint-free, which served as cleaning aid. There was also a tank filled with water with a built-in thermometer which kept the ambient temperature near the printing device at 23 °C with an accuracy of 0.1 °C. Finally, there was a ruler with length of 200mm which measured the distance from the print starting point to the pick starting point. The guillotine IDEAL 1043 GS DP 02050 was used also for cutting the paper test pieces to dimensions of 55mmx340mm used in the testing of the pick picking IGT. The pH value of the nine paper samples was measured at different temperatures between 20-25 °C and was corrected at 25 °C using Nernst equation, and using a model Metrohm 716 DMS Titrino pH-meter. All measurements were performed as per standard ISO 6588-1:2020 in duplicate and the average values were reported here.
Result and Discussion
In Table 1 and 2 below all the measured values of pH, tensile strength, and printability of the paper were recorded. Also, the grammage of the nine copy paper samples was displayed and was determined as per standard ISO 536/2012 [9]. Regression analysis generates an equation to describe the statistical relationship between one or more predictor variables and the response variable. The p-value for each term tests the null hypothesis that the coefficient p-value was equal to zero which indicates no effect. When the p-value was low (<0.05), here p=0.001, the null hypothesis could be rejected. A larger, insignificant p-value would suggest that the changes in the predictor were not associated with changes in the response. In the regression analysis conducted for the pH value, the dependent variable parameter was the tensile force MD. The independent variables were the pick picking IGT MD value and the ratio tensile strength.
Table 1: The values of the parameters of the pH, and the corresponding values of the tensile strength in KN/m, and printability of the paper, for the nine (9) samples tested since the beginning of the year 2021. For the grammage property the standard deviation of the measurements was also given. These standard deviations were the basis of defining standard uncertainty, which were called uncertainties at standard deviation level.

Table 2: The values of the parameters of the pH and the corresponding values of the tensile strength in MPa, and pick picking IGT and grammage for the nine (9) samples tested since the beginning of the year 2021.

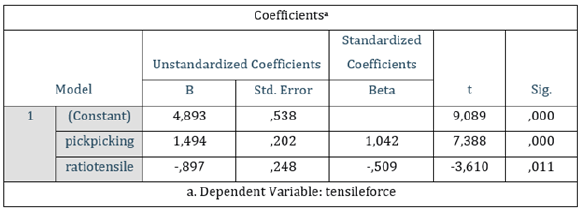
The null hypothesis was rejected here because the significant value was 0.001 in the ANOVA in the above Figure 1. That meant that there was a connection between the pH value and the other parameters considered i.e., tensile force MD, pick picking IGT value MD and ratio tensile strength. In the output below of coefficient in Figure 2 we could see that the predictor variable pick-picking IGT was significant because its p-value was 0.000. The p-value for the ratio-tensile was greater but remained lower than the common alpha level of 0.05, i.e., 0.011, which indicated that it was statistically significant too. Typically, we have used the coefficient p-value to determine which terms we should keep in our regression model. In the model above we had considered keeping both the pick picking IGT and the ratio tensile strength.
Figure 1: Regression Analysis-linear. The parameter tested was pH value, the dependent variable was tensile force MD, and the independent variables were pick-picking IGT MD, and ratio tensile MD/CD.
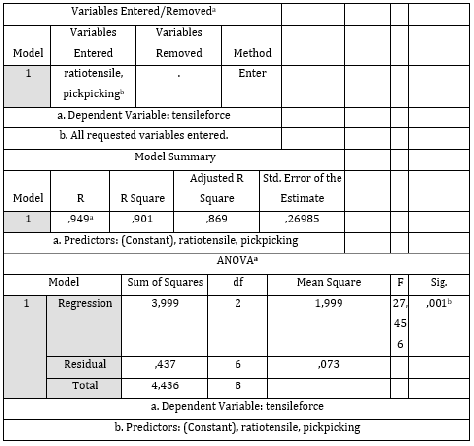
Figure 2:Regression Analysis-Coefficients. The parameter tested was pH value, the dependent variable was tensile force MD and the independent variables were pick-picking IGT MD and ratio tensile MD/CD.
From the Kruskal-Wallis H test [10,11] in Figure 3 resulting that there was a connection between the median values of tensile force recorded and pH and pick-picking IGT, and ratio tensile strength, because the significant value was 0.903. In the case of testing of several independent samples the conditions of the ANOVA dispersion analysis do not apply, that is, either if one of the samples does not follow a normal distribution or if the sample variations are not equal, then to examine whether the groups into which the values of a variable are divided are the same. We applied the Kruskal Wallis test which checks the null hypothesis Ho: the samples come from the same distribution. The Kruskal-Wallis H test is a rank-based nonparametric test that can be used to determine if there are statistically significant differences between two or more groups of an independent variable on a continuous or ordinal dependent variable. It is considered the non-parametric alternative to the one-way ANOVA.
Figure 3:Non-parametric tests, the Kruskal-Wallis test.

There was a connection between the median values of the tensile force recorded and the pH and pick-picking IGT values because the significant value was 0.903 in the Kruskal-Wallis test. The null hypothesis of no effect or no connection between the variables was rejected because the significant value was 0.001 in ANOVA. The null hypothesis was a hypothesis of no difference or no connection. The p value is less than the chosen significance level and we reject the null hypothesis. The choice of significance level at which we reject H0 is here 0.1%. This is statistically highly significant.
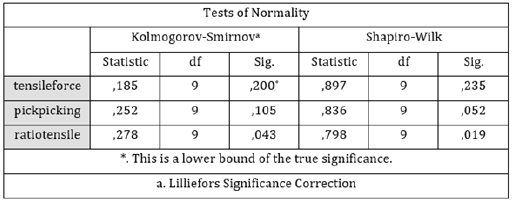
The data sets that had been obtained from this study were tested for normality, and a suitable test could be chosen for significance testing. The Shapiro-Wilk test [12] was a more powerful test than the Kolmogorov-Smirnov test. A confidence of 95% was chosen when we reported the test to be non-normal. The null hypothesis for the Shapiro-Wilk test was that the variable considered was normally distributed in the population. The null hypothesis was rejected when p<0.05. From the test Shapiro-Wilk (n<50) we had significant value =0.019<0.05 and we concluded that the variable ratio tensile strength did not follow a normal distribution. The value of the Shapiro-Wilk test was below 0.05 and the data significantly deviated from the normal distribution. The Kolmogorov-Smirnov test was modified to serve as a goodness of fit test. Because the sample size was nine (9) we have used the Shapiro-Wilk test. For the skewed data a p=0.019 (Figure 4) suggested strong evidence of non-normality for the ratio tensile strength. For the normally distributed data tensile force p was 0.235 so that the null hypothesis was retained at the 0.05 level of significance. For the approximately normally distributed data p=0.052 for the pick picking IGT parameter so that the null hypothesis was also retained at the 0.05 level of significance. Therefore, normality could be assumed for this data also.
Figure 4:Tests of normality-Shapiro-wilk test.
The normal Q-Q plot in the above Figure 5 was the alternative graphical method of assessing normality to a histogram [13,14]. It was easy to use because we had a rather small sample size. The scatter lay close to the line as possible with no obvious pattern coming away from the line, for the data to be normally distributed here. The detrended normal Q-Q plot depicted the differences between the observed and the predicted values. When in general the distribution of the values of the dependent variable was normal then the values of the difference between observed and predicted fell randomly about the zero line. This was not the case with the sample data since there were groups of values far above and below the zero line. Then a one-sample test was performed (Figure 6).
Figure 5:Two plots are presented, one of the normal Q-Q plot of tensile force and the detrended normal Q-Q plot of tensile force.
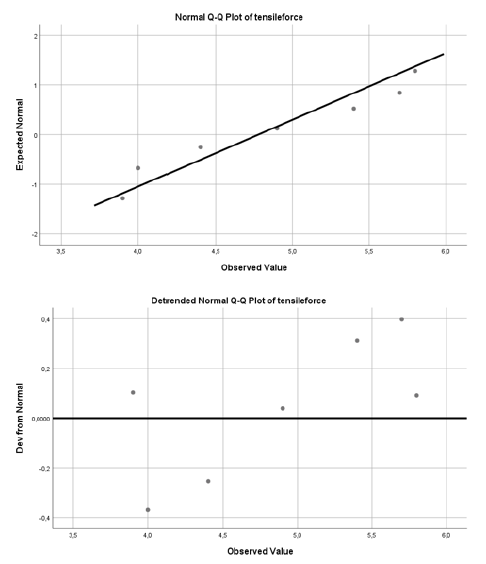
Figure 6:One-sample t-test.
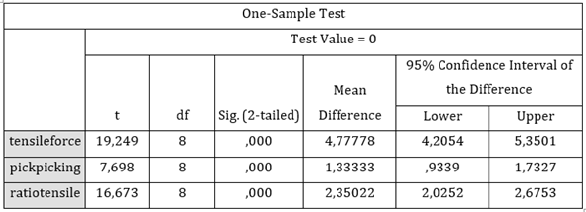
The null hypothesis for one-sample test Ho assumed that the difference between the true mean and the comparison values was equal to zero. Here the significant value is sig.0.000<0.05 and we rejected the null hypothesis. From the one-sample t-test, because the confidence interval between lower and upper does not contain zero we could conclude in a level of importance α=0.01 from these sample values that there was a difference between the average values of pH measured during this test study. Since the beginning of the year 2021 from nine copy-paper samples tested an optimum pH value was found to be pH 10.7 when the tensile force had a MD value of 4.9KN/m and a pick-picking IGT value of MD=2.0m/s. The tensile strength ratio was then 3.06.
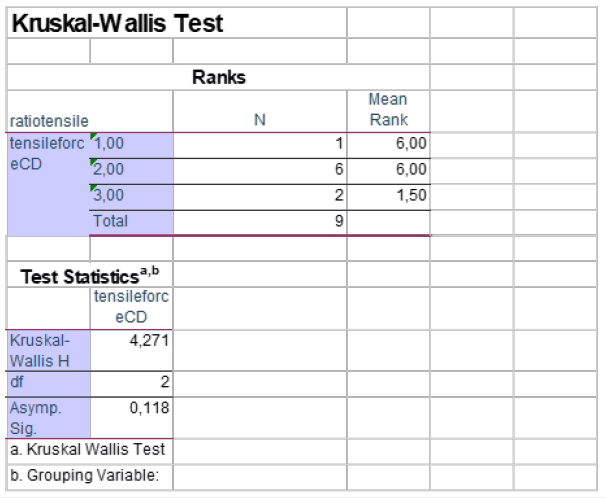
Then in the study, the regression analysis was performed again for the pH value. Then the dependent variable parameter was the tensile force CD. The independent variables were the pick picking IGT MD value and the ratio tensile strength. The same analyses and statistics estimates were repeated for the values of the parameters of the pH and the corresponding values of the tensile strength CD and the pick picking IGT MD, as well as the tensile strength ratio (Figure 7). In the regression analysis conducted for the pH value the dependent variable parameter was the tensile force CD. The independent variables were the pick picking IGT MD value and the ratio tensile strength. The significant value was then reported to be 0.000. This showed that this was less than 0.001 which in turn meant that it was less than the chosen significance level of 0.01. Thus, we can regard the null hypothesis as refuted and that there was really an association between pH value and tensile force in the CD direction and pick picking IGT MD and ratio tensile (Figure 8). Because the p-value was 0.118 in the Kruskal-Wallis H we did not have enough evidence to reject the null hypothesis that the group medians were all equal. From the descriptive statistics the following boxplot structure emerged.
Figure 7:Regression Analysis.

Figure 8:Non-parametric tests, the Kruskal-Wallis test Because the p-value was 0.118 in the Kruskal-Wallis H we did not have enough evidence to reject the null hypothesis that the group medians were all equal.
The box and whisker plot in Figure 9 displayed the five-number summary of the set of the data tested [15]. These were the minimum 10.14, the first quartile 10.24, the median 10.4, third quartile 10.52 and the maximum 10.66. The box was drawn from the first quartile to the third quartile. The vertical line went through the box at the median pH10.4. The median was a common measure of the center of the data. The interquartile range box represents the middle 50% of the data. The whiskers represented the ranges for the bottom 25% and the top 25% of the data values, excluding outliers. The univariate analysis in this study involved describing the distribution of a single variable i.e., pH including the range and the quartiles of the dataset. The shape of the distribution was described here via the indices of skewness and kurtosis. The characteristics of the pH variable distribution was depicted in a graphical format as the stem and leaf display. Because the skewness was 0.150 and was between -0.5 and 0.5, the data were fairly symmetrical. The skewness was usually described as a measure of the dataset’s symmetry. The perfectly symmetrical data set would have a skewness of 0. The kurtosis also of a normal distribution would be 0. Because here the dataset had a negative kurtosis, i.e., -0.916, it had less in the tails than the normal distribution. As the kurtosis decreases the tails became lighter. Here the kurtosis of the dataset was -0.916. Since that value was less than 0 it was considered to be a “light-tailed” dataset. It had as much data in each tail as it did in the peak (Figure 10).
Figure 9:Boxplot structure.
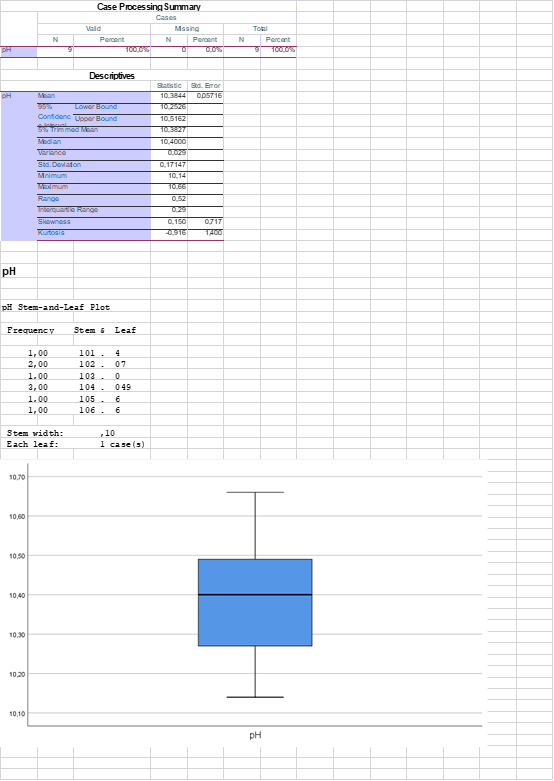
Figure 10:One-sample t-test.
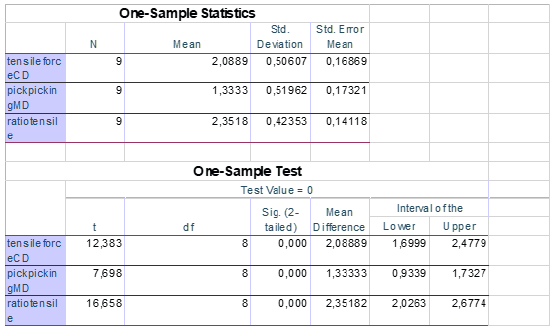
From the one-sample t-test, we could conclude in a level of importance α=0.01 from the above sample values that there was a difference between the average values of pH measured. This stems from the fact that the confidence interval between the lower and upper does not contain zero. Since the beginning of the year 2021 from nine copy-paper samples tested an optimum pH value was 10.5 when the tensile force had a CD value of 2.7KN/m and a pick-picking IGT value of MD=1.7m/s. The tensile strength ratio was then 2.1.
Conclusion
The aim of this study was to investigate the effect of pH on the final copy- paper product’s tensile strength and printability and thus on paper-fiber properties. It was known that the pH level affected the surface charge of the cellulosic fibers, the fiber swelling, and finally the paper strength [16]. The pH level affected the fiber surface charge, and the network structure of the paper sheets. The chemical composition of the pulp of the copy paper samples also greatly affected fiber strength [17]. The physical properties especially the tensile strength of the copy paper depended primarily on the degree of bonding between the fibers. They increased with increasing fiber length, fiber strength and fiber joint strength. The fiber-fiber joint strength increased with increasing surface charge of the fibers due to increased surface swelling. The paper was affected by changes in pH because of the surface charges of the fibers. As the pH became more alkaline than pH 3 the surface charge of the fibers increased. At a pH greater than 3 there was a significantly higher surface fiber load and tensile value. A pH 9 showed denser fiber networks than a pH 3. Charged groups separated and moved away to greater pH levels [16], increasing swelling of the fibers and consequently increasing the tensile strength of the final copy paper products.
It was known that the pH in general had an effect on the original strength of paper and a very great effect on the permanence of paper [18]. Data and analysis previously acquired, not published, were included in this study for comparison purposes. From seventy-three (73) separate experiments conducted previously during the year 2019, tests had shown that when the pH was 9.6 there was a high value of tensile force MD=5.8KN/m and also a high value of pick picking IGT of MD=1.8m/s. The pH 9.6 was then one optimum pH value. Also, then when we had a pH value of 9.97 then the pick picking IGT test produced a high value of MD=2.2m/s. Then, in year 2020, forty-three (43) separate experiments were carried out and one optimum pH value of 9.77 was found and then the tensile force had a MD value of 5.6KN/m and a pick-picking IGT value of MD=2.2m/s.
Since the beginning of the year 2021 nine sets of experiments in different copy paper samples were conducted and an optimum pH value was 10.7 and then the tensile force had a MD value of 4.9KN/m and a pick picking IGT value of MD=2.0m/s. The tensile strength ratio was 3.06. Also, an optimum pH value was pH 10.5 and then the tensile force had a CD value of 2.7KN/m and a pick picking IGT value of MD 1.7m/s. The tensile strength ratio was then 2.1. The pH value was found as an important parameter in the production of enzymes [19]. As the pH became more alkaline the enzymatic hydrolysis, the hydrolysis of β(1→4) glycosidic bonds diminished and we had a lower number of hydrogen bonds and a crystalline structure in cellulose which favored the high tensile strength and the high pick-picking IGT value [20,21] as was concluded also from the present study.
From the above experiments we concluded that as the pH value increased the ratio of the tensile strength values also increased. As the pH value raised, the hydrolysis of the β(1→4) glycosidic bonds may have been lowered, the hydrogen bonds were kept low and the crystalline structure of the cellulose was preserved. The alkaline pH value may have affected the network structure of the fibers of the copy paper sheets. As the pH raised the network of fibers became denser. The paper was affected by the changes in pH probably because of the surface loads of the paper fibers. The above trials indicated that a higher alkaline pH value may have led to superior copy paper properties, such as tensile strength and printability.
References
- Thu Dieu Le, Luyen Thi Tran, Hue Thi Minh Dang, Thi Thu Huyen Tran, Hoang Vinh Tran (2021) Graphene oxide/polyvinyl alcohol/Fe3O4 nanocomposite: An efficient adsorbent for Co(II) ion removal. Journal of Analytical Methods in Chemistry, pp.1-10.
- Yunpeng Shang, Hui Gao, Lei Li, Chaoqun Ma, Jiao Gu, et al. (2021) green synthesis of fluorescent ag nanoclusters for detecting Cu2+ ions and its “switch-on” sensing application for GSH. Journal of Spectroscopy, pp.1-10.
- Jonsson Hanna (2010) Exploring the structure of oligo- and polysaccharides. Synthesis and NMR spectroscopy, PhD thesis, Stockholm University
- Devereaux ZJ, Zhu Y, Rodgers MT (2019) Relative glycosidic bond stabilities of naturally occurring methylguanosines: 7-methylation is intrinsically activating. European Journal of Mass Spectroscopy 25(1): 16-29.
- (The International Organization for Standardization) ISO 1924-2:2008 Paper and board-Determination of tensile properties-Part 2: Constant rate of elongation method (20mm/min).
- Ashraf W, Ishak MR, Zuhri MYM, Yidris N, Yaacob AM (2021) experimental investigation on the mechanical properties of a sandwich structure made of flax/glass hybrid composite face sheet and honeycomb core. International Journal of Polymer Science, pp. 1-10.
- (The International Organization for Standardization) ISO 6588-1:2012-Paper, board and pulps-Determination of pH of aqueous extracts-Part 1: Cold extraction.
- (The International Organization for Standardization) ISO 3783:2006 Paper and board-Determination of resistance to picking-Accelerated speed method using the IGT-type tester (electric model).
- (The International Organization for Standardization) ISO 536:2012 Paper and board-Determination of grammage.
- Cohen A, Sackrowitz HB (1991) Tests for independence in contingency tables with ordered categories. Journal of Multivariate Analysis 36: 56-67.
- Taheri SM, Hesamian C (2011) Goodman-Kruskal measure of association for fuzzy-categorized variables. Kybernetika 47(1): 110-122.
- Hanusz Z, Tarasinska J, Zielinski W (2016) Shapiro-Wilk test with known mean. Revstat-Statistical Journal 14(1): 89-100.
- Keya Rani Das, Rahmatullah Imon AHM (2016) A brief review of tests for normality. American Journal of Theoretical and Applied Statistics 5(1): 5-12.
- Zubir NSA, Abas MA, Ismail N, Rahiman MHF, Tajuddin SN, et al. (2017) Statistical analysis of agarwood oil compounds in discriminating the quality of agarwood oil. Journal of Fundamental and Applied Sciences 9(45): 45-61.
- Williamson DF, Parker RA, Kendrick JS (1989) The box plot: A simple visual method to interpret data. Annals of Internal Medicine 110(11): 916-921.
- Jansson Jennie (2015) The influence of pH on fiber and paper properties. Master Thesis, Faculty of Health Science and Technology Department of Engineering and Chemical Science, Chemical Engineering, Karlstand University, Sweden.
- Hafizur Rahman, Mikael E Lindström, Peter Sandström, Lennart Salmén, Per Engstrand (2017) The effect of increased pulp yield using additives in the softwood kraft cook on the physical properties of low-grammage hand sheets. Nordic Pulp & Paper Research Journal 32(3).
- Casey JP (1980) Pulp and paper, chemistry and chemical technology. In: Casey JP (Ed.), 3rd(edn), Volume 2.
- Yabefa JA, Ocholi Y, Odubo GF (2014) Effect of temperature and changes in medium pH on enzymatic hydrolysis of β(1-4) glycosidic bond in orange mesocarp. Asian Journal of Plant Science and Research 4(4): 21-24.
- Anna Palme, Hans Theliander, Harald Brelid (2016) Acid hydrolysis of cellulosic fibres: Comparison of bleached kraft pulp, dissolving pulps and cotton textile cellulose. Carbohydrate Polymers 136: 1281-1287.
- Yanjun Xie, Andreas Krause, Holger Militz, Hrvoje Turkulin, Klaus Richter, et al. (2007) Effect of treatments with 1,3-dimethylol-4,5-dihydroxy-ethyleneurea (DMDHEU) on the tensile properties of wood. Holzforschung 61(1): 43-50.
© 2021 Chryssou K. This is an open access article distributed under the terms of the Creative Commons Attribution License , which permits unrestricted use, distribution, and build upon your work non-commercially.
 a Creative Commons Attribution 4.0 International License. Based on a work at www.crimsonpublishers.com.
Best viewed in


.jpg)


 Editorial Board Registrations
 Submit your Article
 Refer a Friend
 Advertise With Us
.jpg)


.jpg)


.bmp)
.jpg)
.png)
.jpg)


.jpg)


.png)

.png)


.png)


