
- About Us
- Information
-

The Author ensures that the research has been conducted responsibly and ethically with adherence to all relevant regulations. read more..
- For Authors
- For Reviewer
- Manuscript Guidelines
- Membership
- Publication Ethics
-
- Journals
- Reprints
- e-Books
- Videos
- Policies
- Contact Us
 COVID-19
- Submissions


Full Text
Annals of Chemical Science Research
Analysis of a Product Cleaner for Car Windows and Identification of its Surfactants by Infrared Absorption Spectra and Calculation of Band Gap Energy by its Reflectance Graph
Chryssou K*, Stassinopoulou M and Lampi E
General Chemical State Laboratory, B’ Chemical Division of Athens, Greece
*Corresponding author: Chryssou K, General Chemical State Laboratory, B’ Chemical Division of Athens, Greece
Submission: June 22, 2020Published: July 17, 2020

Volume2 Issue2July, 2020
Abstract
A type of a commonly used detergent (i.e. a detergent product for cleaning car windows), has been analyzed. Its infrared curve serves as a means of identification of the surfactants present in it. Diffuse reflectance spectra analysis is applied for the detergent sample and its band gap energy is also calculated. The band gap energy is calculated for permitted indirect transitions.
Keywords: Car window cleaning product; Ir spectra; Band gap energy calculation; Indirect allowed transitions
Introduction
Membrane proteins containing multiple membrane spanning domains are insoluble in aqueous solution which is a drawback in their structural and functional characterization. Usually their characterization requires solubilization by anionic surfactants or generally amphipathic agents for the extraction of the membrane proteins from the membrane and their purification. Their solubilization into detergent micelles is a popular method for this purpose and is useful for the characterization of membrane proteins. The use of a reflectance spectra (DRS) is used to present a simple method for the determination of band gap energy of the car cleaner product tested in this study.
The band gap is generally obtained from optical absorption edge energy, which is defined as the minimum photon energy required to excite an electron from the highest occupied molecular orbital (HOMO) to the lowest unoccupied molecular orbital (LUMO) [1,2]. The detergent product analyzed here was a mixture of anionic surfactant and non-ionic surfactant, as well as soap and chelating agent and colourants. The mixture consists of 2-Ethyl-hexyl sodium sulfonate, and alcohols C12-14 ethoxylated sulfates sodium salts, as well as soap, ethylene diamine tetracedic tetrasodium (EDTA), FDC Blue colorant, FDC Yellow colorant, and solvents i.e. water, and 4%v/v isopropyl alcohol and 6%v/v 1-methoxy-2-propanol. In an attempt to select a biomimetic system for the structural and functional studies of membrane proteins, a cleaner product for car windows was tested to assess its structure. The cleaner product studied may be suitable to solubilize membrane proteins [3,4].
Experimental
Reagents
All compounds were AR quality and they were used without further purification.
Hyamine1622 0.004M solution (Benzethonium chloride standard volumetric solution
c(C27H42ClNO2) =0.004mol/l, Merck 1.15480.1000 HC892461 Barcode4022536160498
Ethanol absolute anhydrous (1L) Carlo Erba UN1170 Gradient grade
Ethanol 95%v/v solution, neutralized to the phenolphthalein solution
Sulphuric acid RPE 0,5M (1N) For analysis Carlo Erba UN 2796
Sulfuric acid standard solution 2.5M Fluka Analytical 1L Sigma-Aldrich UN 2796 M.W.: 98.08g/mol
Sodium hydroxide 0.1N (N/10) RPE UN 1824 For analysis Carlo Erba Potassium hydroxide approximately 0.5N standard volumetric solution in ethanol
KOH (Potassium hydroxide) 1Kg ERFAR, MW:56.11, DAB 6, B.P. 1968
Phenolphthalein 1%w/v in ethanol 95°
Water solution 0.1%v/v of 2,7-dichlorofluorescein indicator
Chloroform AG PENTA 1000ml Batch No. 2110271016, Product code 17130-11000
PAN indicator 0.1%w/w solution of 1-(2-pyridylazo)-2-naphthol in ethanol
Copper (II) sulfate standard volumetric solution c(CuSO4) 0.0100mol/l
Potassio Permanganato N/10 Carlo Erba Normex Cod. 473591 PP900101
Apparatus
pH-meter Metro hm 716 DMS Titrino, Swiss made
Analytical balance Mettler Toledo AB 204-S/FACT accurate to 0.1mg, maximum capacity 220g
Oven Memmert direkt, capable of being controlled at 103 0C ± 2 0C
Water bath FALC, 220/240V, 50Hz
FT-IR Spectrometer Perkin Elmer Inc Spectrum 2000 Version 5.0.2 Copyright 2004
Spectrophotometer CM-3630 BCMTS M Type 40605, S.N. 43029, Touch Screen-M V 2.0, Frank-PTI
Ordinary laboratory apparatus
Beakers of capacity 250ml, 500ml volumetric flasks, burette capacity 50ml.
Sample preparation
The sample of the car cleaner product was analyzed directly, and no sample preparation was required on the finished cleaner product.
Analysis of the detergent product
Procedure
Preparation of the mixed acid indicator stock solution: We weighed 0.5g of dimidium bromide into a 100ml beaker and we added 20ml of hot 10%v/v ethanol to the beaker. We weighed 0.25g of Disulfine Blue VN 150 into a second beaker and we added to it 30ml of hot 10%v/v ethanol. We stirred the two solutions until dissolved and we transferred the two solutions to a 250ml one-mark volumetric flask. We rinsed the beakers into the volumetric flask with the hot 10%v/v ethanol and we diluted to the mark with the ethanol.
Preparation of the acid solution of the mixed indicator solution: We added 100ml of water to 10ml of the stock solution (2.5.1.1.) in a 250ml one-mark volumetric flask. We added 10ml of 2.5M (5N) sulfuric acid solution, we mixed and we diluted to the mark with water. We stored in the dark.
Preparation of water solution 0,1%v/v of 2,7-dichlorofluorescein indicator: We weighed 0.1g of 2,7-dichlorofluorescein into a 100ml one-mark volumetric flask add we diluted to the mark with the water.
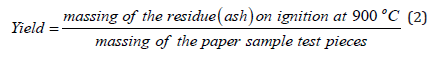
Determination of soluble-insoluble matter ethanolic 95%w/v: We weighed 15.1838g of the detergent sample in a 250ml beaker. We added 75ml ethanol 95w/v and we heated on a water bath for 2 hours while stirring often with a glass rod. The glass beaker was covered with a watch glass all time. We then dried a filter paper to be used for the filtration of the insoluble matter, in the oven controlled at 103o ± 2 °C for 1hour. We allowed it to cool to ambient temperature in a desiccator for 20min and we weighed it to be 1.0211g. We placed it in a funnel mounted on a glass container on the water bath. When the dissolution of the detergent appeared to be complete, we decanted the supernatant liquid, on to the filter paper. After decantation we added 25ml of ethanol 95%w/v to the 250ml glass beaker and after heating it to near its boiling point, we transferred the insoluble matter to the filter paper with the aid of small quantities of the warm ethanol. The filter paper and the residue were washed with the warm ethanol until entirely free from detergent. We then dried the filter paper, in air and we placed it in the oven at 103o ± 2 °C. We also placed the beaker with the glass rod in the oven at 103o ± 2 °C. After 1hour we removed the filter paper, as well as the glass beaker and we left them in the desiccator for 20min for them to cool, and we weighed them. Yield: 0.0067g, 0.044%w/w. The percentage yield is calculated as [(mass of insoluble matter ethanolic in g) *100/(mass of detergent sample in g)]. The ethanolic solution of the filtrate in the glass container on the water bath was then heated. We evaporated off all the ethanolic solution. We then heated the glass container with the soluble matter to constant mass in the oven controlled at 103o ± 2 °C. We finally cooled it in a desiccator, and we weighed the contents. Yield: 0.0170g-0.112%w/w. The percentage yield is calculated as [(mass of soluble matter ethanolic in g) *100/(mass of detergent sample in g)].
Determination of the anionic-active matter content by manual direct two-phase titration procedure: We weighed 15.0154g of the cleaner product into a 250ml beaker, an amount of laboratory sample which contains about 0.004mol of the anionic-active matter. We transferred quantitatively to a 500ml one-mark volumetric flask with ground glass stopper and we diluted to the mark with water. We mixed thoroughly and by means of a pipette we transferred 20ml of this solution to the measuring cylinder. We then added a few drops of the phenolphthalein solution, and we neutralized to a faint pink colour with the sodium hydroxide solution 0.1M as required. We then added to the measuring cylinder solution 10ml of water, 15ml of chloroform and finally 10ml of the mixed indicator solution. We then titrated against the benzethonium chloride solution. We stoppered the measuring cylinder after each addition of the hyamine 1622 0.004M, and we shaked well. Then the lower chloroform layer was colored pink. We continued the titration with repeated vigorous shaking. As the end point approached, the emulsion formed during shaking, tended to break easily. We continued the titration drop by drop shaking after each addition of titrant until the end point was reached. The end point was reached at the moment when the pink colour was completely discharged from the chloroform layer, which became a faint greyish blue color. Volume of benzethonium chloride solution used: 0.2ml. Yield: 0.0464%w/w from 15.0154g of detergent sample in 500ml water deionized solution, or from 30.0308g of detergent in 1L water deionized solution. The anionic active matter in percent is calculated as [(volume V in ml of Hyamine 1622 used *0.004M*348,49g g/mol*5)/ (mass of detergent 1L solution)].
Determination of soap by manual direct two phase titration procedure in detergent: We weighed 15.0154g into a 250ml beaker of the detergent sample which contains about 0.004mol of soap. We transferred quantitatively to a 500ml one-mark volumetric flask with ground glass stopper and diluted to the mark with water. We mixed thoroughly and by means of a pipette we transferred 20ml of this solution to a marked measuring cylinder. We then added to the measuring cylinder solution 10ml of water and 5 drops of the indicator solution 2,7-dichlorofluoresquein 0.1%v/v. We then added 15ml of chloroform and finally 2ml ethanolic solution KOH 0.5M. We then titrated against the benzethenium chloride solution. We stoppered the measuring cylinder after each addition of the hyamine 1622 0.004M, and we shaked well. Then the lower chloroform layer was colored yellow. We continued the titration with repeated vigorous shaking. As the end point approached the emulsion formed during shaking tended to break and colored faintly pink. We continued the titration drop by drop, shaking after each addition of titrant, until the end point was reached. This is at the moment when the faintly pink color from the chloroform layer became a strong pink. Volume of benzethonium chloride solution:(0.4-0.2)ml i.e.0.2ml, Yield: 0.043%w/w soap from 15.0154g of detergent sample in 500ml water deionized solution, or from 30.0308g of detergent in 1L water deionized solution. The soap in percent is calculated as [(volume (V’-V) in ml of Hyamine 1622 used *0,004M*326g/mol*5)/ (mass of detergent 1L solution)].
Determination of chelating agent content with titration: We weigh 10.1544g of the detergent sample into a conical flask. We added 100ml of warm water to the test portion and stirred vigorously to dissolve. After the operation of dissolution, we introduced the electrodes, connected to previously calibrated pH-meter and we added hydrochloric acid solution 1N until the pH was 4.6 ±5, i.e. pH 4.44 at 20.2 °C. We raised, rinsed and removed the electrodes. We added 0.4ml of the PAN indicator solution. We heated to about 60 °C and we titrated with the copper (II) sulfate solution 0.01N until the indicator changed from yellow to wine-red. The wine-red color persisted for at least 1min. The volume of the copper(II) sulfate solution 0.01N used=0.3ml. Yield: 0.0086%w/w EDTA The chelated agent content in percent is calculated as: [(volume V in ml of CuSO4 0.01N *0,01N*292g/mol*100)/(1000*10.1544g)].
Results and Discussion
Determination of pH
We measured the pH of the detergent solution as it is to be pH 8.6 at 22.0 °C in the Metrohm 716 DMS Titrino pH-meter. We prepared a 1%w/w solution of the detergent solution in deionized water and we measured pH 6.5 at a temperature of 22.4 °C in the Metrohm 716 DMS Titrino pH-meter. We then prepared a 10%w/w solution of the detergent solution and we measured pH 7.2 at a temperature of 22.1 °C in the Metrohm 716 DMS Titrino pH-meter. We measured the pH of the buffer solution pH7 as it is to be pH 7.02 at 22.4 °C in the Metrohm 716 DMS Titrino pH-meter.
Acquisition of IR-spectra: Infrared transmittance data
The infrared spectra were recorded in the solid state. The material of the ATR [3] crystal was diamond. The symmetric S=O stretching frequency of sulfonic acids appears at 1196cm-1 (Figure 1). The vibrations at 1196cm-1 and 1064cm-1 are attributed to the OSO3- asymmetric and symmetric stretching vibration of the sulfonate group [5]. Also, for the non-ionic surfactant i.e. alcohols C12-14 ethoxylated sulfates sodium salts the vibration might better be described as an asymmetric C-C-O stretching vibration at 1101cm-1. Also, for the alcohol type saturated secondary or a-unsaturated or cyclic tert there is the absorption at 1132cm-1. Also C=O stretching with internal hydrogen bonding appears at 1669cm-1 to 1630cm-1 due to asymmetric stretching of the carboxyl group [6]. This stretching vibration is due to the presence of C=O groups in Erioglaucine disodium salt or Blue 1, in Tartrazine chilli orange or Hydrazine yellow, which are colorings, and in tetrasodium ethylenediaminetetraacetate dehydrate, which is a chelating agent, present in the composition of the car cleaner product. The two bands arising from C-O stretching and O-H bending appear in the spectra of the carboxylic acids near 1320-1210cm-1 and near 1440-1395cm-1. Both of these bands involve some interaction between C-O stretching and in-plane C-O-H bending. The intense band at 1315-1284cm-1 in the above spectrum is for dimers and is generally referred to as the C-O stretching band and appears here as a doublet. The C-O-H bending band at 1408-1392cm-1 occurs in the same region as the CH2 scissoring vibration of the CH2 group adjacent to the carbonyl.
Figure 1: FT-IR spectrum of the window car cleaning product, as it is showing the absorption of the anionic surfactant 2-Ethyl-hexyl sodium sulfonate, and the nonionic surfactant alcohols C12-14 ethoxylated sulfates sodium salts, and soap, as well as ethylene diamine tetracedic tetrasodium (EDTA), FDC Blue colorant, FDC Yellow colorant.

Also, in the above-mentioned conjugated systems without a center of symmetry, the olefinic double bond stretching vibrations show absorption at 1630cm-1 and at 1602cm-1 thus interacting to produce two C=C stretching bands. Here we have conjugation of olefinic double bonds with aromatic rings. At 1488cm-1 and 1462cm-1 appears aromatic (-C=C) ring stretch absorption overlapped by CH2 scissoring. The carboxylate anion shows two strongly coupled carbon to oxygen bonds with bond strengths intermediate between C=O and C-O. The carboxylate ion present gives rise to two bands. A strong asymmetrical stretching band near 1630cm-1 to 1566cm-1. Also, it shows a weaker symmetrical stretching band near 1400cm-1, which in the above spectrum appears at 1408cm-1. Thus, at 1392cm-1 appears a C-O-H bending absorption band. The band at 1315-1284cm-1 for dimers is referred to in general as the C-O stretching band and usually appears as a doublet in the spectra of long chain fatty acids. The band at 1132cm-1 is attributed to the axial deformation of C-O of primary alcohols. At 943cm-1 appears the O-H out of plane bend. Also, at 804cm-1 and at 744cm-1 appears the out of plane C-H band. Generally, in the region from 2000cm-1 to 1667cm-1 appear overtone or combination bands for alcohols-phenols.
In Table 1 the maximum of the S=O stretching vibration of the anionic surfactant 2-Ethyl-hexyl sodium sulfonate is presented. In Table 2 the C-O stretching vibration in the alcohols C12-14 ethoxylated sulfates sodium salts, is presented.
\Table 1: Sample analyzed and its wavenumber of maximum SO3 absorbance

Table 2: Sample of cleaning product containing non-ionic surfactant and its wavenumber of maximum C-O stretch vibration in alcohol absorbance

UV spectrum of the cleaner product - Calculation of Kubelka-Munk k/s values for the cleaner product (absorption coefficient/scattering coefficient ratio)
The k/s ratio [7] for the cleaning product was found k/s=1,7974 and the reflectance ISO brightness used was measured 5.41%.The ISO brightness measured is the numerical value of the reflectance of the cleaner solution at 457nm, blue light reflectance. In this work the Kubelka-Munk theory is used for predicting optical properties for the cleaner product. The appearance of its solution is the result of its optical properties. As known the Kubelka-Munk theory is based on the assumption that the interaction between the diffuse light and the cleaner material can be described in terms of two fundamental optical constants. The specific scattering coefficient (s) and the specific absorption coefficient (k). Although the Kubelka-Munk theory holds strictly for homogeneous materials only, it works also for cleaner solution containing more than one substances. The equation of Kubelka-Munk used above is: k/s=(1-R͚)2/2R͚ where k is the absorption or coefficient of reflectivity and s is the coefficient of light scattering; R is the observed reflectivity for monochromatic light. The simplified equation F(R͚)=(1-R͚2)/2R͚=k/s is used in order to relate the chromophore concentration present to the intensity of the sample’s diffuse reflection. The chromophores present in this study are the carbonyl (C=O) and the conjugated pi-system.
Table 3: Substrate details.

In Table 3 properties of the window car cleaner product are summarized. From the k/s ratio calculated above we can assume that light absorption is high in the window car cleaner product than in other detergent products previously tested, indicating the presence of more colored matter other than surfactants and soap which is converted to heat thereby reducing the brightness of the window car cleaner product.
CIE L*a*b* values for the cleaner product analyzed
The color of the window car cleaner in the CIE L*a*b* system for illuminant C/2 [8] is L*=28.52, a*=-1.11 and b*=1.20. L is the measure of lightness and varies from 100 for a perfect white to 0 for the absolute black. Here -a indicates the greenness of the cleaner solution and +b indicates its yellowness. Here the color measured indicates the presence of a nearly blue solution. The opacity calculated for the cleaner solution is 21.09% and the transparency is 88.80% (Table 4). With the use of this color system the magnitude and direction of color difference between the sample and the standard was determined and understood. The Delta E value is overall color difference value which takes into account lightness/darkness differences as well as chromatic differences.
Table 4: CIE L*a*b* values for the cleaner product analyzed and the calibration standard are presented.

Analysis of UV-visible absorption edge energy in the car cleaner product
Chromophores [9] are present in the car cleaner product which consists of chromophores of carbonyl (C=O) and conjugated pi-system. The kinetic energy of the electron photoemitted from the surface of the cleaner product solution is related to the work function (Φ) and v by
The work function Φ is calculated in this work from the intercept of a plot of E against v for the whole range of wavelengths 400-700nm, and the slope is equal to h=7x10-34J.s, which is Planck’s constant.
Φ=(3.0995eV)[(1.602x10⁻¹⁹J)/(1eV)]=49.6602x10-20J or intercept 4.96602x10⁻¹⁹ J
Substituting the data into (1) gives E=hv-Φ=(6.626x10⁻³⁴J.s) (7.53241206x10¹⁴s-1)-Φ=49.90976231x10⁻²⁰J-Φ=49.90976231x10⁻²⁰J-4.96602x10⁻¹⁹J=0.24956231x10⁻²⁰J
where λ=398nm is the effective wavelength, the wavelength of the incident light.
Then the velocity υ of the electron photoemitted from the surface of the cleaner is then υ
υ={[2*(0.24956231x10-20J)(1kg.m2.s-2)/(1J)]/[9.11x10-31Kg]}1/2=(0.54788652x1010)1/2(m2.s-2)1/2=0.7401x105m/s
Apparently, as absorption edge energy decreases, domains in the cleaner’s solution accept electrons with greater ease. This electron is placed in unoccupied molecular orbitals available at lower energies [10]. The Kubelka–Munk function F(R͚) for infinitely thick samples was used here to convert reflectance measurements (Rsample) into the equivalent absorption spectra.
The optical absorption edge energy of the cleaner solution (which may contain crystalline and amorphous species) was obtained from diffuse reflectance UV-vis absorption spectra. The optical absorption edge energy is defined as the minimum photon energy required to excite an electron from the highest occupied molecular orbital (HOMO), at the top of the valence band in semiconductor domains to the lowest unoccupied molecular orbital LUMO, at the bottom of the conduction band. There are two basic types of electronic transitions, direct and indirect. Direct transitions require only that photons excite electrons, while indirect transitions also require concerted vibrations and energy from the crystal lattice (phonons). The energy dependence of the absorption coefficient (k) for semiconductors in the region near the absorption edge is given by
where hv is the energy of the incident photon and Eo is the optical absorption edge energy; the exponent n depends on the type of optical transition caused by photon absorption. In crystalline semiconductors, where crystal momentum is conserved and electron transitions obey well defined selection rules, n is 1/2, 3/2, 2 and 3 when the transitions are direct-allowed, direct-forbidden, indirect-allowed, and indirect-forbidden, respectively. In general, transitions that are forbidden by symmetry selection rules have a lower probability of occurring [Pi~(hv-Eo)] and transitions that require phonons have an additional (hv-Eo)3/2 factor that arises from the dependence of the absorption coefficient on phonon energy.
Figure 2: Reflectance graph for the window car cleaning product in water, also containing 4%v/v isopropyl alcohol and 6%v/v 1-methoxy-2-propanol, in 10% range.

In amorphous homogeneous semiconductors the value of n is 2 irrespective of the type of transition found in crystalline materials of the same composition. The momentum vector is not conserved in amorphous materials. Then an integration has to be performed over the density of states, resulting in an energy dependence similar to that for indirect transitions [11]. Previous studies UV-vis reflectance data [12] have shown that the fundamental absorption edge of detergent products is caused by indirect-allowed electron transitions. Therefore, a value of n=2 was used in this study in order to define the absorption edge for the window car cleaner sample containing crystalline or amorphous species in domain structure (Figure 2-4).
Figure 3: Reflectance graph for the window car cleaning product in water, also containing 4%v/v isopropyl alcohol and 6%v/v 1-methoxy-2-propanol also, in 100% range.

Figure 4: (k/s hv )^2 versus hv graph of the chromophores i.e C=O [13] and conjugated pi-system, in the window car cleaner product water solution containing also 4%v/v isopropyl alcohol and 6%v/v 1-methoxy-2-propanol.

Estimation of the band gap energy Eg from the DRS studies of the car cleaner product: A graph is plotted of (k/s hv)2 versus hv. The extrapolation of straight line to (k/s hv)2=0 axis (Tauc Plot) gives the value of the band gap energy (Eg). The estimation of the band gap energy is performed from a DRS (Diffuse reflectance spectra) study. The band gap energy (Eg) [13,14] of the chromophores present in the cleaner product in aqueous solution is estimated as 1.1698eV. The band gap energy was calculated from the function trend in the excel spreadsheet with data calculated for the whole range of wavelengths 400-700nm [15,16]. Also, the optical energy gap (Ego=1.1698eV) is higher than the electrochemical energy gap (Ege=0.63939eV) calculated from the pH studies performed for the car cleaner product. Their difference is of approximately 0.53eV. When we measure here the gap optically, we do excitation spectroscopy. Thus, the minimum frequency of light that will dislodge the electron from the cleaner’s solution is calculated as v=7.495x10¹⁴s-1. The maximum wavelength of light that will then dislodge the electron is then approximately 400nm respectively.
Conclusion
In this study the FTIR method [17] and the Reflectance graph were proved sensitive for detecting and monitoring a finished product containing of an anionic surfactant, a non-ionic surfactant and a soap and other agents present. Presently, we are investigating the use of both technics for a more wide variety of detergents, and cleaner finished products.
References
- Pranowo HD, Mulya F, Aziz HA, Santoso GA (2018) Study of substituent effect on properties of platinum (II) porphyrin semiconductor using density functional theory. Indones J of Chem 18(4).
- Altinolcek N, Battal A, Tavasli M, Peveler WJ, Yu HA, et al. (2020) Synthesis of novel multifunctional carbazole-based molecules and their thermal, electrochemical and optical properties. Beilstein J Org Chem 16: 1066-1074.
- Kukol A (2005) Site-specific IR spectroscopy and molecular modelling combined towards solving transmembrane protein structure. Spectroscopy 19: 1-16.
- Anokhina TS, Yushkin AA, Volkov VV, Antonov SV, Volkov AV (2015) Cellulose-based membranes for solutes fractionation. Physics Procedia 72: 171-174.
- Babakhani S, Talib ZA, Hussein MZ, Ali Ahmed AA (2014) Optical and thermal properties of Zn/Al-layered double hydroxide nanocomposite intercalated with sodium dodecyl sulfate. J Spectroscopy, pp.1-10.
- Tan TL, Lai CW, Abd Hamid SB (2014) Tunable band gap energy of Mn-Doped ZnO nanoparticles using the coprecipitation technique. J Nanomaterials 2014: 1-6.
- Shahin A, Bachir W, El Daher MS (2019) Polystyrene microsphere optical properties by Kubelka-Munk and diffusion approximation with a single integrating sphere system: A comparative study. J Spectroscopy 2019: 1-8.
- Wu G, Qian L, Hu G, Li X (2019) Spectral reflectance recovery from tristimulus values under multi-illuminants. J Spectroscopy 2019: 1-9.
- Li D, Wang X, Han C (2016) Study on the fluorescence spectra characteristics of vinegar-water solutions. J Spectroscopy 2016: 1-6.
- Barton DG, Shtein M, Wilson RD, Soled SL, Iglesia E (1999) Structure and electronic properties of solid acids based on tungsten oxide. J Phys Chem B 103(4): 630-640.
- Troyan VI, Borisyuk PV, Lebedinskii YY, Vasiliev OS (2015) Formation of thorium-disodium fluoride crystals by electron-beam evaporation. Physics Procedia 72: 175-178.
- Ma F, Tang J, Yang C, Feng YY, Wei SH, et al, (2011) DNA binding and photo-induced DNA cleavage activity of Elsinochrome A in visible light. Spectroscopy 26: 289-296.
- Maisonneuve S, Metivier R, Yu P, Nakatani K, Xie J (2014) Multi-chromophoric sugar for fluorescence photoswitching. Beilstein J Org Chem 10: 1471-1481.
- Li P, Abe H, Ye J (2014) Band gap engineering of NaNbO3 for photocatalytic H2 evolution with visible light. Int J Photoenergy, pp. 1-6.
- Morales AE, Ruiz Lopez II, Ruiz Peralta MD, Carrillo LT, Cantu MA, et al. (2019) Automated method for the determination of the band gap energy of pure and mixed powder samples using diffuse reflectance spectroscopy. Heliyon 5(4): 1-19.
- Abdullahi SS, Güner S, Koseoglu Y, Musa IM, Adamu BI, et al. (2016) Simple method for the determination of band gap of nano-powdered sample using Kubelka Munk theory. J Nig Assoc of Mathem Physics 35: 241-246.
- Latxague CL, Melin AM (2005) Radical induced damage of micrococcus luteus bacteria monitored using FT-IR spectroscopy. J Spectroscopy 19: 17-26.
© 2020 Chryssou K. This is an open access article distributed under the terms of the Creative Commons Attribution License , which permits unrestricted use, distribution, and build upon your work non-commercially.
Editor In Chief


.jpg)


Signup for Newsletter

Quick Links
 Editorial Board Registrations
 Submit your Article
 Refer a Friend
 Advertise With Us
Our Recent Edition

.jpg)


Top Editors


.jpg)


.bmp)
.jpg)
.png)
.jpg)


.jpg)


.png)

.png)


.png)


Financial Support

Sponsors

Latest e-Books

Latest Video

 a Creative Commons Attribution 4.0 International License. Based on a work at www.crimsonpublishers.com.
Best viewed in
a Creative Commons Attribution 4.0 International License. Based on a work at www.crimsonpublishers.com.
Best viewed in