- Submissions

Full Text
Annals of Chemical Science Research
A Preliminary Assessment of Hydrogeochemical Quality of Groundwater around Rural Communities of Abandon Nkalagu Limestone Quarry. SE Nigeria
Eyankware MO* and Effam SC
Department of Geology, Faculty of Science, Ebonyi State University, Nigeria
*Corresponding author: Eyankware MO, Department of Geology, Faculty of Science, Ebonyi State University, Nigeria
Submission: November 19, 2019Published: December 06, 2019

Volume1 Issue5December, 2019
Abstract
within the study area. Twenty-seven (27) groundwater samples were collected for major cations and anions were analysis. From the results obtained, it was observed that pH value fell within the slightly acidic to basic, values obtained from total dissolved solid showed that twenty six (26) groundwater samples fell within fresh water category, while one (1) groundwater sample fell within brackish water category, electrical conductivity ranges from 16.21 to 1136μS/cm. The study revealed that ion exchange and rock weathering are the major geochemical processes that influence groundwater chemistry within the study area. Parson plot revealed that groundwater samples are of different water type; Na-SO4, Na-Cl, Ca-Mg- SO4 and Ca-Mg-Cl water type. Relationship between Na+/Cl¯ versus Ca2+/ (HCO3¯ + SO42¯) showed that groundwater was classified under natural state. TDS versus TH plots revealed that groundwater within study area falls within soft-fresh water category, except sample NA-18. Finally, deduction from Soltan classification revealed that sample locations; NA-01, 02, 03, 04, 06, 07, 08, 10, 11, 12, 13, 15, 16, 17, 19, 21, 22, 23, 24 and 27 were classified under deep meteoric water type, while NA-05, 09, 14, 18, 20, 25 and 26 were classified shallow meteoric water type.
Keywords: Ion-Exchange; Weathering; Water type; Lower benue trough and Nigeria
Introduction
The demand for water is currently on the increasing due to both population growth and climate change [1]. Due to these factors, there is a positive trend toward the use of groundwater as the main water source for domestic and other use [2-5]. Various factors such anthropogenic and geogenic can be attributed to groundwater contamination in urban and rural area Eyankware et al. [4] & Grützmacher et al. [6]. The geochemical constituent of groundwater is considered very important in determining its suitability for various uses. Hydrogeochemical processes that are responsible for altering the chemical composition of groundwater vary with respect to space and time [4]. The chemical quality of groundwater depends on various degree of chemical weathering of various rock type, geology, quality of recharge and inputs from sources other than water-rock interaction [4]. Omo-Irabor et al. [5] further stated that hydrogeochemical processes of the groundwater system help to obtain an insight into the contributions of rocks/soil-water interaction and anthropogenic influences on groundwater. These geochemical processes are responsible for the spatiotemporal variations in groundwater chemistry [7-9]. The study area is located in Ebonyi state, southeastern Nigeria, it is known for its large deposit of limestone [10]. Odukwe [11] stated that the deposit which appears to be one of the largest and most economically viable limestone resource bases of the country was found within the Turonian-Eze Aku Formation and contains over 174 million tons of limestone deposit. The presence of this mineral deposit has attracted small- and largescale miners within the area. Exploitation of the mineral is usually by quarrying, and this process has produced many pits that are usually abandoned without acceptable closure and or reclamation. Water from this abandon pit is believed to infiltrate into groundwater thereby contaminating [1,10]. Additionally, groundwater contamination in active or abandon mine areas can be intensified by the leaching of chemical constituents from mine tailings Nyirenda et al. [12]. On the other hand, mining can cause toxic chemical constituents to be leached from mine waste and host-rocks into mine water to cause groundwater contamination. Hence there is an urgent need to evaluate and characterize groundwater quality within the area.
The Study Area
Location, climate, geology and hydrogeology
Figure 1:Topographic map of the study area. Source: Eyankware et al. [10].
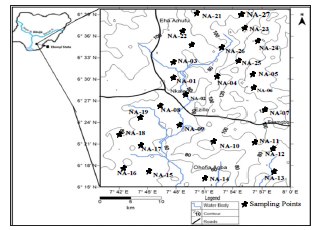
The study area is located in the Sub urban area of Abakaliki, Ebonyi state, southeastern Nigeria. It lies between latitudes 6°15′ and 6°35′N and longitudes 7°39′ and 8°00′E. The area is quite accessible through a network of major roads and footpaths as shown in Figure 1.
Vegetation and climate
The study area belongs to the rainforest region of Nigeria as described by Igbozuruike [13]. The vegetation is characterized by orchard bush of short trees with varying densities of dominant elephant grasses. Two major seasons are experienced in the areathe wet and dry season. The wet season starts from March and ends in October, while the dry season begins in November and ends in February. These two seasons are dependent on the two prevailing winds blowing across the country at different times of the year-the dry harmattan Wind, the North East Trade Wind from the Sahara Desert that prevails in the dry season and the marine wind, the SW Trade Wind, from the Atlantic Ocean which introduces the rainy season. Temperature in the dry season and rainy season ranges from 20 to 38 °C and 16 to 28 °C, respectively. The average monthly rainfall ranges from 3.1mm in January and 270mm in July. The average annual rainfall varies from 1750 to 2250mm. The climate of the area, no doubt, favors the dispersion of the resultant pollutants from the mining activities. Eyankware et al. [10] stated that high amount of rainfall results in surface run-of that moves the pollutants and also assists percolation. The drainage pattern of the area is dendritic.
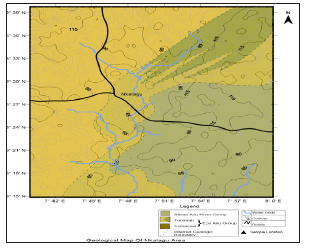
Figure 2:Geology map of the study area showing groundwater sampling points source: Eyankware et al. [10].
Geology and hydrogeology of the study area
The Benue Trough is a linear NE–SW trending trough that is divided into three parts, namely the Upper, Middle and Lower parts [14,15]. Sedimentation in the Abakaliki Basin of the Lower Benue Trough started with deposition from the Asu River Group of Upper Albian age which overlies the Precambrian Basement Complex rocks dis-conformably as shown in Table 1. The Asu river group consists of Abakaliki Shale with volcano clastics, sandstone and sandy limestone lenses [16]. The Asu River Group is overlain by the Eze-Aku Formation of Turonian age. This formation consists of flaggy, grey or black shales with sandstones and subordinate limestone [17]. An alternating sequence of thick limestone or sandstone units occurs with calcareous shales in places where the Eze-Aku Formation is found [18]. The hydrogeology of the study area is typified by poor aquifer conditions. This is a result of the dominant shale units (Aquiclude) which are neither porous nor permeable and do not transmit water to wells found in the area. Eyankware et al. [10] further pointed out that groundwater on a regional scale is impossible to find. However, conditions for the presence of groundwater may occur at weathered/fractured zones or at points of sandstone intercalations. The structure and hydrogeology of the fractured aquifer in the study area are typical of a multilayer complex system. The water bearing formation within the study area exists in fractured shale and limestone [19]. The major sources of water are stream, hand-dug well, manual borehole and motorized borehole (Figure 2).
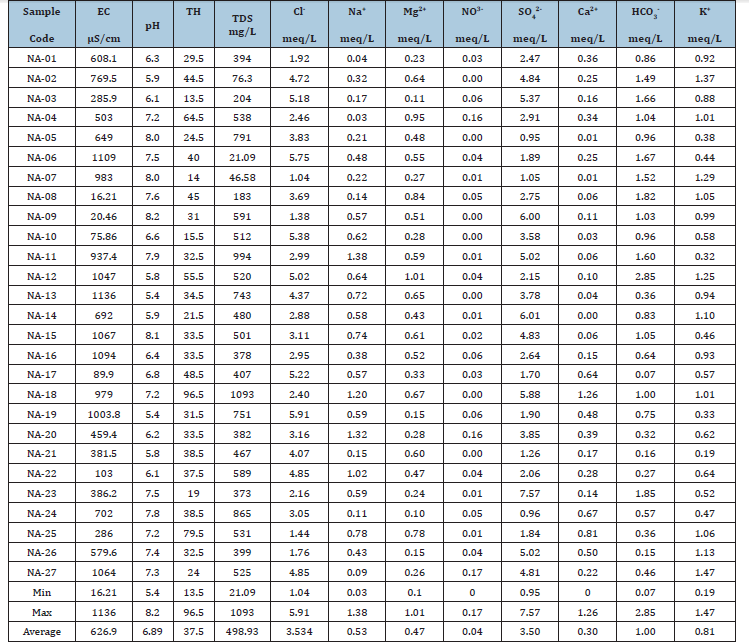
Table 1:Results of physicochemical parameters.
pH
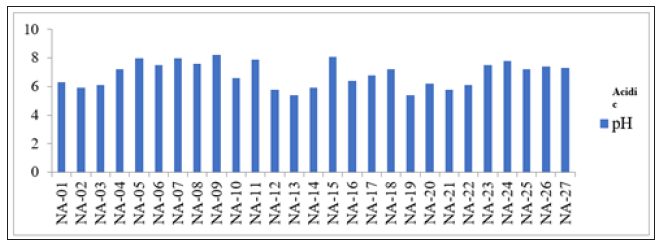
The pH of water is an important parameter which shows the level of acidity or alkalinity of the water body. In other words, it furnishes information on the hydrogen ion concentration of natural water. From the Table 1, the measured pH is found to be slightly acidic to basic and ranges from 6.3 to 7.9 with mean value of 7.15 with an average value of 6.89 as shown in Table 1.
Materials and Methods
Chemical data processes
Twenty-seven groundwater samples were collected from the study area. Chemical analysis was conducted for the major cations Na+ K+ Ca2+, and Mg2+ and major anions Cl¯, SO4 2¯ and HCO3¯, while the pH was measured using a pH meter and the HACH. In addition, electrical conductivity (EC), total dissolved solids (TDS) were chosen for further study. An ion balance equation was applied to validate the accuracy of the chemical analyses, in which ±5% is acceptable [20]. The reaction error for all samples was less than the acceptable limit of ±10% [21,22]. The chemical data for Na+, K+, Ca2+, Mg2+, Cl¯, SO42¯, and HCO3¯are in milli equivalent (meq/L).
Soltan classification
The sources of groundwater have been classified into two types by Soltan [23]. The classifications are based on base-exchange indices (r1) and meteoric genesis indices (r2) as presented in equations 1a and 1b.

Results and Discussion
Total dissolved solid (TDS)
Table 2:Classification of water samples.

Figure 3:pH against sampling points.
The results of geochemical analysis indicated that TDS ranges from 21.09 to 1093mg/L with mean value as 498.93mg/L (Table 1). Table 2 shows that groundwater samples within the study area fell within freshwater category except NA-18 that fall within brackish water type which could be considered to be more salty when compared to fresh water type (Figure 3). Various factors are responsible for diverse value of TDS, these include geological, climatic and human factors [12,23-26].
Electrical conductivity (EC)
The value of EC ranges from 16.21 to 1136μS/cm with average value of 626.9μS/cm (Table 1). The area of high concentration of EC (NA-06, 07, 15, 16 and 19) shows that groundwater is in contact with more dissolved inorganic constituents.
Ion exchange
Factor controlling groundwater chemistry was also evaluated using bivariate diagrams such as Mg against Ca +Mg, Ca + Mg versus HCO3+SO4, Na versus Ca, Cl versus Na, SO4 versus Ca, Mg versus Ca, Na/Cl versus EC as widely used (Figure 4-10) respectively. Jong et al. [27] stated that during the rock weathering the composition of various cation and anion might be changed, and the number of cations is dependent on the rock mineralogy. In most cases, the source rock minerals may be deduced from the groundwater composition. The Mg2+ to Ca2+ ratio approaches one, it is very likely that Ca2+ has been removed from the solution and this process is commonly called dedolomitization. Hounslaw [28] suggest that when Mg2+ is greater than (equal or less than) Ca2+, there are four possibilities such as: 1) Gypsum dissolution (=0.5); 2) Limestone-dolomite weathering (<0.5); 3) Dolomite dissolution, calcite precipitation. In Figure 4, we can understand that there are all possibilities as mentioned above during the weathering and dissolution processes. The scatter diagram of Ca+Mg vs HCO3+SO4 (Figure 5) shows that samples are equiline 1:1, indicating that silicate and carbonate weathering are the primary process involved in the evolution of groundwater [29]. The Na vs Ca plot indicates that most of the samples lie slightly below the equiline (Figure 6). The excess of Na is attributed to carbonate weathering. Na versus Cl can be used to identify the evaporation process in groundwater [29]. Evaporation will increase the concentration of TDS in groundwater, and Na/Cl ratio remains same, and it is one of the major indicators of evaporation. Chebbah [30] further stated that if evaporation is the dominant process Na versus Cl against EC would give a horizontal line, this could be attributed to the fact that evaporation and evapotranspiration is an effective indicator (Figure 7). In the plot for Na/Cl vs. EC Figure 8 the Na/Cl shows a decreasing trend with increasing EC along with higher Na/Cl ratio, it reveals that Na released from silicate weathering process. Morever, in SO4 versus Ca it was observed that distrubution of the samplesare in equiline 1:1. This shows that carbonate and silicateweathering are the major process that influences geochemical constiutent of groundwater within the study area (Figure 9). This is inline with Eyankware et al. [4] which stated that weathering has major influence on geochemistry of groundwater within the asu river group of lower benue trough nigeria.
Figure 4:Plot of Mg versus Ca+Mg (meq/L).
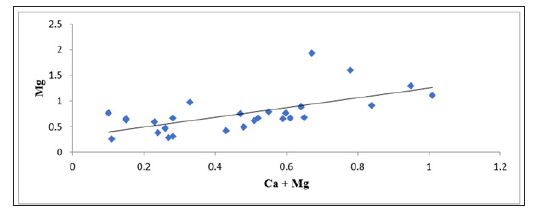
Figure 5:Plot of Ca + Mg versus HCO3 + SO4 (meq/L).
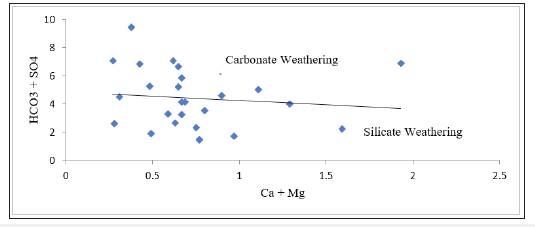
Figure 6:Plot of Na versus Ca(meq/L).

Figure 7:Plot of Cl versus Na (meq/L).
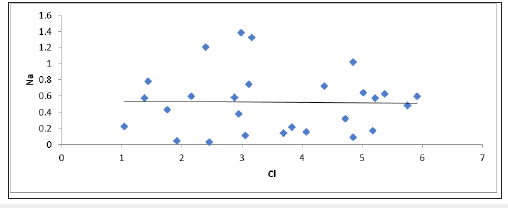
Figure 8:Plot Na/Cl ratio versus EC.
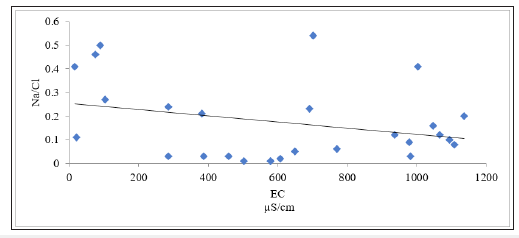
Figure 9:Plot of SO4 versus Ca(meq/L).

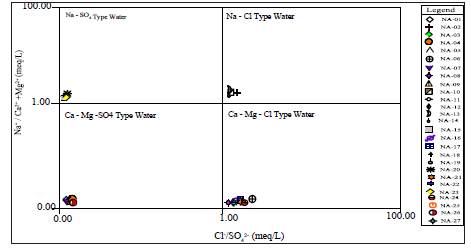
Figure 10:Parson’s plot modified of the study area showing ground water origin.
Hydrogeochemical classification
From Figure 10 it was observed that groundwater sampling points were categorized into four water type: Na-SO4, Na-Cl, Ca-Mg- SO4 and Ca-Mg-Cl water type. Sample locations NA-11, 15, 20 and 23 are classified as Na-SO4 water type, NA-10, 13, 14 and 22 were classified as Na-Cl water type, NA- 01, 02, 03, 04, 07, 09, 18 and 26 were classified as Ca-Mg-SO4 lastly NA-05, 06, 08, 12, 16, 17, 19, 21, 24 and 27are classified as Ca-Mg-Cl water type. This infers that
groundwater is of different origin.
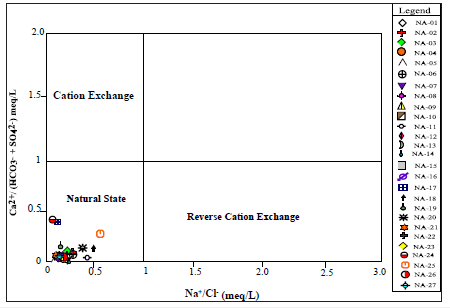
Figure 11 shows the relationship between Ca2+/ (HCO3¯ + SO4 2¯) versus Na+/Cl¯. The distribution of samples indicates sampling points were categorize under natural state, that implies that natural salt dissolution such as carbonates and silicate weathering is the main processes controlling groundwater composition in the study area.
Figure 11:Showing the effect of cation exchange, reverse cation exchange, natural state, carbonate rock dissolution and silicate hydrolysis on groundwater composition.
The plot of TDS versus TH revealed that groundwater sample points within the study area fell within soft-fresh water category, except sample NA-18 that fell within soft-brackish water. Reasons for soft-fresh water could be attributed to low concentrations of Ca2+ and Mg2+ (Figure 12). Sample NA-18 is believed to be saltier compared other sampling points.
Figure 12:Plot of TDS against TH (mg/L).

Soltan classification
Soltan [23] classified groundwater into two types, which are base-exchange indices (r1) and meteoric genesis indices (r2) as shown in equations 1a and 1b, where Na+, K+, Cl¯ and SO42¯ concentrations are expressed in meq/L (Table 1). If r1<1 and r2<1, the groundwater sources are of Na+-SO42¯ and deep meteoric type, respectively, while r1>1 and r2>1 indicates the sources are of Na+- HCO3¯ and shallow meteoric type. From Table 2, it was observed that samples NA-01, 02, 03, 04, 06, 07, 08, 10, 11, 12, 13, 15, 16, 17, 19, 21, 22, 23, 24 and 27 were classified as deep meteoric water type, while samples NA-05, 09, 14, 18, 20, 25 and 26 were classified as shallow meteoric water type (Table 3).
Table 3:Results of groundwater sampling points modifies after [23]. DMT is Deep Meteoric Type and SMT is Shallow Meteoric Type

Conclusion
This study incorporates the governing processes that influence groundwater chemistry. Results revealed that pH fell within slightly acidic to basic, TDS values showed sampled points were classified under fresh water except for NA-18 that falls within brackish water. Ion exchange deductions revealed that dissolution, rock weathering, ion exchange were the major factors that influences hydrogeochemical process of groundwater within the study area. The mechanism of these actions and diverse mineralization processes as well as their combination had given rise to the salinity of groundwater within the area of study. Parson Plot further revealed that groundwater is of different origin. Relationship between Na+/Cl¯ versus Ca2+/ (HCO3¯+SO42¯) showed that groundwater within natural state. Plot of TDS against TH revealed that 99.9% groundwater within the study area fell with soft-fresh water category. Soltan classification showed that larger percentage of groundwater within the study area were classified within deep meteoric water type.
References
- Eyankware MO, Nnabo PN, Omo Irabor OO, Selemo OI (2016) Assessment of the effect of anthropogenic activities on hydrogeochemical quality of water resources of EkaeruInyimagu and its environs, Southeastern. Sky J Soil Sci Environ Manag Nigeria 5(5): 33-43.
- Ede CO, Nnabo PN (2015) Hydrogeochemical evaluation of groundwater quality of Abakaliki and its environs, southeastern Nigeria. Int J Innov Sci Res 13(2): 689-696.
- Ojobor JR, Nnabo PN (2015) Levels of heavy metals on groundwater in Abakaliki and its environs, southeastern Nigeria. Int J Innovation Sci Res 12(2): 444-452.
- Eyankware MO, Ogwah C, Okeke GC (2018a) Geochemical evaluation of groundwater origin using source rock deduction and hydro chemical facies at umuoghara mining area, lower benue trough, SE Nigeria. Int Res J of Earth Sci 6(10): 1-11.
- OmoIrabor OO, Eyankware MO, Ogwah C (2018) Integration of hydrogeochemical analytical methods and irrigation parameters in determination of groundwater quality at Ibinta, Southern Benue trough Nigeria. FUPRE J of Sci and Ind Res 2(1): 38-49.
- Grützmacher GP, Kumar JS, Rustler M, Hannappel S, Sauer U (2013) Geogenic groundwater contamination-definition, occurrence and relevance for drinking water production. Zbl Geol Paläont Teil I Jg Heft 1: 69-75.
- Matthess G (1982) The properties of groundwater. Wiley, New York, USA, p. 498.
- Kumar MAL, Ramanathan M, Rao S, Kumar B (2006) Identification and evaluation of hydrogeochemical processes in the groundwater environmental of Delhi, India. J Environ Geol 50(7): 1025-1039.
- Swama Latha P, Nagaeswara Rao K (2011) An Integrated approach to assess the quality of groundwater in a coastal aquifer of Andhra Pradesh India. Earth Sci 66(8): 2143-2169.
- Eyankware MO, Nnajieze VS, Aleke CG (2018b) Geochemical assessment of water quality for irrigation purpose, in abandoned limestone quarry pit at Nkalagu area, Southern Benue trough Environ Earth Science 77: 66.
- Odukwe GC (1980) Industrial minerals of Nigeria. In: Proceedings 4th Industrial Minerals International Congress Atlanta, London, UK, pp. 103-108.
- Nyirenda TM, Zhou J, Mapoma HWT (2016) Hydrogeochemical characteristics of groundwater at the Xikuangshan antimony mine in South China. Mine Water Environ 35(1): 86-93.
- Igbozuruike MU (1975) Vegetation types. In: Oformata GEK (Ed.), Nigeria in maps, eastern state. Ethiope Publ Benin, pp. 30-31.
- Petters SW (1982) Central West African Cretaceous-Tertiary benthic foramnifera and stratigraphy. Paleogeographica 179: 1-104.
- Petters S W (1991) Regional geology of Africa. In: Lecture notes in earth sciences series, Springer, Berlin, Germany, p. 40.
- Benkheil J (1989) The origin and evolution of the Cretaceous Benue trough, Nigeria. J Afr Earth Sci 8: 251-282.
- Reyment RA (1965) Aspects of geology of Nigeria. Ibadan Univ Press, Ibadan, Nigeria, p. 145.
- Ikhane PR, Folorunso AF, Nton ME, Oluwalaanu JE (2009) Evaluations of turonian limestone formation exposed at NIGERCEM quarry, Nkalagu, Southeastern Nigeria: A geochemical approach. Pac J Sci Technol 10(2): 763-771.
- Nwachukwu SO (1972) Tectonic evolution of the southern portion of the Benue trough, Nigeria. Geol Mag 109: 411-419.
- Saether OM, De Caritat P (1997) Geochemical processes, weathering and ground water recharge in catchments. Balkema, Rotterdam, The Netherlands, p. 400.
- Hem JD (1991) Study and interpretation of the chemical characteristics of natural water: USGS professional paper book 2254. Scientific Publishers, Jodhpur, India.
- Soltan ME (1999) Evaluation of groundwater quality in Dakhla Oasis (Egyptian Western Desert). Enviro Monitoring Assess 57(2): 157-168.
- Marandi AM, Polikarpusand A, Jõeleht (2013) A new approach for describing the relationship between electrical conductivity and major anion concentration in natural waters. Appl Geochemistry 38: 103-109.
- Freeze RA, Cherry JA (1979) Groundwater Prentice Hall, Englewood Cliffs, New Jersey, USA.
- Appelo CAJ, Postma D (2005) Geochemistry, groundwater and pollution (Amsterdam: CRC Press, Taylor & Francais Group), USA.
- Rusydi AF, Nailyand W, Lestiana H (2015) Pencemaran limbah domestik dan pertanian terhadap airtanah bebas di kabupaten Bandung. J Ris Geol dan Pertamb 25: 87-97.
- Hwang JH, Sunhwa P, Kim HK, Moon SK, Je Jo H, et al. (2017) Hydrochemistry for the assessment of groundwater quality in Korea. J of Agric Chem and Environ 6(1): 1-29.
- Hounslaw W (1995) Water quality data: Analysis and interpretation. CRC Press, Boca Raton, USA, p. 416.
- Datta PS, Tyagi SK (1996) Major ion chemistry of groundwater in Delhi area: Chemical weathering processes and groundwater flow regime. J Geol Soc India 47(2): 179-188.
- Chebbah M, Allia Z (2015) Geochemistry and hydrogeochemical process of groundwater in the Souf Valley of Low Septentrional Sahara, Algeria. Afr J of Environ Sci and Tech 9(3): 261-273.
© 2019 Eyankware MO. This is an open access article distributed under the terms of the Creative Commons Attribution License , which permits unrestricted use, distribution, and build upon your work non-commercially.
 a Creative Commons Attribution 4.0 International License. Based on a work at www.crimsonpublishers.com.
Best viewed in


.jpg)


 Editorial Board Registrations
 Submit your Article
 Refer a Friend
 Advertise With Us
.jpg)


.jpg)


.bmp)
.jpg)
.png)
.jpg)


.jpg)


.png)

.png)


.png)


