
- About Us
- Information
-

The Author ensures that the research has been conducted responsibly and ethically with adherence to all relevant regulations. read more..
- For Authors
- For Reviewer
- Manuscript Guidelines
- Membership
- Publication Ethics
-
- Journals
- Reprints
- e-Books
- Videos
- Policies
- Contact Us
 COVID-19
- Submissions


Full Text
Advancements in Civil Engineering & Technology
Connected Hazard Detection System to Improve Workers’ Safety at Highway Work Zones
Roofigari Esfahan Nazila*
Myers-Lawson School of Construction, Virginia Tech, USA
*Corresponding author:Roofigari Esfahan Nazila, Myers-Lawson School of Construction, Virginia Tech, USA
Submission: January 08, 2024;Published: May 03, 2024

ISSN: 2639-0574 Volume6 Issue2
Abstract
Highway construction workers are at an elevated risk of hazards related to unsafe proximities. This research aims to develop a holistic solution to mitigate these risks and reduce struck-by accidents in highway work zones. A hazard detection and prevention system based on Ultra-Wide-Band (UWB) sensors is developed that detect potential unsafe proximities among various actors in work zones: workers, construction equipment, and connected vehicles, as representatives of passing traffic. The system considers various factors affecting worker safety, such as variant threat zones, distance from the work zone boundary, road geometry, and movement direction and pattern. The system also provides real-time warnings and instructions to connected vehicles when unsafe proximities/imminent threats are detected. Further, the system visualizes trajectories and the safety status of actors in real-time, contributing to safety awareness. Following testing across multiple scenarios on Virginia’s Smart Roads, the system has shown its ability to accurately detect potential threats, underscoring its potential to significantly enhance safety and reduce collision risk in highway work zones.
Keywords:Highway construction; Hazard detection; Connected vehicles; IoT; Proximity hazards; Work zone safety
Introduction
Background
Occupational environments in highway work zones usually involve close proximity to heavy construction equipment and high-velocity traffic, which exposes construction workers to an elevated risk of being involved in struck-by accidents. Data spanning the years 1982 to 2020 reveal a disconcerting total of 29,493 fatalities (averaging approximately 776 per year) associated with work zone collisions [1]. In response to this pressing issue, the National Institute for Occupational Safety and Health (NIOSH) published a safety guideline in 2001, aimed at mitigating safety risks inherent in highway construction and maintenance operations [2]. These guidelines obligated employers to establish safety measures, most of which pertained to site safety management. As a result, work zone fatalities experienced a downward trend until 2011. However, fatality statistics suggest that these management strategies alone are not adequate to substantially reduce the high risk encountered at highway work zones [3]. An alarming upward trajectory in work zone fatalities was observed from 2013 to 2021. This period of increment resulted in a surge of 61 percent in fatal accidents from 2013 to 2021 [4]. It is significant to note that, despite a substantial reduction of 39.8% in travel across all roads and streets in April 2020 compared to the same period in 2019, due to the COVID-19 pandemic [5], there was still an observed increase in work zone fatalities from 2019 to 2020. Additionally, highway accidents have substantial economic implications. For instance, in 2017, the estimated economic cost from 94,000 crashes was $17.5 billion [6], almost 1% of the U.S. Gross Domestic Product (GDP). Consequently, there is an urgent need to reduce the frequency of work zone accidents in the United States.
Various technologies have been deployed to enhance drivers’ safety, addressing a wide array of factors that contribute to fatal highway incidents, including but not limited to, environmental conditions, road conditions, and driver errors [7,8]. However, construction workers are considered more vulnerable in highway work zone incidents. Between 2011 and 2018, 864 deaths associated with highway construction were reported, with construction laborers, heavy and tractor-trailer drivers, first-line supervisors, highway maintenance workers, and construction equipment operators representing 68 percent of the reported fatalities [1]. This pressing needs to improve workers’ safety has encouraged a significant body of research aimed at improving the safety conditions of highway work environments.
Emerging location-sensing technologies such as Global Positioning System (GPS) [9,10], Radio-Frequency Identification (RFID), radiofrequency [11-13], radar [14], Ultra-WideBand (UWB) [15,16] and Bluetooth [17] have been utilized in recent years to detect proximity hazards in work zones, thereby providing warnings to construction workers and equipment operators [18]. Teizer and Cheng applied real-time location tracking and hazard detection approaches to identify static and dynamic hazard zones, aiming at improving site layout design. Their findings underscored the immense potential of automated technologies to significantly enhance construction safety [19]. Park et al. [13] developed a Bluetooth proximity detection and alert system and demonstrated its effectiveness in roadway work zone environments, outperforming RFID and magnetic field proximity systems. Similarly, Chan et al. [20] developed a hazard proximity warning system with GPS, UWB, and IMU sensors to locate workers and record their field of view, enhancing their hazard awareness [20].To rectify inconsistencies in the detection system, a Bluetooth Low Energy (BLE)-based proximity and the alert system was introduced to bolster alert zone detection stability [21]. Moreover, a Robust Construction Safety System (RCSS) was developed to detect workers, issue warnings to equipment operators, and track them via an online user interface [22].
The existing approaches largely concentrate on addressing collisions occurring inside the work zone (between workers and equipment) or outside the work zone (relating to transportation safety). To enhance highway worker safety, it is imperative to consider both internal and external factors causing accidents in the work zones collectively. There is, however, a gap in research in applying technologies to improve work zone safety, considering all actors that can contribute to proximity hazards from inside (workers and equipment) and outside (i.e. passing vehicles) of the work zone at all times. Furthermore, the design of such proximity hazard detection systems must incorporate the unique features of highway work zones, such as road shape, to ensure their effectiveness.
This study aims to provide a holistic solution for reducing ‘struck-by’ accidents in highway work zones. It takes into account all potential actors involved in an accident, including workers-onfoot, construction equipment, and passing traffic (presented as connected vehicles (CVs) in this paper). The pivotal contributions of this research are twofold: Firstly, it provides an automated and proactive hazard detection system functioning as a predictive tool in real-time. Secondly, it offers a comprehensive solution encompassing all actors likely to be involved in highway work zone accidents both inside and outside the work zone. This includes workers-on-foot, construction equipment, CVs, and various work zone conditions. The developed connected hazard detection system for highway work zones collects data from on-site actors and identifies potential proximity hazards in real-time. Upon detecting an unsafety proximity between two or more actors within the work zone, the system automatically provides proactive warnings to those potentially endangered. Real-time actor data are gathered through Ultra-Wideband (UWB) sensors and the On-Board Unit (OBU) of CVs. The real-time safety status and proactive warnings are displayed on the Virginia Connected Corridor (VCC) monitor, a web-based situational awareness tool. The hazard detection algorithm identifies unsafe situations, detects imminent threats, elicits real-time warnings, and transmits warning messages to the VCC monitor and a mobile app for CV drivers. The proposed system provides a predictive tool to detect potential hazards between all work zone actors, providing them with enough time to prevent imminent threats. This system focuses on detecting imminent threats, thus minimizing the potential false positive alarms. The hazard detection system’s diverse capabilities were assessed via road experiments conducted at Virginia Smart Roads. The system’s effectiveness in identifying and mitigating various work zone hazards was also evaluated in experiments.
Literature Review
Previous research has underscored the implications of unsafe worker behaviors and deficient situational awareness as principal causes of numerous highway work zone accidents [23,24]. A potential resolution to this predicament involves enhancing workers’ situational perception through the development of alert systems. Specifically, the Work Zone Intrusion Alarm Technology (WZIAT) was introduced to alert highway construction personnel of impending traffic intrusions to the work zone. Such systems can identify imminent threats posed by passing traffic and consequently trigger visual, or audio, vibrotactile alarms to caution workers [25]. Available WZIAT intrusion alert technologies include SonoBlaster®, Intellicone®, Worker Alert System (WAS) and IntelliStrobe® [26]. The SonoBlaster® and Intellicone® devices are mounted on work zone barriers such as traffic cones and drums, triggering upon the tilting of these barriers, thus indicating a potential intrusion. The WAS employs a pressured trigger pneumatic tube to identify intrusions, subsequently releasing visual, auditory and vibrotactile alerts upon detection. The IntelliStrobe® serves as a remotecontrolled flagger, also utilizing a pressured trigger pneumatic tube to detect intrusions and initiates an auditory alarm upon detection [25-29]. However, it is important to note that while WZIAT devices focus on managing imminent threats from outside the work zone, specifically passing vehicles intruding into the work zone, they often overlook the intricacies of construction processes occurring within the work zone [25].
Highway workers are also consistently subjected to risks emanating from actors inside the work zone. From 1995 to 2002, approximately fifty percent of worker injuries and fatalities at highway work zones were attributable to incidents involving compromised visibility between construction equipment and workers [30]. Moreover, it was discerned that equipment moving backward presented a considerably elevated risk of accident compared to equipment advancing forward or operating in idle mode. Several studies modelled hazardous zones around construction equipment, henceforth referred to as ‘threat zones’, factoring in the equipment’s blind spots to address the visibility-related accidents [12,19,31]. Teizer et al. [12] proposed a 3-dimensional model of threat zones consisting of warning and alert areas. Awolusi et al. [32] designed hazardous zones that accommodate specific equipment functionalities. Wang and Razavi [10] also delineated a threat zone with warning and alert distances. The distinction between warning and alert distances is determined by critical factors such as the reaction time of workeron- foot, the reaction distance of the equipment, and the braking distance of the equipment. Marks et al. [33] further investigated the minimum distances between the work area and the intrusion sensing devices corresponding to the speed of the equipment. Other studies explored alerting systems with user-centered design, where hazardous zones were established around workers-on-foot. For example, Sakhakarmi and Park [34] have classified hazards into three levels depending on the distance between construction equipment and workers.
Despite the advancements, existing crash detection systems in previous research [13,19-22,25-29,35,36] tend to concentrate either on averting collisions from passing vehicles (i.e., threats external to the work zone), or on mitigating potential hazards from construction equipment or material (i.e., threats internal to the work zone). At present, a comprehensive connected work zone hazard detection methodology that contemplates all involved actors (both inside and outside the work zone) as an integrated system is missing. Furthermore, there is an evident demand for a realtime threat prediction mechanism that detects potential hazards, distinguishes imminent threats from false-positive hazards and proactively alerts only the involved actors about the potential imminent threats.
Objectives and Scope
This study aims to address the prevailing research gaps in
work zone safety by developing a holistic threat detection and
prevention system that considers collision risks from both inside
and outside the work zone. The intended system seeks to recognize
unsafe proximity between actors and provide real-time warnings
of the detected hazards. To achieve these objectives, the study
encompasses several interlinked focal points:
A. The proposed comprehensive system should be capable of
considering factors relevant to all involved actors onsite.
B. The threat zones around actors should be considered with
a dynamic approach to optimize the real-time prediction of
possible collisions.
C. The hazard prediction algorithm should consider various
factors including future trajectory of actors, ongoing activity,
type of actors, site conditions, shape of the road, and closeness
of workers to work zone borders.
Figure 1 presents an overview of the steps involved in the development and evaluation of the proposed connected system. The connected highway work zone system was assessed through a series of experiments involving diverse scenarios on Virginia’s Smart Roads at Virginia Tech Transportation Institute (VTTI).
Figure 1:The overview of the steps taken to develop and evaluate the proposed connected system.

Materials and Methods
Hazard detection system development Hardware design
Following a thorough assessment of off-the-shelf sensors concerning availability, accuracy, technical specifications, costeffectiveness, and durability under demanding highway work conditions, the DecaWave Ultrawideband transceiver (model DW1000) was identified as the most suitable for the system hardware development [37]. The system utilizes three static UWB sensors, or ‘anchors,’ arranged in a constellation to 1) demarcate the work zone border, and 2) provide localization for five additional mobile sensors or ‘tags.’ Actors within the anchors’ constellation range could then be localized when equipped with a mobile tag. As depicted in Figure 2, these mobile tags were designed for ease of carrying by personnel or mounting on construction equipment. To maximize range and enhance result accuracy, a calibration process was involved by rotating the X/Y plane of the DecaWave sensor into the WGS84 GPS North/East plane. Figure 3 illustrates the required rotation process to convert a tag/anchor orientation from the DecaWave plane (Dy/Dx) to North/East (N/E).
Figure 2:The UWB anchor tag (left) and the mobile tag (right).

Figure 3:The rotation processes.

A laptop connected to one of the anchors and equipped with internet access facilitates the transmission of tag localization data to the VCC Cloud, which then feeds the VCC Monitor, a web-based situational awareness tool. The Virginia Connected Corridors (VCC), an environment created for tracking Connected Vehicles (CV) in Virginia, encompasses over 60 Roadside Units (RSUs) connected to a low latency backhaul network via Dedicated Short-Range Communications (DSRC) and cellular technology. The VCC Monitor, a web-based client, offers situational awareness for monitoring activities and events within VCC. Through this tool, tag locations can be tracked in real-time on a Google map display.
Additionally, a Connected Vehicle (CV) is incorporated into the system for data collection and demonstration purposes. CVs are employed as proxies for passing traffic due to their embedded communication systems, which enable precise real-time vehicle data transmissions. Equipped with a DSRC radio and an Onboard Unit (OBU), this vehicle emits the Basic Safety Message (BSM), a standardized communication packet transmitted every tenth of a second during Vehicle-to-Vehicle (V2V) communications. This packet includes real-time location information (using DPGS). Similar to the tags, the vehicle’s location can be tracked in realtime on the VCC Monitor map display. The OBU system can easily be deployed to conventional vehicles by adding sensors that enable receiving real-time information. It is expected that CVs will markedly improve highway work zone safety while providing additional data to enhance national roadway operations and overall travel experience. Moreover, considering the rising trend of CV implementation in urban areas, the designed connected work zone system may see wide-scale usage in the future [23].
Work zone threat detection algorithm design
The VCC Cloud serves as the host for the threat detection algorithm that processes the incoming data related to worker position and movement. The primary objective of this algorithm is to identify potential threats and subsequently transmit warnings to the implicated actors. As presented in Figure 4, real-time location data, collected from actors via the UWB system, including internal work zone actors such as worker-on-foot and equipment as well as OBUs of the nearby CVs, is transmitted to the VCC cloud. The integrated algorithm then processes this data, formulates safety measures for each actor, predicts their trajectory and subsequently predicts unsafe proximities. The geographical location and safety status of each actor, including workers and equipment and CVs, is proactively updated and categorized into ‘safe’, ‘imminent threat’ for workers and equipment and ‘safe’, ‘proximity to active work zone’ and ‘imminent threat’ for CVs. This information is displayed on VCC’s web-based and mobile application platforms (VCC Monitor and VCC app), as well as in a specifically designed CV app to alert the CV drivers, as illustrated in Figure 4.
Figure 4:Real-time communication system within the connected work zone.

As presented in Figure 5, the algorithm continuously receives and processes data. The information delivered from the CV and UWB tags is partitioned based on tag identification numbers and actor categories. For CVs, the system calculates the spatial distance between the vehicle and workers inside the nearby active work zone(s), as demonstrated in Figure 6. Data collected from UWB sensors for each actor are transmitted to the server by the anchors at intervals ranging from 0.1 to 0.5 seconds, depending on the quality of the connection. The analysis procedure consumes between 0.1 to 0.5 seconds, dependent on the number of actors involved. Updated statuses are relayed to the application and the web server every 0.2 seconds. As such, the total time delay is approximately 1.2 seconds. In instances where proximity to an active work zone or an imminent threat is detected, a warning is sent to a designated application designed for CVs as a part of the threat detection system. This warning is visually represented through screen color change in the application, to prevent potential driver distraction.
Figure 5:Highway construction hazard detection algorithm.

Figure 6:Threat zones (alert zone and warning zone) designed for (a) Worker-on-foot; (b) Connected Automated Vehicle (CAV); (c) Mobile equipment (moving forward); and (d) Mobile equipment (moving backward).

To ascertain the safety status of each actor, the threat detection system builds on the safety threat zones presented by Wang and Razavi [10] and extends its definition to allow for dynamic consideration of work zone situations, as explained in more depth in the subsequent section. These threat zones contribute to the prediction of actor trajectories, taking into account their present movement, activities and safety status. Each actor’s threat zone is paired with other actors to detect trajectory overlaps that could result in potential collisions. When an overlap occurs, the system generates warnings displayed in real-time on the active map in the VCC Monitor, as shown in Figure 5.
Actor threat zones
In the context of this research, a ‘threat zone’ is constructed as a space around work zone actors wherein close proximity can pose risks, as illustrated in Figure 6. Accordingly, the overlapping of two or more threat zones, coupled with the intersection of their anticipated trajectories, signifies an impending hazard. The hazard detection module predicts actor trajectories, identifies overlaps between threat zones and consequently recognizes potential collision scenarios. The threat zone consists of two zones: the alert zone and the warning zone. The fundamental design of the threat zone derives from previous work by Wang and Razavi [10], Roofigari et al. [38] and Teizer and Cheng [19], albeit modified to fulfil the specific objectives of this research. The ‘alert zone’ is a space in immediate proximity to an actor, which is inherently unsafe due to its extreme closeness. The ‘warning zone’, on the other hand, is a region that, while less dangerous than the alert zone, still harbour’s potential risks and is therefore considered hazardous. In this study, the boundaries of the warning zone are determined based on the predicted location and trajectory of the actor [39].
In this project, a dynamic approach is taken to define a threat zone for each actor that encompasses real-time safety considerations under diverse conditions. In such an approach, the ‘alert area’ is considered constant, while the size and shape of the warning area change in real-time depending on different influencing factors. The dimensions of the warning area are determined by a multitude of factors, such as the actor’s speed (for equipment and CV) and current motion pattern/direction (all actors), to name a few. Actors’ trajectories are also forecasted according to their activities and present motion trends. Thus, one of the principal challenges in this study is to determine the geometry of the threat zone while fully accounting for all influencing factors. The changes to threat zones are as follows: For workers-on-foot, the diameter of the circular threat zone changes in response to the identified unsafe conditions, with the worker situated at the centre of the circle, as shown in Figure 6(a). The diameter of the alert zone (illustrated as a red area) and warning zone (depicted as a white area) are onemeter (3ft) and 1.5 (~5ft) meters by default, respectively. The onemeter diameter for the alert zone is adopted based on the minimal required distance between workers engaged in different work operations [40]. The 1.5-meter measure is derived by multiplying the average comfortable gait speed of males in their 30s and 40s by the mean reaction time [38].
The design of the threat zone for workers-on-foot changes according to the specific work zone and environmental variables, herein referred to as influencing factors. Workers’ distance to the work zone border, the roadway’s geometry (curvilinear or linear) and ongoing worker activities are the three primary influencing factors identified in the dynamic development of the warning zones for workers-on-foot (while the alert zones remain fixed). Consequently, the warning zone fluctuates for different workers depending on their respective situations.
Distance to border
The risk of exposure to passing traffic increases as workers-onfoot approach closer to the work zone boundary. As a result, the algorithm allocates a larger radius for the warning zone as they move closer to the border, thereby facilitating the early detection of potential threats. to this end, the standard work zone lanes close to traffic are divided into four zones and the size of the warning zone increases as workers move from zones farther from traffic to the border. The U.S. Interstate Highway System typically employs a 3.7m (12 ft) standard lane width. A width of 0.91m (3ft) is considered a unit for dividing a single highway lane into four subzones. As the worker moves closer to the border, transitioning from zone 4 to zone 1 (Figure 7), the warning zone diameter increases linearly. For instance, Figure 7 depicts tag 1 and tag 2 as two distinct workers in zone 4 and 2, respectively. The warning zones are represented by orange circles with different diameters. The influence of distance to the border on workers’ warning zone is summarized in the following equation:
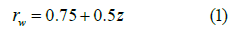
Figure 7:Single-lane work zone partitions and corresponding warning zones.

where rw is the warning zone radius of workers-on-foot, in zone 4, in zone 3, in zone 2 and in zone 1.
The shape of the road: Vehicles navigating at high speeds along a curvilinear route are subject to centrifugal force, which can potentially lead to serious rollover accidents, thereby increasing the risk of intrusion into the work zone [41]. Consequently, the roadway geometry, specifically whether the road is curved or straight, is incorporated as an influencing factor for workers-onfoot. In curve sections (Figure 8), a vehicle exiting the curve poses a higher collision risk compared to one entering the curve. Given this consideration of the curve’s influence, a worker positioned in the exit portion of the curve is assigned an increased warning zone radius, as shown in the following equation:
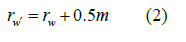
Figure 8:Curve road condition.

where rwt is the warning zone radius of workers when they are departing the curve section.
Connected vehicles and construction equipment
The alert zone design for CV and equipment is derived from the general hazardous zone design proposed by Teizer and Cheng [19]. The alert zone is conceptualized as a rectangular area, augmented by one meter on each side for connected vehicles and 1.5 meters for equipment (as illustrated in Figure 9). The warning zone for the CV and equipment presents a prediction of their forthcoming movement. It is subject to variations based on driver Reaction Time (RT), vehicle/equipment’s velocity (v), road friction coefficient (μ), steering angle (α) and the system time delay (l). In order to construct the shape of a warning zone, namely, the area AEGHFD in Figure 9, an auxiliary inner circle that intersects all four vertices of the alert area is created. Take the warning zone of CV as an example and given that the length and width of CV are denoted as L_c, W_c, the inner auxiliary circle radius is calculated through the equation:
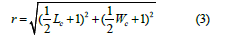
Figure 9:Demonstration of vehicle threat zone.

Subsequently, the upper base of the auxiliary trapezoid EFHG equals to . The calculation of trapezoid Height(h) is explained in the equation:
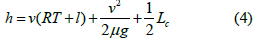
where is the Gravitational acceleration constant. With the height of the auxiliary trapezoid, the threat distance (dc for CV dm, for mobile equipment in Figure 6) is determined by the equation:
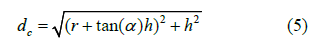
An outer auxiliary circle with a radius (dc for CV) crosses points G and H. The arc GH ensures equal safety protection of the CV from a range of degrees.
Within the scope of this research, the driver’s Reaction Time (RT) is set at 2.5 seconds [42-45] and a standard friction coefficient (μ) value of 0.8 for dry asphalt roads [46,47], is taken into account for computations. Furthermore, the warning area for CVs also incorporates a steering angle (α) of 6 degrees, suitable for merging into adjacent lanes [48], in order to detect proximities to the actors within these lanes. Meanwhile, a Cartesian coordinate system is employed to delineate the real-time boundary of the warning zone, ascertain the location of warning zone components and identify potential collisions (Figure 10). Through this coordinate system, the coordinates of points E and F can be represented as (0, r) and (0, -r), respectively. Similarly, the coordinates for point G can be expressed as (h,r+tan tan (α)h), while those for point H can be denoted as'(h−r−tan tan (α)h).
Figure 10:Vehicle threat zone on X and Y axes..

The dynamic warning zone designed for vehicles and equipment contributes significantly to the successful prediction of potential imminent threats, to allow adequate response time for the endangered actors. For instance, Figure 11 demonstrates dynamic threat zones for two passing CVs with different speeds and two workers positioned at different distances from the work zone border. As illustrated in Figure 11(b), a wider and longer warning zone is designed for the vehicle moving at a higher speed and the worker stationed proximate to the work zone boundary. Owing to the vehicle’s speed and worker’s proximity to the work zone border, although the vehicle’s positioning in Figure 11(b) mirrors that in Figure 11(a), the overlapping threat zones in Figure 11(b) signifies a potential collision contingent on the worker’s trajectory. Consequently, the system displays hazard status on the ‘live’ map of the actors and is presented on the designed CV app.
Figure 11:Warning zones developed for vehicles at different speeds.

Heavy equipment, such as dump trucks, are frequently involved in fatal collisions with workers-on-foot due to the blind spots [30]. To mitigate such risks, this study considers the most dangerous area of a highway work zone as a single-lane work zone layout and factors in the movement direction of the equipment, whereby forward and backward movements are the sole directions considered for construction equipment in work zones. As depicted in Figure 6(c), when moving forward, the machinery the impact of steering angle is not considered due to its constrained agility. Conversely, when in reverse motion, the equipment operator’s field of view is limited, as such, the warning zone is revised to account for equipment blind spots. When comparing the warning zones in Figure 6(c & d), the lines EG and FH in Figure 6(c) are linear, considering no lane changes are anticipated for equipment during forward movement, but lines EG’ and FH’ are inclined to accommodate for a blind spot during reverse movement. To dynamically generate threat zones for CVs and equipment, a database is developed that encompasses dimensions of conventional highway equipment, common vehicle brands and highway activities. Such dimension data is used to craft the customized warning zone for each actor. The equipment database encapsulates conventional equipment models and their corresponding attachments. Similarly, the CV database includes dimensions of various car makes and models.
Worker activity recognition
Various activities are associated with differing levels of potential hazard exposure, given their impact on workers’ situational awareness and response to impending dangers. Therefore, the activity of workers-on-foot is considered a determinant in the accurate prediction and mitigation of potential accidents. The recognition of activity is intended to detect activities based on the locational data received from the UWB tags and the detected moving patterns. Consequently, each activity category encapsulates an assortment of activities with similar movement patterns. This system is designed to categorically classify activities to facilitate the evaluation of their impact on collision risk. In this study, five highway work activities are incorporated and the corresponding data was compiled for the training of machine learning models, as presented in Table 1. Supervised learning methods were employed in this research for the classification of worker activity. The system extracts the classification features based on location and timestamp data transmitted by the tags. Key classifying parameters for activity recognition include speed, static time (duration of immobility) and the direction of movement (e.g., parallel/perpendicular to traffic, moving in/against the traffic direction). The directional data is represented in degrees.
Table 1:Activity category and description.

The selected classification features have been chosen due to their inherent capacity to differentiate the five designated activity categories. Consider, for instance, the operation of a hand-held compactor: the operating speed of this tool is contingent on the model of the compactor and the material it is acting upon, with the speeds ranging from 15.24 to 39.62 meters per minute-a pace that is slower than the average human walking speed. Furthermore, the direction of the compactor’s movement is typically forward-only [49]. Direction and speed also assist in distinguishing the ‘guiding’ activity, which involves guiding an equipment/truck operator while walking backward. Prior research has elucidated that the gait pattern for forward and backward walking is distinct and that highspeed backward ambulation can introduce discomfort [50]. In the case of jackhammering-a task involving breaking hard surfaces such as asphalt-the worker must remain static for an extended duration of time until the target surface is fractured. Therefore, static time is utilized as a feature to differentiate this type of activity.
The speed is calculated by the ratio of the distance travelled to the corresponding temporal duration of the movement. The feature termed ‘static time’ characterizes the interval wherein the workerson- foot remain stationary at a particular location whilst performing tasks. This measure is expressed as a fraction, with the static duration time serving as the numerator and the total activity as the denominator. As the worker’s stay in the same location lengthens, the value of the static time parameter approaches 1. Directional features, such as parallel/perpendicular to traffic or movement in/against the direction of traffic are also incorporated. Here, the movement directions are depicted by relative angles and compared to the direction of highway traffic flow. The absolute orientation angle of the highway is determined using the numbered UWB anchors installed on the work zone border cones and the angular disparity between worker movements and the roadway is expressed using trigonometric functions. The training model implementation is split into two stages, as shown in Figure 12. The initial stage employs the quantitative data from four factors to classify the direction of movement in terms of parallel/perpendicular and moving in/against the direction of traffic parameters. The second stage utilizes the categorized movement directions along with the quantitative factor data, enabling the model to identify the ongoing activities.
Figure 12:The two-step method to improve activity classification accuracy.

sReal-time Safety Status Visualization
As a part of the hazard detection process, the safety status of CVs, as representative of passing traffic, approaching an active work zone is detected to provide warnings to drivers and workers about upcoming events. When a CV approaches a highway work zone (as shown in Figure 13), it is initially marked as Safe, with its representation on the VCC Monitor displaying as a blue marker. As the CV enters within 100 meters from the nearest worker (tag 1), the color of the CV marker on the VCC’s map changes to orange, denoting a ‘Proximity’ status. A proximity notification is transmitted to both the VCC Monitor and the developed CV app. This warning is also displayed to the CV driver through the CV app, presented as a change of display color from green to orange. This approach is designed to increase the situational awareness of drivers with minimal distraction, as illustrated in Figures 13 & 14.
Figure 13:Color representation diagram identifying vehicle safety status when approaching an active work zone.

Figure 14:Safety Status presented to the driver on the CV app

When an overlap is detected between the dynamic threat zone of the CV with any other work zone actor, e.g., workers-on-foot, the color of the CV marker and the associated actor markers on the VCC map change to red, indicating a ‘Threat’ status. This color change signifies that the CV has the potential to intrude into the work zone and cause a collision with the worker (tag 2). When the vehicle resumes its original trajectory or passes the work zone, the marker reverts to blue, signifying a return to ‘Safe’ status. The same safety statuses are depicted on the mobile application developed for CV drivers. The color schemes, illustrated in Figure 15, serve to notify drivers. Green symbolizes a ‘safe’ status, orange indicates the driver about ‘approaching an active work zone’ and red signals a threat, i.e., a potential collision, alerting the driver to modify their trajectory.
Figure 15:Instructions for escape direction generation for workers-on-foot.

Figure 16:Status of the actors in the VCC Monitor.

The VCC monitor’s map is used as a visualization tool to exhibit active work zones and the safety status of various actors and to transmit/receive notifications regarding detected threats to actors (Figure 16). Within the VCC Monitor, color-coded markers indicate three distinct statuses, as represented in Figure 13, Specifically, Safe, Proximity and Threat conditions. The Safe condition signifies the absence of harm or detected hazardous proximity for any actor. The Proximity condition serves as a warning referring to the impending approach of the CV whenever it is 100 meters away from the nearest worker in the work zone. The Threat condition symbolizes an impending hazard between two or more actors. These three conditions are denoted by the colors blue, orange and red, respectively (Figures 13 & 16).
The system is configured to assess and detect overlaps between each pair of actors’ threat zones, as well as their predicted trajectories, at half-second intervals. If overlapping threat zones and intersecting trajectories are identified, the system will generate warning messages for the actors involved. The system is also equipped to provide brief instructions to guide workers-onfoot toward safe moving directions, thereby mitigating potential collisions. Consequently, in scenarios where one or multiple workers-on-foot are involved in a detected threat, the system will activate the message generation module to determine safe directions for each worker. Concurrently, the algorithm generates advisory messages presented on the VCC monitor that are visible to actors or safety managers, informing them of their safety status.
As depicted in Figure 15, during the process of instruction generation, eight directional dots are formulated around the pedestrian worker. Each of these dots represents a potential escaping direction for the worker. The algorithm checks each dot’s safety status in terms of being occupied by other actors or the detected trajectory of other surrounding actors. Dots inside other actors’ warning zones are marked as dangerous and filtered by the algorithm. Only safe directions will be displayed on the VCC monitor (Figure 23).
Results and Discussion
Simulation
The developed UWB system technology was used to collect data from simulated work zones at Virginia Smart Roads. The UWB frequency in this research is compatible with the Code of Federal Regulations (CFR) 47 Part 15.519 technical requirements for handheld UWB systems [51]. The anchors were placed on three cones, representing the work zone border. Data was collected for various work zone conditions, as explained previously, including on the straight and curved sections of the Smart Road. Two students held two tags and three tags were assigned to equipment. The mobile equipment included a truck, a mule and a mower. Data from UWB tags included tag number, timestamp, latitude and longitude. One CV was also involved in the experiment and data from the CV included ID number, timestamp, latitude, longitude, heading, degree and speed. Participants performed various activities, including walking, guiding (moving backward), compacting, jackhammering and random movement.
In the experiment, the coverage range of the UWB system was up to 100 meters during clear, sunny conditions and 65 meters under cloudy weather. Based on observational data, the location data acquired through the established UWB system exhibited a maximum deviation range of 0.4 to 0.6. However, the system occasionally demonstrated instances of data loss. The accuracy of the sensing technology is contingent upon multiple variables, including the precision of the anchors’ setup, the availability of a direct line-of-sight and the prevailing weather conditions.
MATLAB GUI was developed to display a simulation view of the experiment process. During the simulation, the threat zone of each actor and its trajectory were displayed through the developed GUI. The simulation process checked actor trajectories accurately and corresponding messages were generated in real-time, as shown in Figure 17.
Figure 17:Warning message and instruction in simulation.

A total of 49 movement patterns were simulated and categorized, including three samples of jackhammering, 16 walking samples, 10 compacting samples, 14 guiding samples and 6 samples of random movements. MATLAB Classification Learner application was used to perform supervised learning, with four quantified factors including speed, static time and type of direction (parallel/ perpendicular to traffic, moving in/against traffic direction). All models in Classification Learner were tested and compared and the trained model with the highest accuracy was selected for activity classification and prediction. The accuracy of the model was significantly improved through the two-step classification method (Figure 12) that uses the quantitative feature data to predict qualitative variables of directions mentioned in previous sections, compared to the original one-step supervised learning model (65.9% accuracy). The overall accuracy of the model was 75.5% from Ensemble Bagged Trees. The confusion matrix of the selected supervised learning model is shown in Figure 18.
Figure 18:The confusion matrix of the supervised learning model for activity recognition.

However, some unbalanced accuracy among various activities exists that is caused by 1) the sample size of different activities was not equal; Some activity data had to be removed due to the data inconsistency during the data collection. The activities with a larger sample size obtained better accuracy; 2) Activities are recognized using only location data and timestamps. More details of human motion can help improve efficiency and 3) some activities share similar features/patterns. Those activities are walking and guiding, jackhammering and random movement, compacting and walking. For example, walking, guiding and compacting require walking motion, which can lead to activity recognition errors. The differences between them are moving directions and hand-held equipment involvement.
Field test
A system demonstration was held at Smart Road to evaluate different features of the developed system. The demonstration was conducted to test the usability of the system in various real work zone scenarios. It aimed to assess the capability of the system in prompt prediction/detection of true potential hazards, not false positive situations and deliver accurate safety statuses and feedback. Two workers-on-foot (tag 304 and 306), one CV (tag 900) and one equipment (mule, tag 305) were included in the test, as shown in Figure 19. The locations of UWB anchors and sensors are shown in Figure 20. The workers held a sensor, while the sensor for equipment was attached to the top of the mule.
Figure 19:The CV (left), worker-on-foot (mid), and mule (right) in close proximity.

Figure 20:Warning message and instruction in simulation.

During the tests, multiple scenarios were conducted 1) worker (tag 304) walked parallel and close to the border (within 3m of vehicle path); 2) worker (tag 304) walked perpendicular from the work zone border to the road shoulder (distancing from the traffic); 3) worker (tag 304) walked perpendicular from road shoulder to the border (approaching the traffic). 4) worker (tag 304) and mule (tag 305) moved parallelly close to shoulder; 5) worker (tag 304) and mule (tag 305) moved parallelly close to the border; 6) random movement of all actors inside the work zone. In the scenarios, the second worker (tag 306) was used as a control group, walking randomly near the road shoulder inside the work zone (Figure 21). In scenarios with more than one worker, the system was able to accurately detect and display only the endangered actors (as shown in Figures 16 & 22). In all the scenarios, the speed of the CV was limited to 40 mph due to safety restrictions. The vehicle speed would not impact the system accuracy, as it is part of the dynamic threat zone development (i.e., at higher speed, a larger threat zone will be generated which results in earlier detection of potential threats).
Figure 21:The VCC application display and three on-site statuses.

Figure 22:The VCC Monitor display and three on-site statuses.

The CV drove past the work zone in loops while the workeron- foots and equipment performed scenarios. The CV experienced two or three status changes during each scenario. In the first and third scenarios, the worker (tag 304) moved parallel/toward the work zone border (Figures 21(c) and 22(c)). The CV was in a Safe status at the beginning, marked in blue on the VCC Monitor and green on the CV application. When the CV approached and reached within 100 meters of the closest worker-on-foot (tag 304) in the work zone, the CV marker turned orange on both the VCC monitor and CV application, indicating proximity to an active work zone. When an imminent threat between the CV and the worker (tag 304) was detected in the third scenario (Figure 21(c)), where the worker moved perpendicular to the border towards the CV, the CV and worker marker on both monitor and app turned red. The distance between the CV and the worker was estimated at 2m when the status was updated (as in Figure 21(c)). In the second scenario, the worker (tag 304) moved perpendicularly from the work zone border towards the road shoulder and as a result, no threat was detected and the system triggered only a proximity notification for the CV.
In scenario 3, a threat was detected between worker and equipment inside the work zone due to their proximity and warning messages were generated accordingly as shown in Figure 23(c). The message included status type, actor tag number(receiver), actor type, colliding actor and safe path instruction. Scenario 5 involved both the worker and equipment moving close to the border. As a result, threat warnings were generated for all involved actors in VCC, including the worker (tag 304), equipment (tag 305) and the CV. Under this scenario, the markers of all three actors turned red and the VCC application for drivers displayed a red color for threat warnings. In scenario 5, workers and equipment within the work zone moved randomly. The aim of it was to observe if the system could protect actors without any predefined movement pattern. The result further proved efficient in identifying hazards in all the scenarios. The statuses and received messages in the server were consistent with the activities conducted. The developed connected work zone system successfully detected the imminent proximity hazards and displayed the information as expected.
Figure 23:Example warning messages and moving direction instructions presented on the VCC monitor.

The proposed hazard detection system achieved promising results to enhance of safety of highway work zones by considering a holistic approach to hazard prediction. However, there exist challenges that will be further pursued in future research. The research predominantly utilized UWB sensors for location detection and communication; however, the presence of obstacles could influence line-of-sight, thereby influencing the precision and latency of the data received. Additionally, disruptions in data communication arose due to various factors, including the positioning and height of the anchors and meteorological conditions. Further study needs to investigate a robust communication solution for the possible complex outdoor environment involved in highway work zones. The authors apply other available sensing technologies, such as Global Positioning System-Real Time Kinematic (GPS-RTK), into their ongoing research efforts.
While the factors influencing threat zones, as outlined in this research, provide a comprehensive baseline, there exists potential for expanding this to encapsulate real-world scenarios more effectively. For instance, the current research’s primary focus is the development of a comprehensive hazard detection framework under daylight conditions, thereby serving as a reference system. Factors such as nighttime conditions, ambient noise and meteorological variables could be incorporated into the framework in the future. An advanced variant of the system is presently under development, accounting for external factors such as day/night transitions and activity-related variables like noise and vibration.
The inconsistency of received data also impacted the accuracy of the activity recognition. Future research endeavors will focus on several facets including 1) encompassing a broader spectrum of worker activity, 2) leveraging motion sensors such as Inertial Measurement Units (IMU) for the collection of worker motion data and 3) incorporating additional features to aid classification algorithms. Furthermore, a human-centric wearable device is under development by the authors, aimed at delivering customized warnings and notifications to workers and operators, taking into consideration the individual’s ongoing activity and the specific work zone environment. Additionally, all warnings and notifications will be simplified to ensure easy comprehension and adherence by workers.
Conclusion
Highway construction workers are frequently exposed to highspeed traffic and heavy construction equipment, leading to a high risk of work zone accidents involving fatalities and injuries. Existing safety measures have proven inadequate in fully safeguarding the well-being of highway construction workers. To address this issue, this paper proposes a holistic hazard detection system. The proposed system employs an integrative approach to the problem by considering all relevant actors, including workers on foot, construction equipment and connected vehicles as a representative of passing traffic.
The system proactively collects and transmits real-time location data of work zone actors to a cloud server through UWB tags and anchors, detects unsafe proximities and subsequently issues warnings regarding detected threats. It also formulates predictions based on various factors including trajectory formation, activity recognition, actor categorization, site conditions, road geometry and proximity to work zone boundaries. These predictions serve to issue preemptive warnings and prevent potential collisions between site actors. The VCC website and associated application offer a visual representation of each actor’s real-time safety status for the benefit of relevant actors and/or site safety managers. An activity recognition model was also developed as part of the system to classify distinct work tasks, offering a granular understanding and monitoring of how worker activity impacts their situation awareness, thereby dictating the need to detect hazards early, i.e., by considering varying threat zones depending on the worker activity. The efficacy of the system in hazard detection was evaluated through a series of simulated and field-based experiments, which proved the efficacy of the system in accurately detecting hazardous situations and providing warning to endangered actors.
Conflicts of Interest
The authors declare no conflict of interest.
References
- CDC (2022) Highway Work Zone Safety. NIOSH.
- Stephanie G Pratt, Fosbroke DE, Marsh SM (2001) Building safer highway work zones: Measures to prevent worker injuries from vehicles and equipment. DHHS publication no. (NIOSH) 2001-128.
- Molen HF van der, Basnet P, Hoonakker PL, Lehtola MM, Lappalainen J, et al. (2018) Interventions to prevent injuries in construction workers. Cochrane Database Syst Rev.
- National Safety Council (NSC) (2023) Motor Vehicle Safety Issues: Work Zones.
- Yasin YJ, Grivna M, Abu-Zidan FM (2021) Global impact of COVID-19 pandemic on road traffic collisions. World J Emerg Surg WJES 16(1): 51.
- Saha P (2020) An optimization methodology to improve work zone safety within a limited budget in a roadway network. In Proceedings of the International Conference on Transportation and Development (Conference Cancelled), Washington, pp. 204-211.
- Fu Y, Li C, Yu FR, Luan TH, Zhang Y (2022) A survey of driving safety with sensing, vehicular communications, and artificial intelligence-based collision avoidance. IEEE Trans Intell Transp Syst 23(7): 6142-6163.
- Li Y, Bai Y (2009) Highway Work Zone Risk Factors and Their Impact on Crash Severity. J Transp Eng 135(10): 694–701.
- Oloufa AA, Ikeda M, Oda H (2003) Situational awareness of construction equipment using gps, wireless and web technologies. Autom Constr 12(6): 737-748.
- Wang J, Razavi SN (2016) Low false alarm rate model for unsafe-proximity detection in construction. J Comput Civ Eng 30(2): 04015005.
- Fullerton CE, Allread BS, Teizer J (2009) Pro-active-real-time personnel warning system. In Construction Research Congress 2009: Building a Sustainable Future, pp. 31-40.
- Teizer J, Allread BS, Fullerton CE, Hinze J (2010) Autonomous pro-active real-time construction worker and equipment operator proximity safety alert system. Autom Constr 19(5): 630-640.
- Park J, Marks E, Cho YK, Suryanto W (2015) Mobile proximity sensing technologies for personnel and equipment safety in work zones. Computing in Civil Engineering, pp. 41-48.
- Ruff T (2006) Evaluation of a radar-based proximity warning system for off-highway dump trucks. Accid Anal Prev 38(1): 92-98.
- Cheng T, Venugopal M, Teizer J, Vela PA (2011) Performance evaluation of ultra wideband technology for construction resource location tracking in harsh environments. Autom Constr 20(8): 1173-1184.
- Hwang S (2012) Ultra-wide band technology experiments for real-time prevention of tower crane collisions. Autom Constr 22: 545-553.
- Park J, Marks E, Cho YK, Suryanto W (2016) Performance test of wireless technologies for personnel and equipment proximity sensing in work zones. J Constr Eng Manag 142(1): 04015049.
- Marks E, Teizer J (2012) Proximity sensing and warning technology for heavy construction equipment operation. In Construction research congress 2012: Construction challenges in a flat world, pp. 981-990.
- Teizer J, Cheng T (2015) Proximity hazard indicator for workers-on-foot near miss interactions with construction equipment and geo-referenced hazard areas. Autom Constr 60: 58-73.
- Chan K, Louis J, Albert A (2020) Incorporating worker awareness in the generation of hazard proximity warnings. Sensors 20(3): 806.
- Park J, Yang X, Cho YK, Seo J (2017) Improving dynamic proximity sensing and processing for smart work-zone safety. Autom Constr 84: 111-120.
- Jo BW, Lee YS, Khan R, Kim JH, Kim DK (2019) Robust Construction Safety System (RCSS) for collision accidents prevention on construction sites. Sensors 19(4): 932.
- Bagloee SA, Tavana M, Asadi M, Oliver T (2016) Autonomous vehicles: Challenges, opportunities and future implications for transportation policies. J Mod Transp 24: 284-303.
- Guo H, Yu Y, Xiang T, Li H, Zhang D (2017) The availability of wearable-device-based physical data for the measurement of construction workers’ psychological status on site: From the perspective of safety management. Autom Constr 82: 207-217.
- Nnaji C, Gambatese J, Lee HW (2018) Work zone intrusion: Technology to reduce injuries and fatalities. Prof Saf 63(4): 36-41.
- Gambatese JA, Lee HW, Nnaji CA (2017) Work zone intrusion alert technologies: Assessment and practical guidance: Final report. Oregon State University. School of Civil and Construction Engineering.
- Krupa C (2010) Work zone intrusion alarm effectiveness (No. NJ-2010-004). Dept of Transportation, New Jersey, USA.
- Khan G, Sanni S, Berr S, Shafizadeh K (2019) Evaluation of work zone intrusion alarms (No. CA19-3038).
- Deshmukh CS (2022) Construction road signs detection for improving traffic safety. M.S., California State University, Sacramento, California, United States.
- Hinze JW, Teizer J (2011) Visibility-related fatalities related to construction equipment. Saf Sci 49(5): 709-718.
- Ray SJ, Teizer J (2013) Computing 3D blind spots of construction equipment: Implementation and evaluation of an automated measurement and visualization method utilizing range point cloud data. Autom Constr 36: 95-107.
- Awolusi IG, Marks ED, Pradhananga N, Cheng T (2015) Hazardous proximity zone design for heavy construction equipment.
- Marks E, Vereen SC, Awolusi I (2017) Active work zone safety using emerging technologies. University Transportation Center for Alabama, USA.
- Sakhakarmi S, Park J (2020) Wearable tactile system for improved hazard perception in construction sites. In Proceedings of the Construction Research Congress 2020; American Society of Civil Engineers: Tempe, Arizona, pp. 120-128.
- Sharma H, Reddy RK, Karthik A (2016) S-CarCrash: Real-time crash detection analysis and emergency alert using smartphone. 2016 International Conference on Connected Vehicles and Expo (ICCVE) 36-42.
- Yee TH, Lau PY (2018) Mobile vehicle crash detection system. 2018 International Workshop on Advanced Image Technology (IWAIT) 1-4.
- Fang Y, Cho YK, Zhang S, Perez E (2016) Case study of BIM and cloud-enabled real-time RFID indoor localization for construction management applications. J Constr Eng Manag 142(7): 05016003.
- Esfahan NR, Wang J, Razavi S (2015) An integrated framework to prevent unsafe proximity hazards in construction by optimizing spatio-temporal constraints.
- Han W, White E, Mollenhauer M, Esfahan NR (2019) A connected work zone hazard detection system for roadway construction workers. 242-250.
- Dagan D, Isaac S (2015) Planning safe distances between workers on construction sites. Autom Constr 50: 64-71.
- Wang Y, Wenjuan E, Tian D, Lu G, Yu G (2012) Highway curve collision avoidance warning system based on VII. 1551-1558.
- Copradar driver reaction times.
- McGehee DV, Mazzae EN, Baldwin GS (2000) Driver reaction time in crash avoidance research: Validation of a driving simulator study on a test track. Proceedings of the Human Factors and Ergonomics Society Annual Meeting 44(20): 3-320.
- Hooper KG, McGee HW (1983) Driver perception-reaction time: Are revisions to current specification values in order? (No. HS-036 165).
- Chang MS, Messer CJ, Santiago AJ (1985) Timing traffic signal change intervals based on driver behavior. Transportation Research Record 1027: 20-30.
- Chen Y, Shi T, Shi Q, Wang C, Li P (2018) Development and validation of vehicle safety margin for design of highway horizontal curve. 4331-4339.
- Persson BN, Tartaglino U, Albohr O, Tosatti E (2005) Rubber friction on wet and dry road surfaces: The sealing effect. Phys Rev B 71: 035428.
- Zhao S, Li Y, Qu X (2014) Vehicle chassis integrated control based on multimodel and multilevel hierarchical control. Math Probl Eng (1): 1-13.
- Harding MA (1995) Walk-behind plate compactors.
- Grasso R, Bianchi L, Lacquaniti F (1998) Motor patterns for human gait: Backward versus forward locomotion. J Neurophysiol 80(4): 1868-1885.
- The Office of the Federal Register 47 CFR 15.519 -- Technical Requirements for Hand Held UWB Systems.
© 2024 Roofigari Esfahan Nazila. This is an open access article distributed under the terms of the Creative Commons Attribution License , which permits unrestricted use, distribution, and build upon your work non-commercially.
Editor In Chief


.jpg)


Signup for Newsletter

Quick Links
 Editorial Board Registrations
 Submit your Article
 Refer a Friend
 Advertise With Us
Our Recent Edition

.jpg)


Top Editors


.jpg)


.bmp)
.jpg)
.png)
.jpg)


.jpg)


.png)

.png)


.png)


Financial Support

Sponsors

Latest e-Books

Latest Video

 a Creative Commons Attribution 4.0 International License. Based on a work at www.crimsonpublishers.com.
Best viewed in
a Creative Commons Attribution 4.0 International License. Based on a work at www.crimsonpublishers.com.
Best viewed in