- Submissions

Full Text
Advancements in Civil Engineering & Technology
Pollution in Loch Lomond Caused by Contaminated Runoff
Saif Helal1, Ikrema Hassan1* and Amena Gadoura2
1Department of Engineering, University of New Brunswick, Canada
2Department of Biology, University of New Brunswick, Canada
*Corresponding author:Ikrema Hassan, Department of Engineering, University of New Brunswick, Saint John, Canada
Submission: January 05, 2024;Published: January 31, 2024

ISSN: 2639-0574 Volume6 Issue1
Abstract
Contaminated lake water is a large issue for all environmental factors such as the aquatic species and their ecosystems, contaminated lake water can also harm humans as most large lakes are the source for drinking water for cities around Canada. This study was conducted to understand the contamination in Loch Lomond (a Lake near Saint John, New Brunswick) which is used as a source for drinking water for the people in the city of Saint John and in the surrounding area. In this study, 21 different samples were chosen throughout different locations around Loch Lomond, seven sites were sampled, and each site was sampled at three different events. The water samples were collected in clean/sterile bottles and then delivered to Saint John Laboratory services where the analysis was conducted to determine the concentration of Orthophosphate, Total Phosphorus, Nitrate/Nitrite, Coliform, E-coli, Total Organic Carbon and Dissolved Carbon. The catchment area for each of the seven points was calculated based on the contour lines and topography. The runoff was estimated using the rain intensity data collected from the local weather station. Calculations were conducted for each contaminant to retrieve a value in mg/year. The results that displayed the most concerning values was the ortho-phosphate and total phosphate, this value ranged around 7x10⁻⁴mg/year and 10x10-4mg/year. Orthophosphate being detected in drinking water leads back to a common concern of leaking septic tanks; this is because Orthophosphate lines lead pipes in the sewage system and thus detecting it in drinking water means it is contaminated. These high values can lead to health issues like algal blooms that will harm both aquatic animals and humans, though this has not been seen in any serious health matters in the city. This study serves the purpose of informing locals, city professionals and those concerned with the quality of drinking water about the state of the Loch Lomond Lake and if it has or will lead to any major health issues.
Introduction
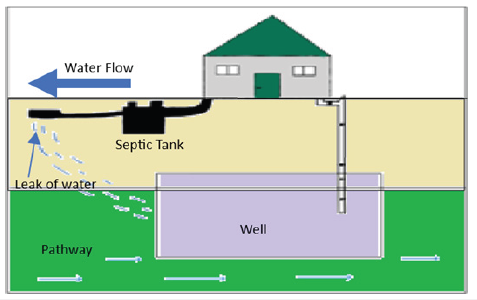
This study also shows the importance of septic systems since septic systems are often cited as an important contributor to rural watershed nutrient loads also Septic systems are on-site domestic wastewater treatment and dispersal systems used in areas not serviced by centralized wastewater treatment plants (WWTPs). It is estimated that approximately 20% of households across the United States [1] (U.S. EPA, 2018), 20% in Australia (Beal et al., 2005), 26% in Europe (Williams et al., 2012), and 14% in Canada (Statistics Canada, 2011) use septic systems for domestic wastewater treatment. The overall goal of the study is to assure that saint john water is safe to drink (Figure 1).
Figure 1:septic system design.
Contaminated water holds a great issue to any consumer since it can transmit diseases like diarrhea, cholera, dysentery, typhoid, and polio, causing an estimated 485,000 diarrheal deaths annually [2]. Estimation of Nutrient Loads from Septic Systems) Orthophosphate was tested first, then Total phosphorus as high levels of phosphorus can cause algae blooms, resulting in the production of algal toxins, which can pose significant health risks to humans and animals.
Nitrate was the next contaminant tested since consuming too much nitrate can affect how blood carries oxygen and can cause methemoglobinemia (also known as blue baby syndrome). One case study done in 2000 published in the Environmental Health Perspectives journal displayed two cases of infants who had contracted baby blue syndrome from nitrate-contaminated drinking water. It was reported that this contaminated water was used to prepare baby formula and had caused the babies to become lethargic [3].
Total coliforms then followed, as most of them are not harmful however, some of them can make you sick with a high fever or a n upset stomach then Total organic carbon since it may lead to DBPs, which lead to bladder cancer and possibly reproductive problems in water drinkers and lastly Dissolved carbon makes the water more acidic and corrosive which leads to higher concentrations of metals in the water [4].
The source of most lake contaminants is understood to be septic systems and storm runoff. Septic systems, small wastewater treatments and dispersal systems, are used in areas not serviced by centralized wastewater treatment plants, this allows nutrients and other contaminants in the septic effluent to flow down into the groundwater and end up in lakes [2]. The design and size of a septic system can vary significantly (one of the newest designs: An automated septic system placement tool was developed in ArcGIS 10.5.1 to generate spatial information on the total number of septic systems in each area and on the setback distances between individual septic systems and the nearest tributary) and is influenced by factors such as household size, soil type, site slope, lot size, proximity to water bodies, weather conditions, and local regulations. The septic tank is responsible for digesting organic matter and separating floatable matter and solids from wastewater. In conventional systems, effluent is discharged into perforated pipes in a leach field or chambers to slowly release it into the soil [5-8].
Alternative systems use pumps or gravity to help the effluent wash through sand, organic matter, or wetlands to remove or neutralize pollutants. Some systems also evaporate or disinfect wastewater before it is discharged into the soil. Septic systems provide wastewater treatment for many homeowners who also often get their drinking water from private wells. If a septic system is not working properly or is located too close to a drinking water well, contaminants from the wastewater can end up in drinking water. For well-functioning septic systems, effluent constituents including nutrients and pathogens can be highly attenuated as they migrate downwards through the unsaturated drain field to the groundwater [9-13]. A well-installed, sited, and maintained septic system should not negatively impact water quality. However, some designs may necessitate advanced treatment to reduce wastewater strength, nitrogen contamination impacts, or disinfect properties near surface waters.
A failing septic system likely releases untreated wastewater, containing pathogens, nutrients, and harmful substances directly into groundwater or groundwater and surface waters, which can cause severe stomach cramps, diarrhea (often bloody), and vomiting. Some people may have a fever, which usually is not very high, however in some severe cases it may lead to death. In June 2017, the Pennsylvania Department of Health (PADOH) was notified of multiple norovirus outbreaks associated with 179 ill individuals who attended separate events held at an outdoor venue and campground over a month period, because of a septic tank leak [14-17].
Methodology
Loch Lomond, a 793.5ha lake in New Brunswick, Canada, is situated at 45.3682 Longitude, -65.8585 Latitude and is equivalent to 1961ac or 7.9sqkm, the estimate terrain elevation above sea level is 93 meters. Loch Lomond lake is a rural area with large home and lots of narrow country roads, known for its ATV trails and hiking trails. Historically farmland, the area is now home to Saint John Airport and several private hangars. Loch Lomond/Latimer Lake is the city’s longest street, nearly 14 km long, and is home to the city’s east-side drinking water supply since 1855. The water collected in Latimer Lake, which flows into Saint John via the Little River, supplies the north and south ends, East side, and parts of the west side with award winning drinking water [18-22]. The boundaries and data used to define neighbourhoods are supplied by Statistics Canada as Census Tracts and may not reflect exact local area names and boundaries (Figure 2).
Figure 2:The collection points around Loch Lomond.
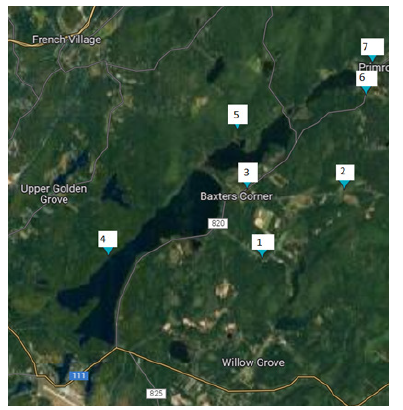
There were 21 samples taken from 7 different, each at three different events, starting from (May 16 to June 14), the samples were taken in a sterilized clean plastic bottle, and then the samples were delivered to Saint John laboratory services to give us a detailed analysis of the data. After collecting the samples, they were put in a cold icebox to make sure it stays at a suitable temperature. For the calculations, the Runoff Coefficient C (The runoff from a watershed is a volume, but often expressed as the average depth of water that would cover the entire watershed) was multiplied by Rainfall intensity I, and Drainage area A, to give us the Peak discharge, or q. C was obtained from a runoff coefficient chart, I was calculated by seeing how much rain came down divided by the total time it rained, and A was calculated on google maps using the catchment area and a topography map. After acquiring the peak discharge, it was multiplied by each concentration of the contaminant that was in the water sample to show the amount of contamination at each site; each contaminant was measured and calculated at all 3 events and all 7 sites [23,24].
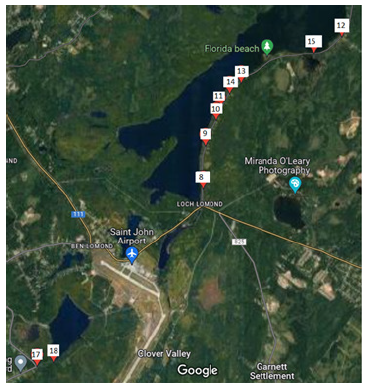
In 2023 since the start of July to end of August another 20 samples were taken to show the contamination through time, to infer whether the contaminants are point source contaminants or not. These samples taken recently were from 10 different locations along Loch Lomond Road (Figure 3).
Figure 3:Collection points (2023) at Loch Lomond Road.
Results and Discussion
Table 1 shows the rational runoff coefficient, rainfall intensity, drainage area and peak discharge throughout site1 to site7 from event 1 to event 3. It is shown in Table 1 that at each event the rational runoff coefficient and rainfall intensity are the same since they are all around Loch Lomond Lake and they are all at the same event. Table 1 displays the peak discharge at every site for the three events, each one then is multiplied by each contaminant and then it shows whether the water is drinkable or could lead to diseases like E. coli and others.
Table 1:

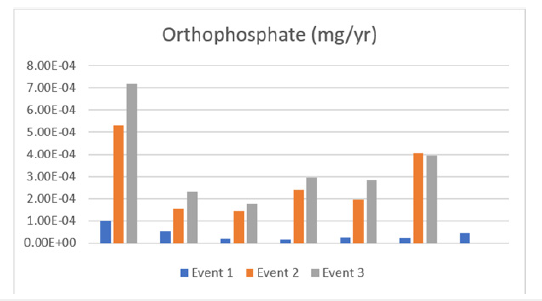
Through the calculations conducted and displayed in Figure 4, it is seen that orthophosphate gradually increased between the three sampling events, it can also be noted that site 1 increased in a rapid pace compared to the other 6 sites. This pattern highlighted throughout the events indicates that this is a non-point source and thus will not increase anytime soon.
Figure 4:Orthophosphate through events (1,2,3).
Orthophosphate is a crucial indicator of natural water nutrient status and forms a protective coating in water lines and household plumbing. It is a proven water treatment method and industry standard used to prevent corrosion and reduce lead in drinking water. It is used in cities worldwide and North America, including Toronto, Hamilton, Winnipeg, Halifax, New York City, and Washington, D.C. Orthophosphate, a substance found in phosphoric acid, salt form and zinc orthophosphate, reacts with lead and copper to form solid compounds that remain solid and not dissolve in water. Its ability to control lead and copper release depends on factors like orthophosphate concentration, pH, DIC, and corrosion scale characteristics, such as the presence of other metals like iron or aluminium (Figure 5).
Figure 5:Total phosphate through events (1,2,3).
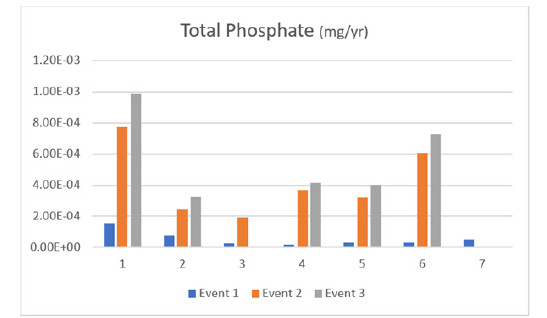
Figure 4 displays the total phosphate detected at each site during all 3 events. The pattern of total phosphate is similar to orthophosphate in that it increases over time at each site, with site 1 increasing more rapidly.
Total phosphate, a crucial nutrient for plant growth, is composed of orthophosphate, polyphosphate, and organic phosphorus. It is essential for soil nutrients and animal and plant bioplasm. However, excessive phosphorous in water can lead to algae mass reproduction, organism death, and eutrophication. Water total phosphate is typically expressed as milligrams of phosphorus per liter of water (mg/L of P) (Figure 6).
Figure 6:Nitrate through events (1,2,3).
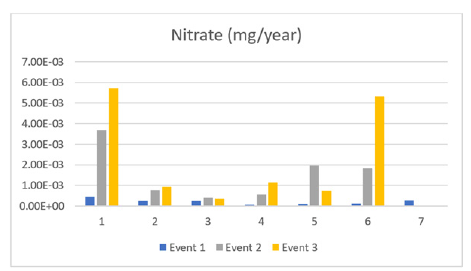
Nitrate measured in the lake displayed a slightly differing pattern compared to other contaminants. The general pattern of sites 1, 2, 4, and 6 is that nitrate amounts increased over time with sites 1 and 6 increasing at a rapid rate. The pattern of sites 3, 5 and 7 show an increase, peak in contamination and then decrease. These results express a contradiction to one another as to whether the source is a point source or a non-point source; further sampling is needed. Nitrate-rich effluents in receiving waters can cause algae growth, deteriorating water quality, and potentially causing infant methemoglobinemia while nitrite concentrations rarely exceed 0.1mg/L.
Nitrates in drinking water can have potential health effects depending on exposure, duration, age, and pre-existing health conditions. Most people are not exposed to nitrates, but elevated levels are a concern for bottle-fed infants under six months old who haven’t developed the ability to digest them. This can lead to methemoglobinemia or blue-baby syndrome, affecting oxygen levels and causing bluish skin. If nitrate levels exceed 10mg/L, use different water supplies for baby formula and food, or use readyto- use formula.
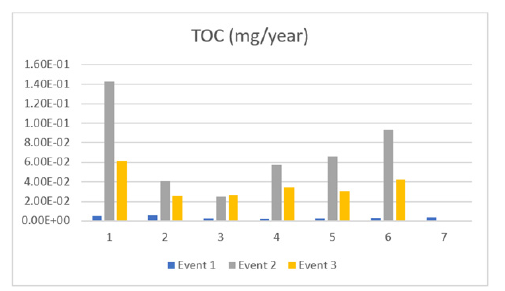
After the calculations were conducted it was clear that TOC initially increased at all sampling sites, peaked at event 2 and then decreased. Figure 7 displays this pattern and suggests the source is a point source which will eventually run out. TOC is the amount carbon atoms tied up in organic compounds in a water sample, and it is a non-specific indicator of water quality (because pure water contains NO carbon). High TOC concentrations can lead to oxygen depletion in water, causing fish and aquatic animals to die. TOC can be measured directly in water samples by treating it with chemical oxidants and measuring the released carbon dioxide. Total organic carbon leads to DBPs, which leads to bladder cancer and possibly reproductive problems in water drinkers. So, reducing total organic carbon in untreated drinking water is a top priority for the EPA and water managers.
Figure 7:Total organic carbon through events (1,2,3).
DOC is displayed in Figure 8 which expresses the pattern of increasing, reaching a peak and decreasing similarly to TOC. This again means the source is likely a point source and will not contaminate the lake forever. DOC is crucial in the carbon cycle and a primary food source for aquatic food webs, affecting ecosystem chemistries and contributing to acidification in low-alkalinity freshwater systems. Chlorine disinfection plants face concerns over DOC concentrations due to harmful by-products from chlorine reaction with organic matter, which can cause aesthetic issues and increase bacterial regrowth in the distribution system.
Figure 8:Dissolved carbon through events (1,2,3).
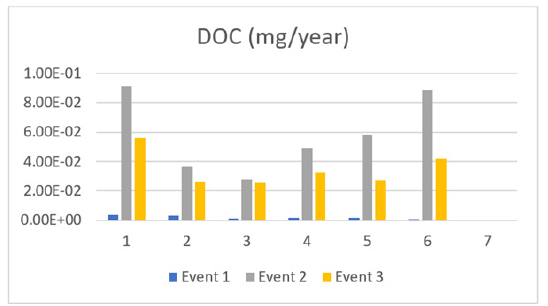
DOC in finished water can lead to aesthetic problems and increase the potential for bacterial regrowth in the distribution system, some of the most common aesthetic issues are bags under the eyes, dark circles, wrinkles in the periocular and upper midface areas, Excess fat in the eyelids, tired eyes and droopy eyelids, loss of facial volume, sunken cheeks, reduced facial contours and structure and reduced skin quality.
Figure 9 highlights the large increase in total coliforms in almost all the sampling sites over time, this increase is relatively large and is thus alarming. Total coliform counts indicate the sanitary condition of a water supply, encompassing bacteria found in soil, surface water-influenced water, and human or animal waste. The test for total coliform bacteria is the most basic test for bacterial contamination in water supplies. Total coliforms include bacteria found in soil, surface water, and human or animal waste. Fecal coliforms, present in the gut and feces of warm-blooded animals, are considered more accurate indications of animal or human waste than total coliforms. Escherichia coli (E. coli) is the major species in the fecal coliform group, as it is generally not found growing and reproducing in the environment. E. coli is considered the best indicator of fecal pollution and the possible presence of pathogens, as it is the only species of coliform bacteria that is generally not found growing and reproducing in the environment. When coliforms have been detected, repairs or modifications of the water system may be required. Boiling the water is advised until disinfection and retesting can confirm that contamination has been eliminated. A defective well is often caused when coliform bacteria are found in well water (Figure 10).
Figure 9:Total coliforms through events (1,2,3).
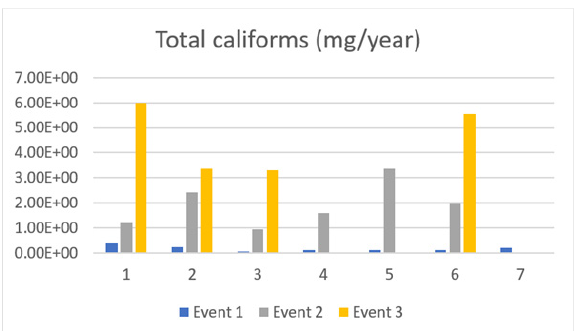
Figure 10:E. coli through events (1,2,3).
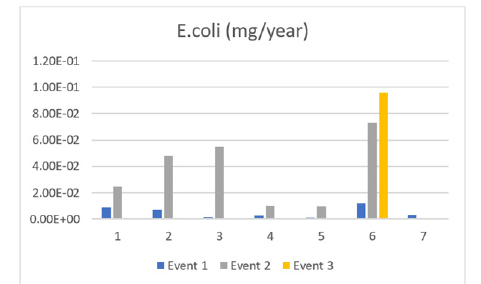
The data collected showed very little amounts of E. coli contaminating that lake at all 6 sites excluding site 7 which saw an increase over time. These values are not alarming as the low value means most or all will be filtered out of the drinking water b the water treatment plant. E. coli in water suggests fecal contamination and potential disease-causing pathogens like bacteria, viruses, and parasites, although most strains of E. coli are not pathogenic. E. coli strains can cause diarrhea, urinary tract infections, respiratory illnesses, pneumonia, and other illnesses, despite most being harmless. Healthy people infected with E. coli usually feel better within a week. But some people have a serious complication called hemolytic uremic syndrome, which affects the kidneys. This is more likely to happen to older people and children. Saint John has a history of E. coli, this year alone, 2023, the city has shut down at least 4 lakes due to the high concentration of E. coli present in the city’s waters.
Conclusion
The overall data reflected the water at Loch Lomond Lake as safe and drinkable. However, the increase of orthophosphate and total phosphate can be concerning overtime. The value of total coliforms during the last event can also be alarming, especially with the pattern in which it is increasing. More effort in providing clean, drinkable and safe water is highly encouraged; distillation and reverse osmosis are ideal methods for purifying water, while boiling and bleach are second choices.
This study also shows the importance of septic systems since they are often cited as an important contributor to rural watershed nutrient loads. One of the important reasons there is a decline in the water quality and an increase in the total coliforms is the quality of septic tanks, because any leaks can affect and harm the water at a rapid rate.
High nutrient loads like phosphorus have reportedly led to lake eutrophication in the past, to avoid this happening to the city’s largest drinking water source extra measures should be taken. To ensure the nearby septic systems, remain intact and are not leaking measure be conducted to measure for artificial sweetener acesulfame, if this is detected in the storm runoff, its only source would be a leaking septic system. This will allow the city to locate the exact failed system and request for it to be repaired.
References
- Teranet Inc (2014) Polaris parcel boundary data, Toronto. U.S. EPA, 2018. Septic systems overview.
- Oldfield L (2019) Estimation of nutrient loads from septic systems to tributaries in the Lake Erie basin. Master’s Thesis. University of Western Ontario. Electronic Thesis and Dissertation Repository, p. 6057.
- Government of Ontario (2019) Ontario Regulation 332/12: Building Code.
- Meinikmann K, Lewandowski J, Hupfer M (2015) Phosphorus in groundwater discharge-a potential source for lake eutrophication. J Hydrol 524: 214-226.
- Foolad M, Ong SL, Hu J (2015) Transport of sewage molecular markers through saturated soil column and effect of easily biodegradable primary substrate on their removal. Chemosphere 138: 553–559.
- Holman IP, Whelan MJ, Howden NJK, Bellamy PH, Willby NJ, et al. (2008) Phosphorus in groundwater—an overlooked contributor to eutrophication? Hydrol Process 22(26): 5121-5127.
- Lusk MG, Toor GS, Yang YY, Mechtensimer S, De M, et al. (2017) A review of the fate and transport of nitrogen, phosphorus, pathogens, and trace organic chemicals in septic systems. Crit Rev Environ Sci Technol 47(7): 455-541.
- Ma L, Liu Y, Xu J, Sun H, Chen H, et al. (2017) Mass loading of typical artificial sweeteners in a pig farm and their dissipation and uptake by plants in neighboring farmland. Sci Total Environ 605-606: 735-744.
- Lowe KS, Rothe NK, Tomaras JMB, DeJong K, Tucholke MB, et al. (2009) Influent constituent characteristics of the modern waste stream from single sources. Water Environment Research Foundation, Alexandria, Virginia, USA.
- Malott S, O’Carroll DM, Robinson CE (2016) Dynamic groundwater flows and geochemistry in a sandy nearshore aquifer over a wave event. Water Resour Res 52(7):5248-5264.
- McCobb TD, LeBlanc DR, Massey AJ (2009) Monitoring the removal of phosphate from ground water discharging through a pond-bottom permeable reactive barrier. Ground Water Monit Remediat 29(2): 43-55.
- Naranjo RC, Niswonger RG, Smith D, Rosenberry D, Chandra S (2019) Linkages between hydrology and seasonal variations of nutrients and periphyton in a large oligotrophic subalpine lake. J Hydrol 568: 877-890.
- Kahl S, Kleinsteuber S, Nivala J, Van Afferden M, Reemtsma T (2018) Emerging biodegradation of the previously persistent artificial sweetener acesulfame in biological wastewater treatment. Environ Sci Technol 52(5): 2717-2725.
- Knobeloch L, Salna B, Hogan A, Postle J, Anderson H (2000) Blue babies and nitrate-contaminated well water. Environmental Health Perspectives 108(7): 675-678.
- Dunk MJ, McMath SM, Arikans J (2008) A new management approach for the remediation of polluted surface water outfalls to improve river water quality. Water Environ J 22(1): 32-41.
- Lange FT, Scheurer M, Brauch HJ (2012) Artificial sweeteners –- a recently recognized class of emerging environmental contaminants: a review. Anal Bioanel Chem 403(9): 2503-2518.
- Holman IP, Whelan MJ, Howden NJK, Bellamy PH, Willby NJ, et al. (2008) Phosphorus in groundwater—an overlooked contributor to eutrophication? Hydrol Process 22(26): 5121-5127.
- Domagalski JL, Johnson HM (2011) Subsurface transport of orthophosphate in five agricultural watersheds, USA. J Hydrol 409(1-2): 157-171.
- Kidmose J, Engesgaard P, Ommen DAO, Nilsson B, Flindt MR, et al. (2015) The role of groundwater for lake-water quality and quantification of N seepage. Groundwater 53(5): 709-721.
- Lapointe BE, Herren LW, Paule AL (2017) Septic systems contribute to nutrient pollution and harmful algal blooms in the St. Lucie Estuary, Southeast Florida, USA. Harmful Algae 70: 1-22.
- Lewandowski J, Meinikmann K, Nuetzmann G, Rosenberry DO (2015) Groundwater-the disregarded component in lake water and nutrient budgets. Part 2: effects of groundwater on nutrients. Hydrol Process 29(13): 2922-2955.
- Meile C, Porubsky WP, Walker RL, Payne K (2010) Natural attenuation of nitrogen loading from septic effluents: spatial and environmental controls. Water Res 44: 1399-1408.
- Nielsen P (2009) Coastal and Estuarine Processes. World Sci, Singapore.
- Oppenheimer J, Eaton A, Badruzzaman M, Haghani AW, Jacangelo JG (2011) Occurrence and suitability of sucralose as an indicator compound of wastewater loading to surface waters in urbanized regions. Water Res 45(13): 4019-4027.
© 2024 Ikrema Hassan. This is an open access article distributed under the terms of the Creative Commons Attribution License , which permits unrestricted use, distribution, and build upon your work non-commercially.
 a Creative Commons Attribution 4.0 International License. Based on a work at www.crimsonpublishers.com.
Best viewed in


.jpg)


 Editorial Board Registrations
 Submit your Article
 Refer a Friend
 Advertise With Us
.jpg)


.jpg)


.bmp)
.jpg)
.png)
.jpg)


.jpg)


.png)

.png)


.png)


