- Submissions

Full Text
Advancements in Civil Engineering & Technology
Design and Its Implication on the Quality of Indoor Office Environment
Kamal Jaafar1* and Youssef El Hello2
1Associate Professor, Faculty of Engineering and Information Science, University of Wollongong in Dubai, UAE
2PhD Student, Faculty of Engineering and Information Science, University of Wollongong in Dubai, UAE
*Corresponding author:Kamal Jaafar, Associate Professor, Faculty of Engineering and Information Science, University of Wollongong in Dubai, Knowledge Park, Dubai, UAE
Submission: October 11, 2023;Published: November 01, 2023

ISSN: 2639-0574 Volume5 Issue5
Abstract
Maintaining control over the environment is one of many healthcare challenges when it comes to patient safety. A few of those environmental factors are infection control, air quality and control over the energy. To establish a solution to these issues, it is important to monitor the effect of the design, and this is achieved by controlling different parameters using BIM tools (Ozel 2008, [1]). With BIM, it is possible to simulate a wide variety of scenarios and the information obtained can be used to analyze and potentially develop a healthier environment. The purpose of this study is to be able to understand the different design parameters which contribute to a healthier indoor environment in terms of Indoor Air Quality and to be able to simulate parameters such as air temperature, air flow rate, room dimensions and air velocity, in order to obtain and analyze the data to identify how specific changes can have an impact on the environment. Hence, the purpose is designing to obtain and maintain a healthier environment.
Keywords:Design layout; Simulation; Build in environment; Air quality
Introduction
Building information modelling (BIM) is a 3D modelling process which provides anyone of interest, such as engineers and architects, with tools to be able to design, plan and manage the construction of any type of infrastructure. Due to the ability of BIM to store all relevant information related to a project in a single model, the use of BIM has drastically increased over the past few decades, which in turn means that it is key for civil engineers to keep up with the knowledge required to use the latest technologies being applied in the construction industries.
In addition to BIM, Computational Fluid Dynamics (CFD) is the most ubiquitous software to simulate and evaluate indoor environments in all fields. Despite the benefit of accuracy obtained from traditional measurement methods, the CFD software provides individuals with the advantage of creating an environment that is not only more comfortable, but also healthier. Yang [2] CFD has gained momentum in relation to the domain of building environments, encompassing such areas as Indoor Air Quality and HVAC, as well as natural and mechanical ventilation. Thus, with the use of CFD one can easily verify design solutions [3].
A study conducted by Huizenga et al. [4] to determine air quality and thermal comfort revealed that despite the tireless efforts of experts to create an environment that was comfortable, only 39% of the participants in the survey of the occupants of 215 building in US, Canada and Finland expressed their satisfaction with the results of said experts.
Unequivocally, the most reliable method one could use to procure the most accurate depiction is through actual measurements. However, such a method is not feasible, as it is toxic, time- consuming and above all expensive in regard to extensive parametric studies. The CFD software is more frequently used in comparison to the experimental approach to analyze Indoor Air Quality issues by computing the airflow and pollutant distributions in buildings, in order to arrive at a numerical solution of the flow behaviour [5]. Hence, with the usage of CFD to simulate indoor environments, resources can be better allocated by saving manpower and material resources. Moreover, another benefit of such a software is that the parameter of airflow can be visually demonstrated to individuals. As a result, the rationale behind the indoor layout could be evaluated in such a context leading to a more comfortable and healthier environment [2].
The prevalence of the concept of indoor air quality has become a hot topic of discussion, attracting the interest of environmentalists and academics, as well as the community as a whole. It is known that individuals spend the majority of their day indoors. This is especially true since the onset of the COVID-19 pandemic. When the pandemic first hit, most individuals around the globe were in complete lockdown, many even transforming their homes into a workplace, in the attempt to mitigate the spread. Hence, it is a given that the world is spending more time indoors than they would have under normal circumstances, sparking the need to ensure good indoor air quality and comfort. Dubai’s population in particular is growing at a fast pace, resulting in Dubai becoming increasingly densely populated. There is a positive correlation between an increase in a population that remains indoors and the need for a significant increase in indoor air quality. In other words, the more people, the higher the importance of indoor air quality [6].
The main area of interest in regard to the research is to investigate how design could impact the health and safety of individuals in terms of Indoor Air Quality. It is relevant especially in today’s world due to the outbreak of a pandemic called coronavirus or otherwise known as COVID-19, which has thus brought back an interest in the precautions taken to prevent such diseases from being spread. This reflects the importance of infection control of a healthcare facility as being vital in maintaining the number of hospital infections. With that being said, throughout this project the use of Autodesk simulation software or Revit simulation can be used to simulate different design alternatives in order to see how these different scenarios can impact the quality and the movement of the air inside the area of interest. The study of airflow is an important point when it comes to controlling the contamination of infectious airborne diseases within a healthcare facility. Therefore, when designing a room in a healthcare facility or even the hallway from the entrance to the room required for the patient, it is important to ensure that the chances of the infection being spread is at the lowest rate possible.
Heating, ventilation and air conditioning (HVAC) is a field that needs to be highly considered when designing or selecting suitable ventilation for the necessary use. HVAC in hospitals is usually mainly focused on when it comes to designing critical care units such as operation theatres and isolation rooms. This is because the spread of some infections can be prevented by separating the infected patients from the ones who are not infected. That is the reason why a well-designed isolation room is chief when it comes to infection control. HVAC can also be used when designing rooms outside of the healthcare facility, as it has been stated by international case studies that maximizing on the use of natural ventilation can reduce the chances of getting a respiratory illness by 9-20% [7].
One should be cognizant that a critical safety and health issue on the rise is indoor air quality. There are pivotal factors that ought to be considered which have an impact on the level of indoor air quality, including temperature, ventilation, humidity, chemical pollutants and sources, as well as biological sources [6]. According to Zhang and Smith [8], UAE residents spend a predominant percentage, approximately 90%, of their time indoors, be it at home, work or recreational facilities such as shopping malls. One possible explanation to such a high percentage of time being spent indoors is the fact that the UAE climate is unbearably hot and humid most months of the year, with temperatures reaching upwards to 52 degrees Celsius. It is worthy to note that the study conducted by Zhang and Smith dates to 2003, 17 years pre-COVID. Thus, indoor air quality has gained increasing importance.
Research Question and Methodology
The topic of interest is how to design a healthier and safer indoor building environment, by using the help of BIM and a CFD software to understand how different design parameters an impact on the health and safety of individuals in an indoor environment can have when it comes to the quality of the air. The aim is to perform extensive research into previous cases studies and journals that focus on the effect of parameters such as the Indoor Air Quality, rate of airflow, geometry and dimensions of the room according to different standards, humidity and temperature of the air and thermal comfort and how these parameters have can have a potential impact on an individual. The model will be created using Autodesk Revit 2019 and Autodesk CFD will be used as the simulation software. The initial design data will be obtained from the research, and then further experimental data will be used from the result of manipulating different parameters.
Literature Review
Sarkar and Bardhan [9] addressed various design parameters to study their impact on the Indoor Environmental Quality (IEQ). The main idea of the study was to find a way to have an optimum design for a low-income apartment in India and to examine how different designs can play a role in having an effective IEQ. It was stated that the design planning policies in India need more attention, as sustainable design strategy is one of the major unseen areas in India. The main parameters that influence the IEQ which were focused on in this paper were the air temperature and the concentration of different pollutants, as well as the indoor air velocity. Two different space constrained compounds were chosen, and a wide range of interior layouts were taken into consideration. The interior architectural parameters as well as the design variables were manipulated to assess different scenarios. Some examples of these are the position of furniture, the height of the ceiling and the location of a partition wall, as well as the effect of a heat source such as a cooking stove.
The study involved the use of CFD simulations, and the data was originally collected using an in- situ sensor. The sensor was paired with a step-by-step simulation which involved the use of parameters that can be varied according to the simulation. The main reason behind the research was to vary different design parameters of two low-income apartments in India to achieve optimum results in terms of factors such as indoor air quality as well as indoor environmental quality. It was stated that the conditions considered were natural ventilation. As previously mentioned, the study used a computational simulation using the data gathered from the insitu sensor which was used. The study also involved the use of numerical analysis to a certain extent.
This research showed the importance of how a wellplanned design can have an impact on the indoor environmental sustainability, especially in the low-income areas, which is one of the major areas that do not receive emphasis in Indian design policies. It is stated that the data obtained from the research is not necessarily the optimum solution. However, it is a practical method which can be applied in the building design guideline in order to help certain professions such as the urban planner, the architect and the building engineers in design habitats with decent indoor environmental sustainability in low-income areas.
It was mentioned that there are a limited number of studies which emphasize how the design parameters are linked with the indoor air velocity. Therefore, factors such as thermal comfort can be improved by optimizing the interior design parameters. The results obtained from the research stipulate that the indoor air quality as well as the indoor environmental quality in a residential area can be improved by using appropriate interior design layouts obtained from varying design parameters [9].
Sujanova et al. [10] addressed how design strategies play a role in accomplishing reasonable energy efficiency and an indoor environment which is healthy. This study considered more than 300 different sources, which include case studies, reports, journals, conferences and books, etc. The study obtained the necessary information from the sources, which presented how an indoor environment can be made healthier and more energy efficient. In addition, the paper also considered research on how the indoor environmental quality can be established by using different technological approaches as well as how the indoor environment quality and the occupant of that environment are related. The productivity, comfort and the health of the occupant can all be affected by a change in the IEQ.
The paper discussed the process that can be done in the indoor environment at the different building design stages. The paper also addressed the relationship between the building design and how it can play a role in the IEQ and the behavior of the occupant. The main focus was the different design factors that can play a role in the IEQ and how to design a healthy environment based on certain different requirements.
The results obtained from this paper were that it is essential to consider the interconnections in an indoor environment obtained from design parameters making the environment healthier, more comfortable and energy efficient. The paper also highlighted the importance of how various parameters can be varied in order to examine the IEQ performance in terms of factors such as visual and thermal comfort and the Indoor Air Quality (IAQ). It was also stated within the paper that the well-being and satisfaction of the occupant in the indoor environment can be affected by a change in other parameters such as the building design as well as the type and amount of space provided. It was also concluded in the paper that having poor IEQ and building design could negatively affect productivity and health and increase the number of sick leaves taken by the occupant in the indoor environment [10].
Seppanen and Fisk [11] in 2006 looked into how health and performance can be impacted by the quality of an indoor environment. They analyzed the effect of ventilation rates and how this plays a role in reducing the number of sick leaves taken by an individual. In addition, this paper also analyzed main different relationships such as how the room temperature, ventilation rates and air quality could all affect the performance of an individual and how the room temperature can display/counter Sick Building Syndrome otherwise known as SBS.
The paper used existing data from other available sources to create some models, when necessary, as well as review and discuss calculations from other papers on the cost of having a poor indoor environment. These calculations indicated that when discussing the same building, the cost for ventilation is higher than the cost of having poor IEQ. This means that improving the air quality indoors is cost efficient when considering the advantages of having a higher quality IEQ on the productivity and health of the individual.
This paper discussed an estimate of the cost in the calculations conducted when considering how the room temperature, ventilation rates and air quality can affect the performance of an individual, as well as how the room temperature can display/counter SBS and the effect of ventilation rates in reducing the number of sick leaves. It was stated that having low ventilation rates will result in a higher number of airborne diseases present in the air. Therefore, increasing ventilation rates will reduce the number of sick leaves. From previous research, the paper highlighted that better building design decisions will directly increase the productivity and health of the individual.
The research conducted in this paper demonstrates that the productivity of an individual decreases when there is a presence of SBS symptoms. It also shows that it is possible to quantitatively predict how a variation in factors such as the room temperature, the indoor air quality and the ventilation rates can have an impact on the individual in terms of their productivity and health, hence creating a relationship between different design factors and how they play a role on creating a healthier indoor environment [11].
Alibaba [12] in 2016 used in his research dynamic thermal simulation in order to analyze the performance of a building, which in this case it considers offices in a hot climate. The location considered in this paper was Famagusta, Cyprus. The simulation software that is used is EDSL Tas and is considered as one of the best options to simulate a dynamic thermal situation as it takes into consideration certain ASHRAE standards as well as has the ability to do simulation for fully glazed windows. The simulation can show the heat loss or gain from the windows which could be used to analyze the thermal comfort of the offices.
The first analysis performed showed that having a Window to
Wall ratio (WWR) of 20% while also having a certain type of glazing
could significantly reduce the cooling/heating energy demand by
nearly 35%. It was also stated that the building geometry and
envelope plays an important role in the indoor climate of the
building. Having a well-considered amount of natural ventilation
will not only improve the IAQ but it will also reduce the cooling
loads. The paper simulated and analyzed different proportion of
openings of the windows, this proportion was based on factors
such as season, the time of day and even the outside temperature.
It was stated in this paper that having large windows in offices
will somewhat balance the energy used for cooling the building
as well as the lighting since larger windows allow more light into
the building. This paper also highlights that the average predicted
percentage of dissatisfied (PPD) and predicted mean vote (PMV)
needs to be acceptable in order to achieve a reasonable annual
thermal comfort when talking about an office environment, if
that is achieved then the office environment could be considered
as sustainable. It took into consideration four categories from the
mentioned standards, those four categories are:
A. PPD <6% and PMV ( -0.2 to 0.2)
B. PPD <10% and PMV (-0.5 to 0.5)
C. PPD < 15% and PMV (-0.7 to 0.7)
D. Anything above category c
These categories were examined based on a wide variety of window to wall ratios and also a variety of window opening percentages for different monthly thermal data in order to get sustainable naturally ventilated offices. The reason for doing such simulations is to provide designers advice on how to maximize the thermal comfort for the occupants.
Many situations were simulated; hence, a wide range of results were obtained. One result obtained from the simulation, taking into consideration of all Window to Wall Ratios (10% all the way to 100%) with a 0.1 window opening showed that when taking the average for the whole year the best thermal comfort was in category C which was 31.47%. It was also noticed that increasing the ratio of which the window is open will have an impact on the thermal comfort in a positive manner. It was also mentioned that the best performances were between the months April-June and between September-November.
Since it’s known that the best performances were during the months mentioned above, the following results are only based off these months with the WWR held constant at 10%. When considering category A, they concluded that the maximum thermal comfort was in May with it being 45% and the window open ratio was 0.7, and the lowest being 43% at 0.2 and 0.5. Whereas in October the max thermal comfort was 43% at 0.2 and minimum was 40% at 0.7. When considering category B, it was stated that the highest thermal comfort was in May with it being 93% at 0.2 and lowest in June at 32% with 0.1 being the window open ratio. This paper concludes that it is possible in a sense to simulate the thermal comfort of a building environment, when considering the Window to Wall Ratio and the Window Open ratio, doing so will successfully aid the designer’s decisions at the preliminary stages in order to obtain the best possible Indoor Air Quality as well as lower energy consumption of a building [12].
Summary
In conclusion, after conducting research and preparing a literature review on the selected papers discussing a research problem similar to problem addressed in this paper, it is possible to state that there are a wide variety of journals, articles and conference proceedings discussing different design parameters and how they can create a healthier indoor environment. However, there is a gap in the literature when it comes to exactly how certain design parameters such as geometry, openings and temperature can be simulated using BIM in order to improve the indoor air quality and indoor environment quality.
Research Methodology and Framework
The key methodology used in this paper is based upon literature review of previous studies and acquiring the necessary information needed in order to prepare a computer model which is suitable for simulation in order to obtain the needed results. Computer modelling is one of the quickest ways to analyze different data which is used in research. The literature that has been reviewed was mostly based on results which have been gathered by carry out an experiment and from people who have experience within that particular topic of interest. In other words, it is not what the author believes that could happen, it is what is actually happening. Other studies reviewed are based on surveys conducted on a different relevant group related to the study in order to obtain their feedback from their day-to-day life and for the authors to provide recommendations for the future.
The main purpose of this study is to understand how different design parameters can be used in order to achieve a safer and healthier indoor building environment. From the literature it can be seen that some of those parameters are the thermal comfort, acoustic comfort and the main parameter being Indoor Air Quality (IAQ). Firstly, it was important to understand the theoretical explanation on how different factors play a role on the indoor environmental quality. The obtaining of necessary information from sources discussing about topics in the area of interest, which presented how an indoor environment can be made healthier and safer, can be achieved by researching into case studies, reports, journals, conferences and books, etc. Once the initial research is done and an understanding of the main concepts are obtained, it will help with being able to understand and analyze the results gathered from the simulation to be able to state whether or not the results obtained are sufficient or not.
This paper will show how the use of BIM can be applied in design in order to assess whether or not a building environment can be considered healthy and safe. The main software that is going to be used in this study is Autodesk Revit 2019 to construct the model. Then the model will be exported to an application called Autodesk CFD 2020, as it has many features integrated into it which makes it suitable for this analysis of Indoor Air Quality. However, it is important to note that Autodesk CFD has limitations as well to what it can simulate, meaning that the factors to be simulated are limited without the help of other aiding software. One main advantage of using BIM is that it is able to provide a wider image on how the architectural design of a room, for example, can be linked with the performance of the indoor environment. This can be mainly used in the design phase to make the designing process more efficient, meaning that the quality of the indoor environment can be improved in the design stage by running simulations in the simulation software and analyzing the data before the actual construction of the project [13].
Over the years BIM has changed how engineers and building designers go about designing buildings, as it helped with making the work easier for them in terms of allowing them to analyze their framework efficiently because it allows for obtaining the results faster than the traditional techniques [14]. BIM also allows engineers to make ideal decisions in terms of the design, which will result in a higher quality of the final product and a more detailed construction plan. Some of the main design factors that will be focused on is the Indoor Air Quality and the thermal comfort of the indoor environment, basically in terms of how factors such as the indoor temperature and the indoor humidity can affect the environment indoors.
The idea of this study as mentioned before is to test different designs parameters whether it be the geometry of the indoor section, the location of openings, the temperature of the indoor environment and even the average air velocity in different locations. This is an iterative proses as shown in Figure 1, which means that the BIM software, which is Revit 2019, will be used to create a model of an indoor environment which is going to be working offices located in the Dubai, United Arab Emirates. Once the model is done, it is exported into Autodesk CFD in to apply the inflow rate of air can be inserted into the software in order to conduct the testing. While in the modelling stage it is possible to vary the room parameters which include the total area of the room and the height of the ceiling and partitions for example, the number of openings required, the type of openings used the material of the walls etc. Once all this information is input into the software, the indoor environment performance analysis is conducted and depending on the results obtained the model can be varied until an ideal indoor environment in terms of Indoor Air Quality and thermal comfort is created. Using BIM with this iterative proves allows for the inspection of design aspects in order to create an optimal design solution before actually giving a final design proposal [13]. This in turn will improve the performance of the building and also the wellbeing of the occupant.
Figure 1:Framework of project using BIM.

Plan for Sampling & Data Collection
As mentioned in the previous section the use of Autodesk Revit 2019 and Autodesk CFD are the key components of the simulation process, as it has many integrated tools, such as the ability to insert an initial airflow rate for testing of thermal comfort. The ventilation of the air in the indoor section is important as well, as it plays an important role in assessing the IAQ of the indoor environment as well as the total energy used by the building. Revit also has a feature that allows the user to state the location of the model, this helps with the analysis of the IAQ, as the outdoor climate also plays a role in determining a suitable indoor environment.
A range of general dimensions of the office sectors will be obtained from the UAE building standards, as well as multiple different air flow rates. The area of the room can be varied in many ways, such as the use and positioning of partitions and also the height of the ceiling. However, the offices that were simulated did not include partitions, since they were small private offices and there was no need for a partition within the rooms. A variety of different models will be simulated until the data collected in the form of figures and reports generated by Revit 2019 meets the necessary requirements in terms of IAQ and thermal comfort, which basically consists of the room temperature, the indoor humidity, the airflow rates and a low CO2 concentration being present indoors. These values will be referred to against the optimum ranges found from previous studies to see whether or not the values are acceptable, with the airflow rates being compared to different standards such as ASHARE and Dubai Healthcare Authority. If the values are not as desired, modifications will be made to the model in order to obtain the required values.
Description of full-scale experiment
Full-scale measurements of air temperature for a typical room subjected to displacement ventilation were performed by Li et al. [15]. The air temperature was measured by 30 thermocouples located along a single vertical pole inside the test room. The thermocouples were distributed along the vertical pole with a higher concentration near the floor and ceiling. The interior surface temperatures were measured by 22 thermocouples, five on each wall, one on the ceiling and one on the floor. Two thermocouples measured the inlet and outlet air temperatures. Five thermocouples also measured the exterior surface temperature of the walls and the ceiling. The measurement uncertainty was estimated to be ±0.1 °C.
In this experiment done by Li et al. [15], the impacts of different parameters such as heat load, wall emissivity, inlet flow rate and inlet air temperature were investigated through different cases. The experimental data for cases were reported more completely than the other cases. The focus of this paper is on case B1 for which the largest amount of experimental data was provided. In addition, this case had the lowest air change rate (n). Therefore, the air was supplied with a lower velocity and as a result, the flow was not a jet-type flow, which is important in this paper to investigate the stratified properties of air in the room. For this case, the inlet (Ti) and outlet air temperatures (To) were 19.0 °C and 27.3 °C, respectively.
Description of models
Figure 2:Floor plan of square office.
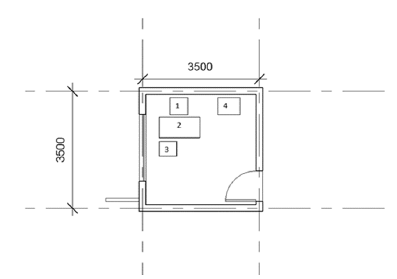
The model that will be simulated is a small private office which is located in Dubai, United Arab Emirates. The office that is being tested has an area of 12m2, which is within the range to be considered as a small private office. Two different office geometries are being simulated and compared, keeping in mind that they need to both be the same area. With that being said, the two offices are a square office (3.5m x 3.5m) and a rectangular office (4.8m x 2.5m). Since the office is considered a work environment, the height of the ceiling of the model is 2.7m, which abides with the Dubai Healthcare Authority’s standards for space dimensions. A floor plan sample of the model can be seen in the Figure 2 below, with block number 1 being a simplified version of a human, block number 2 being a simplified version of a desk, block number 3 being a simplified version of a chair and lastly block number 4 being a simplified version of a chest of drawers.
The reason for simplifying the indoor architecture into blocks was to avoid addition of unnecessary simulation time caused by extremely detailed meshing of the components. The following table illustrates the different scenarios that are going to be simulated (Table 1).
Table 1:Simulation Scenarios.

In order to determine the Air Changes per hour, one must know the ventilation rates which are being applied to the indoor area. The minimum ventilation rates depend on the number of occupants and the type of environment the occupant is in. The table below is the ASHRAE-62 standards for minimum ventilation rates, which in this case will be 17cfm/person and 8.5 Liters per person (Table 2).
Table 2:ASHRAE standard 62- minimum ventilation.
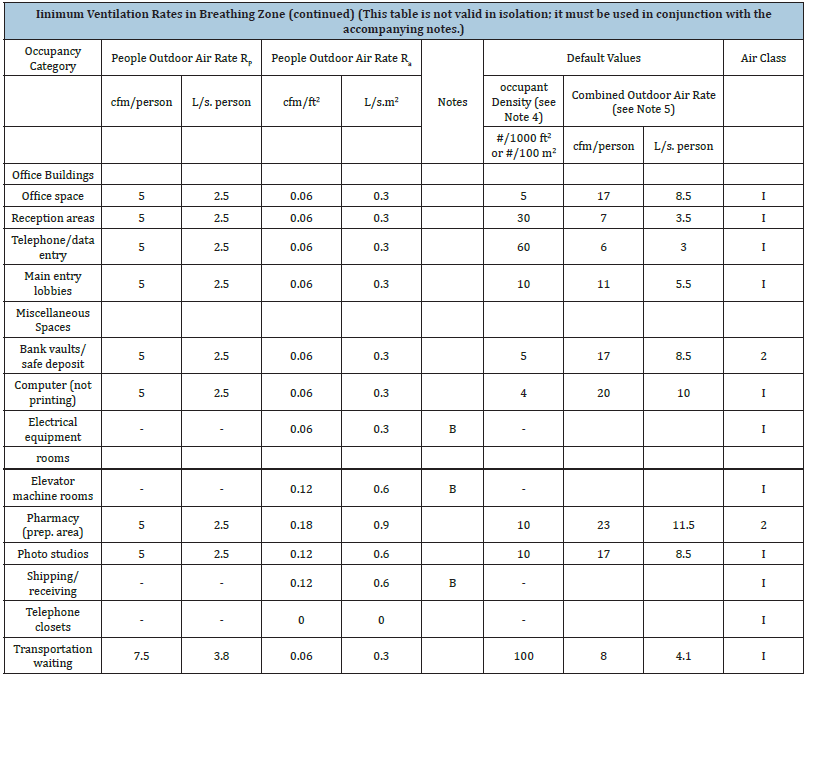
Cubic Feet per Minute (CFM) is a unit which represents the air flow of an environment. Once the dimensions of the room and the CFM is known, it is possible to calculate the average the Air Changes per Hour of that room simply by multiplying the cfm by 60 and dividing the total amount by the total volume of the room in feet. It is said that the more ACH there is, the better the overall ventilation of the room.
In this case the volumetric flowrate needed to achieve 4 ACH
and 6 ACH is 80cfm and 115cfm respectively, which are both above
the minimum standards for air changes per hour as well as the
ventilation rate.
A. In addition, there are several assumptions which were made
to the model in order to simply the problem in hand, some of
which are as follows:
B. The indoor air flow is assumed to be a steady state flow.
C. The room is considered to be an airtight room to avoid the
need to take in to account the impact of air leakage.
D. The air indoor abides with the Boussinesq theory, which states
that the density of the fluid will only have an impact on the
buoyancy lift.
Autodesk CFD has many embedded equations which are
relevant to the flow of different fluids. Once the model is loaded in,
the boundary conditions and material assignments need to be made
before assigning a mesh to the model. The boundary conditions
applied to the model in this study are as follows:
Figure 3:Interior surface temperature of vertical walls at different heights imposed by user-defined functions (UDFs) in the CFD simulations.
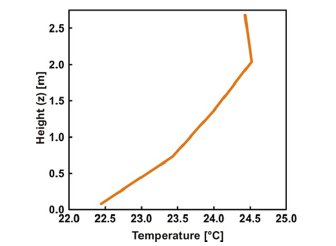
a) The air inlet was considered to be a 300mm x 300mm, with a volumetric flow rate of 80 ft3/min for the case of 4ACH and 115ft3/min for the case of 6ACH. The air temperature at the inlet was considered to be 19 degrees Celsius. The interior surface temperature of the vertical walls was provided as the average value of the measured temperatures of the walls at five different heights. In the CFD simulations, the same values were used to define the surface temperature of the walls assuming that the temperature in between these heights varied linearly with height (Figure 3).
b) The air outlet has a boundary condition following the gage pressure rule and therefore, the boundary condition is set to have a pressure of 0 Psi.
c) The west wall of the office, which also contains the window, is the only wall in the office, which is considered to be an external wall, meaning that it is exposed to the heat from outside. The boundary conditions for this wall will have a film coefficient of 3.5 BTU/ft2/h/R and the outdoor temperature will be set to 38 degrees Celsius, which is an average summer day in Dubai.
d) In order to consider the effect of the human body in the simulation, a boundary condition is set to the block in the model which represents the human. The condition is set to be a Total Heat Generation of 50W, which meets the ASHRAE standards, showing a human seated doing light work.
Figure 4:Square office meshing.
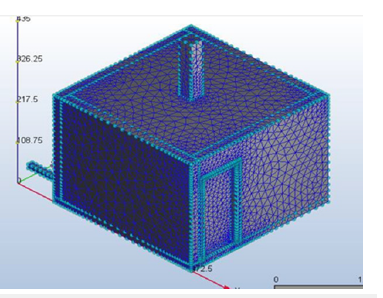
Once all the boundary conditions are set, the model is ready to be meshed in order to perform the analysis by CFD solving the equations which are already embedded in the software in order to produce results. Figure 4 shows an auto-meshed version of the square office in Autodesk CFD that is ready for simulation.
Analysis and Results
It is important to keep in mind that in this model the only heat source in the room is the occupant itself. As of the ASHRAE standard 55, the indoor air temperature in summer to provide thermal comfort is considered to be within the range of 22-25
Comparison of square office at 4ACH and 6ACH
Temperature
As mentioned before, the ventilation rates play an important role on the Indoor Air Quality of the specified environment. The first case which was analyzed was the square office under a volume flow rate of 80ft3/min. This value abides by the ASHRAE standards of minimum ventilation and is therefore technically suitable for such simulations.
Figure 5 demonstrates the temperature of the room of the square office when considering the ACH as 4. This is a Y-plane view of the room at the front of the occupant’s desk, since that is where the occupant will be located most of the time. Hence, it is the area of most importance. This figure shows that the average temperature around the occupant is approximately between 23-25 degrees Celsius, which abides by the ASHRAE standards of indoor air temperature, with the occupant itself being 27-28 degrees Celsius. It can also be seen that the area in the room with the highest temperature is the east wall, which is due to the fact that it is the only external wall in the room. The external wall was considered to be isolated, which makes the temperature decrease quite a bit in the wall itself. The figure also shows that there is a relatively low temperature of 20-21 degrees at the bottom right of the room when compared to the rest of the area.
Figure 5:Square temp at 4 ACH.
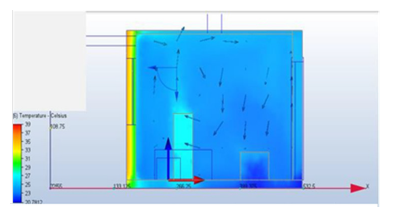
Figure 6 shows the temperature of the square office when considering the ACH as 6. These results are on a similar plane as Figure 5, which makes the results comparable. As seen in Figure 6, the temperature around the occupant is approximately 21-23 degrees, which is 2 degrees lower than the first case, making the occupant more comfortable. The temperature of the occupant itself is 26- 27 degrees, which is also lower when compared to the first case. It can be seen from the figure that there are no drastic changes in temperature when compared to the first case, which shows that the air temperature is more evenly spread, making it a better working environment.
Figure 6:Square temp at 6 ACH.

Indoor air velocity
The ideal indoor air velocity for the occupant to be comfortable is in the range of 20cm/s – 30cm/s. Changes in the air velocity around the occupant could cause discomfort. Figure 7 shows the velocity magnitude of the air on the Y-plane which is located at the center of the room. The figure shows that the highest velocity is right under the air inlet. The velocity vectors show direction of the air movement within the room on the Y-Plane. The velocity magnitude at the occupant’s desk is considered low since its less that 15cm/s, meaning that it is not necessarily suitable for occupant’s comfort and may lead to them feeling like the environment is stuffy.
Figure 7:Velocity Magnitude of square at 4ACH.
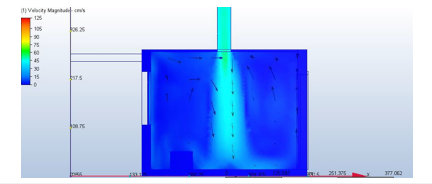
Figure 8:Velocity Magnitude of Square at 6ACH.
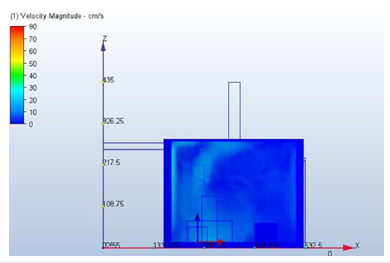
Figure 8 shows the velocity magnitude of the square office under the 6ACH condition. The figure is also based on the Y-Plane which is at the start of the occupant’s desk. It can be seen that the magnitude of the air around the occupant is roughly 20 cm/s, which is much more likely to meet the Dubai Green Building standards mentioned above. This means that in terms of air velocity, the occupant is more comfortable at his desk when compared to the environment being at 4ACH.
Comparison of Rectangular office at 4ACH and 6ACH
Temperature
It can be seen from Figure 9, in the scenario of 4ACH in the rectangular office, that the temperature around the occupant is 23- 24 degrees, which follows the ASHRAE standards. The temperature of the human is 25-26 degrees and it can be seen that the air temperature is homogenous, which means that it is very evenly spread around the room with no noticeable drastic changes.
Figure 9:Rectangular temp at 4ACH.
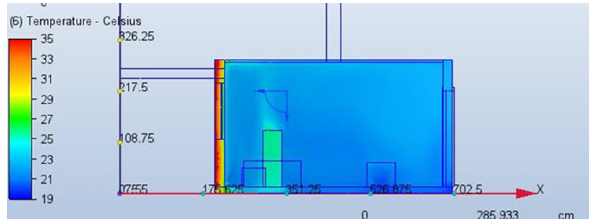
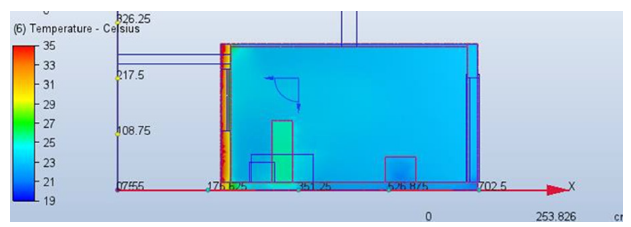
Figure 10 demonstrates how the temperature of the room is when referring to the case of the rectangular office at 6ACH. It can be seen that the temperature is slightly cooler around the occupant in the Y-plane, with the temperatures ranging from 21-23 degrees, which is slightly below the ASHRAE standards, meaning that there is a chance for the occupant to feel discomfort. When comparing Figure 9 to Figure 10 it shows that the scenario considering 6ACH has a more overall change of temperature throughout the room when compared to 4ACH. It can also be seen that the room having 6ACH is slightly cooler compared to the 4ACH.
Figure 10:Rectangular temp at 6 ACH.
Indoor Air Velocity
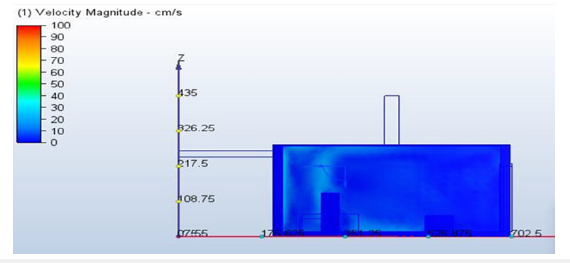
When looking at Figure 11 & 12 it can be seen that the velocity magnitude on the Y-plane is more reasonable when considering the case of 4ACH when compared to the case of 6ACH as the magnitudes around the occupant as well as the entire room in figure is in the range which is acceptable by the Dubai standards, these values of the simulation show that the velocity of air in the that case is approximately 20-30cm/s. Whereas in Figure 11 a majority of the velocity of the room on the Y-plane is considered low.
Figure 11:Velocity magnitude of rectangle at 4ACH.

Figure 12:Velocity magnitude of rectangle at 6ACH.
Comparison of Geometry
As seen from the result analysis above, Figure 5 shows that the temperature in the square office at 4ACH around the occupant the temperature is 23-25 degrees and Figure 9 shows that the temperature in the rectangular office is 23-24 degrees and it is more evenly spread throughout the room in the rectangular office. This shows that in the case of temperature at 4ACH that the occupant will feel more comfortable in the rectangular office. Moreover, in terms of the air velocity in 4ACH, Figure 11 shows that the rectangular office at 4ACH has a much better velocity magnitude throughout the room when compared to the square office at 4ACH shown in Figure 7.
When analyzing the case of 6ACH for square and rectangular offices, the temperature in the square office is better for the occupant when compared to the rectangular office as seen in Figure 6 & 10. In addition, when comparing the air velocity of both geometries, it can be seen that the air velocity around the occupant in the Y-plane is significantly better in the square office than in the rectangular one.
To summarize, after analyzing and comparing both geometries of offices, it is easy to say that for 4ACH the results are much better for a rectangular office as it only needs 4ACH to achieve optimal temperature and air velocity magnitudes needed for a healthy indoor air quality. Increasing the ACH in the rectangular offices will only case changes that are unnecessary. Whereas, for the square office, 4ACH is not quite enough, therefore better results are acquired when the ACH is changed to 6. Thus, for the indoor air quality to be improved in a square office, a higher ventilation rate is needed when compared to the rectangular offices.
Limitations
It is important to note that the results may be slightly skewed due to the insufficiency of the computer system which was used in the execution of the simulation software. This in turn created limitations in the scope of the models with which it could have potentially been applied.
Results and comparison with experiment
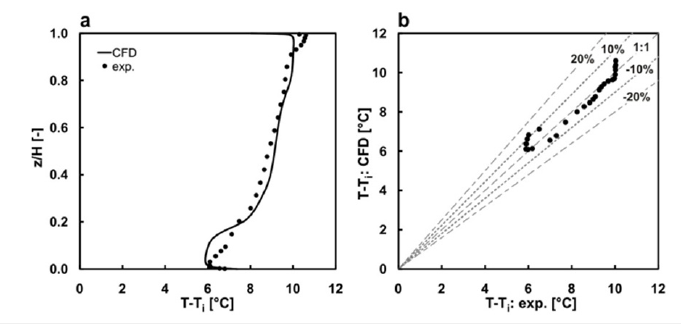
The CFD results for the reference case, which was outlined in the previous sub-sections, are compared with the full- scale measurements by Li et al. [15]. The difference between the air temperature within the room (T) and the inlet air temperature (Ti) is given as the temperature scale. Figure 13a compares the experimental and CFD results along the vertical pole. The deviations between the measurements and CFD are also depicted in Figure 13b. The general agreement is quite good. CFD underestimates the temperature near the floor and the ceiling and slightly overestimates it along the other parts of the pole. The main reason for these deviations is not clear. However, it can be related to the assumptions made for the uniform inlet velocity profile and for calculating the surface temperatures of the ceiling and the floor. The average deviation and maximum deviation of the absolute values of the temperature scale between CFD and measurements are 4.2% and 11.9%, respectively. The temperature stratification leads to a vertical difference in the air density and therefore an air flow occurs from the lower parts to the upper parts of the room.
Figure 13:(a, b) Comparison of temperature difference (T –Ti) by CFD simulation and experimental results.
Discussion
A majority of the previous studies did not focus on office environments. Therefore, there is insufficient information with respect to office environments and Indoor Air Quality. The primary concern of previous studies was mainly on the sustainability of buildings, including many areas such as saving energy and green buildings, which is in line with the Sustainable Development Goal 11 on sustainable cities and communities.
Figure 14:ASHRAE Eight Objectives (Persily & Hewett,2010).
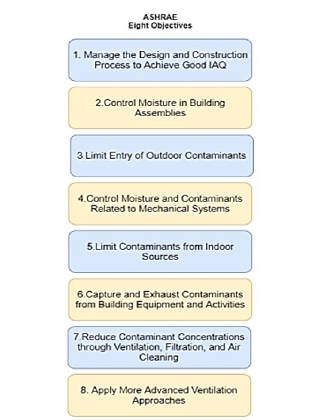
To reiterate, the Indoor Air Quality and thermal comfort can be affected by several different parameters such as geometry of environment, indoor air temperature, indoor air velocity etc. The simulation and analysis of results done in this paper illustrated how geometry and ventilation rates has an impact on the temperature and velocity of the air indoor which in turn determines the level of efficiency of the Indoor Air Quality and thermal comfort of the occupant present in the office. However, the simulated parameters are not the only parameters which plays a role on the Indoor Air Quality, there are several other parameters which will be further elaborated. As previously mentioned, the ASHRAE and Dubai Healthcare Authority standards were referred to as guidelines, ASHRAE formulated eight new Indoor Air Quality objectives, some of which were taken into consideration throughout the report [16]. These eight, as demonstrated in Figure 14, were developed in order to achieve the utmost Indoor Air Quality.
Indoor Air Pollutants
Considering the increased significance of indoor air quality, Funk et al. [17] conducted a study across the UAE to determine and attempt to measure the air quality in residential spaces. In the study, weekly average concentrations of a comprehensive spectrum of indoor air quality pollutants and indicators were measured, including sulfur dioxide, formaldehyde, hydrogen sulfide, carbon monoxide, nitrogen dioxide and particulates. It is worthy to note that it was determined that common pollutant sources such as air conditioning and smoking contributed and were significantly related to indoor levels of carbon monoxide.
Another study conducted by Yeatts et al. [18], focusing on the UAE, was deployed to analyze the various health risks that correspond with indoor air pollutants. The methodology used to obtain the necessary information was interviewing the participants. The results of the study pointed to an increased likelihood of asthma and the development of other respiratory-related health issues for those residing in houses/apartments with measurable concentrations of nitrogen dioxide, sulfur dioxide and hydrogen sulfide.
The following table was organized in order to visualize the need to increase one’s perception pertaining to volatile and semi-volatile organic compounds that could be produced by everyday items that are present in indoor residential and commercial environments which could ultimately have an effect on the indoor air quality of that specific environment (Table 3).
Table 3:Potential sources of selected indoor air contaminants common in various types of buildings [8].

Through research it was found that there is a chain reaction associated with poor Indoor Air Quality, with repercussions on indoor air pollution, which leads to the inability of satisfying the reasonable thermal comfort for an occupant, which could in turn have a negative impact on the occupant’s overall health (Kamaruzzaman & Sabrini, 2011).
Zamani et al. [19] conducted research which examined the importance of Indoor Air Quality in relation to Sick Building Syndrome (SBS). This was conducted in multiple offices located throughout Malaysia. This study demonstrated that having relatively high concentrations of harmful substances like volatile organic compounds, carbon monoxide and carbon dioxide in buildings increases an individual’s risk of experiencing SBS. Thus, it is evident that adequate ventilation in buildings drastically diminishes the prevalence of SBS. This, in turn, improves ventilation rates per person in office buildings [19].
Many people have been found to have insufficient knowledge and understanding of the different harmful indoor air pollutants that originate from within the office environment. It is important to ensure that all people have a certain level of awareness in order for them to select proper materials to use in their indoor environment that do not contribute to unsatisfactory air quality. An example of this could be to reduce the excess use of items like perfumes, adhesives and air fresheners, which are volatile organic compounds that are indoor air pollutants, which negatively affect the Indoor Air Quality.
Ventilation
Not only are Heating, Ventilation and Air Conditioning (HVAC) systems or ventilation one mechanism to control contaminants in indoor areas, but they also ensure occupants are able to experience a comfortable environment. This is because the occurrence of even the slightest fluctuation or discomfort of the indoor environment could result in complaints in regard to indoor air quality [6].
To maintain a high-quality and healthy environment, adequate ventilation is a key aspect to be considered. Adequate ventilation plays an important role in eliminating potentially harmful air pollutants that can negatively affect an individual’s health, wellbeing and performance. When taking commercial buildings into consideration, it is vital to have excellent ventilation to eliminate air pollutants, such as some of those mentioned in Table 3, that originate from within the building. These pollutants must be continuously removed, considering their dramatic impact on the performance of employers, employees, and anyone occupying the building. Therefore, having a high-quality and healthy environment and workplace boosts the performance and wellbeing of a building’s occupants [20].
In order to ensure that adequate indoor air quality is achieved, there are minimum ventilation requirements and standards established by the ASHRAE, including the Standard .62-2007. Each environment is designed to accommodate a certain number of occupants with a specific role, each having a certain usable area. It is mandated that either mechanical or a mixed mode of ventilation is implemented in all current and new buildings.
A conclusion has been reached from the analysis of a vast number of studies that when ventilation rates are below 10 litres per second per person, the occurrence of SBS symptoms is highly probable. Hence, when ventilation rates are increased, the likelihood or risks of experiencing SBS is mitigated [21].
There is vast importance placed on having adequate Indoor Air
Quality. The following are some of the most prominent reasons to
maintain a high level of IAQ [22]:
a) Research has proven that there is a clear relation between
insufficient indoor air quality and the spread of COVID-19.
According to ASHRAE and the CDC, there have been numerous
ventilation strategies put into place to minimize transmission
of airborne diseases, which in turn provide a high-quality and
healthy indoor environment with excellent indoor air quality.
b) Ventilation directly affects wellbeing. Research substantiates
the claim that clean air is necessary and directly improves
the cognitive function of occupants, reducing sick leave and
improving overall productivity.
Mold, Humidity and Temperature
Molds and other biological contaminants grow with even the slightest presence of moisture and dirt. The higher the relative humidity levels, the higher the chances of the growth and spread of unhealthy biological pollutants. However, if humidity levels are too low, below 20%, that too could contribute to dry eyes, irritated mucous membranes and sinus discomfort, increasing the feeling of stuffiness. These physical ailments of the occupants caused by low humidity levels are in addition to the static electricity buildup impacting the performance of computers and printers in the office system networks (Thermal Comfort for Office Work : OSH Answers, 2021). Moreover, the accumulation of dirt in ventilation systems, along with poor management of humidity, leads to Indoor Air Quality complications [16]. To further buttress the importance of relative humidity, the Health and Safety Executive in the UK claimed that the optimal relative humidity level should be between the ranges of 40% and 70%, in order to mitigate the impact on thermal comfort (Thermal Comfort for Office Work: OSH Answers, 2021). Hence, both moisture and relative humidity ought to be vitally controlled and balanced, ensuring individuals in occupied spaces are able to experience quality without worrying about the occurrence of any discomfort [23]. HVAC systems must comply in terms of temperature and relative humidity with the drawing from the Dubai Government on the standards and requirements for the building’s thermal comfort. The noted standards by the government are as follows: a range between 30% and 60% for relative humidity and between 22.5 °C to 25.5 °C for temperature levels [6].
According to the Canadian Centre for Occupational Health and Safety, when performing indoor air quality tests, measuring the temperature and relative humidity is vital and it is important to keep an eye out for any fluctuation in thermal conditions that may negatively impact office occupants. The slightest change could exacerbate an already stressful environment, negatively affecting performance and safety. Thermal comfort varies from person to person and is not fixed, as it is related to areas like one’s metabolic rate and activity, their body temperature, garments and other physiological factors. Moreover, the transfer of heat from an individual’s body to objects in the surrounding environment, the radiant temperature, is determined by air temperature, humidity, air velocity and garments [24]. The ASHRAE Standard 55-2013: Thermal Environmental Conditions for Human Occupancy states that the optimal temperatures satisfy around 80% of individuals. Even though the optimal temperature is met, the minority of people are still uncomfortable in their work environment [25].
Natural lighting
Apart from ventilation, another predominant factor that ought to be considered is natural lighting. A survey point to just that. One of the survey’s participants claimed that he classifies his office environment as being “good” because he is able to complete his tasks properly due to his well-lit environment. Hence, the majority of those workers surveyed have recognized the significance of having windows not only for daylight, but also for adequate ventilation to take place. As a result, there is a relationship between natural lighting, an occupant’s health and last but not least, the productivity at work, all of which has been backed up in extensive literature.
The report by Edwards and Torcellini [26] acknowledges the importance of windows and the lack thereof is viewed as one of the major pitfalls in office spaces. Without the presence of windows in an office, it is demotivating for employees, reducing their morale and overall productivity, as they feel isolated and lose a sense of connectivity with the outside world. Moreover, windowless offices are disliked for various reasons, such as poor ventilation, no daylight, inability to determine the weather, leading to increased depression and tension. Had windows been present, the above limitations could have been avoided [26]. Therefore, the Sustainable Development Goals (SDGs) developed by the United Nations, in particular number three, good health and well-being, can easily be achieved by ensuring that the implementation of windows is in place. By satisfying this standard, organizations would more likely be able to meet their triple bottom line of people, planet and profit [27-30].
As previously mentioned, the window to wall ratio is of importance and there are many aspects which play a role in obtaining the right WWR. The WWR is of interest, however, as seen from the literature review, an ideal window opening ratio can also impact the thermal comfort of the occupants in the building as well as improve the Indoor Air Quality. A WWR could be designed and simulated in Revit however that is mainly in terms of the energy consumption of a building. Simulating such things provides the designer with a better understanding on how to get the ratios correct, which is crucial since the area of a window is usually decided in the preliminary stages by the designer which means that it’s important to get it right from the start since it will be extremely difficult to make changes to it later down the line. Revit can also simulate to some extent the amount of light which can be transmitted through the windows, the amount of daylight allowed into the building plays an important role when creating a sustainable building design. The artificial lighting can be reduced by a decent amount, simply by allowing more natural light into the interior of the building, which will in turn reduce the amount of energy needed for lighting.
Conclusion
In conclusion, this paper demonstrates the importance of Indoor Air Quality when it comes to designing for a healthier and safer environment. BIM and CFD were the two advanced technologies used in the simulation of this study. The simulation done on CFD showed how the geometry and Ventilation rates can play a role on the indoor air temperature and indoor air velocity, hence, having an impact on the productivity, comfort and wellbeing of the occupant in terms of thermal comfort. Taking into consideration the limitations faced while simulating, one of the results from the simulation showed that the air temperature and velocity of the rectangular office is more efficient at 4ACH when compared to the square office. The paper also discussed other factors that affect the Indoor Air Quality, some of which include indoor air pollutants, ventilation, indoor air humidity and natural lighting. After vigorous evaluation of previous studies regarding the Indoor Air Quality of commercial environments in the United Arab Emirates, such as office environments, it became noticeable that there are numerous knowledge gaps which could be looked into in future studies.
References
- Chellappa J, Park HJ (2010) BIM+healthcare proceedings of the 15th international conference on computer aided architectural design research in Asia/Hong Kong. CumInCAD 7-10: 293-302.
- Yang L, Ye M, He BJ (2014) CFD simulation research on residential indoor air quality. Science of The Total Environment 472: 1137-1144.
- Naboni E, Lee DS, Fabbri K (2017) Thermal comfort-CFD maps for architectural interior design. Procedia engineering 180: 110-117.
- Huizenga C, Abbaszadeh S, Zagreus L, Arens EA (2006) Air quality and thermal comfort in office buildings: Results of a large indoor environmental quality survey. Proceedings of Healthy Buildings 3: 393-397.
- Spengler JD, Chen Q (2000) Indoor air quality factors in designing a healthy building. Annual review of energy and the environment 25(1): 567-600.
- Ibrahim H (2015) Indoor air quality in UAE office buildings and their effects on occupants’ health, comfort, productivity and performance. MSc Sustainable Design of the Built Environment, The British University in Dubai, pp. 1-106.
- Loftness V, Hakkinen B, Adan O, Nevalainen A (2007) Elements that contribute to healthy building design. Environmental Health Perspectives 115(6): 965-970.
- Zhang J, Smith KR (2003) Indoor air pollution: A global health concern. British Medical Bulletin 68(1): 209-225.
- Sarkar A, Bardhan R (2019) A simulation-based framework to optimize the interior design parameters for effective Indoor Environmental Quality (IEQ) experience in affordable residential units: Cases from Mumbai, India. IOP Conference Series: Earth and Environmental Science 294: 012060.
- Sujanova P, Rychtarikova M, Mayor T, Hyder A (2019) A healthy, energy-efficient, and comfortable indoor environment, a review. Energies 12(8): 1414.
- Seppanen OA, Fisk W (2006) Some quantitative relations between indoor environmental quality and work performance or health. HVAC&R Research 12(4): 957-973.
- Alibaba H (2016) Determination of optimum window to external wall ratio for offices in a hot and humid climate. Journal of Sustainability 8(2): 1-21.
- Kirkegaard PH, Kamari A (2017) Building Information Modeling (BIM) for indoor environmental performance analysis: Civil and architectural engineering. Technical Report 4(3).
- Lim YW (2015) Building information modeling for indoor environmental performance analysis. American Journal of Environmental Sciences 11(2): 55-61.
- Li Y, Sandberg M, Fuchs L (1993) Effects of thermal radiation on airflow with displacement ventilation: An experimental investigation. Energy and Buildings 19(4): 263-274.
- Persily A, Hewett M (2010) Using ASHRAE’s New IAQ Guide. American Society of Heating, Refrigerating and Air-Conditioning Engineers Journal.
- Funk WE, Pleil JD, Pedit JA, Boundy MG, Yeatts KB, et al. (2014) Indoor air quality in the United Arab Emirates. Journal of Environmental Protection 5: 709-722.
- Yeatts KB, El-Sadig M, Davidson CA, Boundy MG, Kassab MM, et al. (2012) Indoor air pollutants and health in the United Arab Emirates. Environmental Health Perspectives 120(5): 687-694.
- Zamani ME, Jalaludin J, Shaharom N (2013) Indoor air quality and prevalence of sick building syndrome among office workers in two different offices in sengalor. American Journal of Applied Sciences 10(10): 1140-1147.
- Wyon DP (2004) The effects of indoor air quality on performance and productivity. Indoor Air vol 14(s7): 92-101.
- Wargocki P, Sundell J, Bischof W, Brundrett G, Fanger PO, et al. (2002) Ventilation and health in non-industrial indoor environments: Report from a European multidisciplinary scientific consensus meeting (EUROVEN). Indoor Air 12(2): 113-128.
- Watson H (2021) A 2021 guide to the indoor air quality standards that matter. qlair Blog.
- EPA (1997) An Office Building Occupant's Guide to Indoor Air Quality.
- ca. (2021) Thermal Comfort for Office Work: OSH Answers.
- Centers for Disease Control and Prevention (2015) CDC - Indoor Environmental Quality: Building Ventilation - NIOSH Workplace Safety and Health Topic.
- Edwards L, Torcellini P (2002) A literature review of the effects of natural light on building occupants. Golden Colorado: National Renewable Energy Laboratory 1-54.
- (2019) A ventilation system proves effective at reducing hospital infections. University of Córdoba, Science Daily.
- Alhamid MI, Budihardjo, Raymond A (2018) Design of the ventilation system and the simulation of air flow in the negative isolation room using FloVent 8.2. AIP Conference Proceedings 1984(1): 1.
- Anthes E (2020) Pandemics spread in hospitals. Changes in design and protocols can save lives. The Washington Post.
- Antikainen R, Lappalainen S, Lonnqvist A, Maksimainen K, Reijula K et al. (2008) Exploring the relationship between indoor air and productivity. Scandinavian Journal of Work Environment & Health Supplements 4: 79-82.
© 2023 Kamal Jaafar. This is an open access article distributed under the terms of the Creative Commons Attribution License , which permits unrestricted use, distribution, and build upon your work non-commercially.
 a Creative Commons Attribution 4.0 International License. Based on a work at www.crimsonpublishers.com.
Best viewed in


.jpg)


 Editorial Board Registrations
 Submit your Article
 Refer a Friend
 Advertise With Us
.jpg)


.jpg)


.bmp)
.jpg)
.png)
.jpg)


.jpg)


.png)

.png)


.png)


