
- About Us
- Information
-

The Author ensures that the research has been conducted responsibly and ethically with adherence to all relevant regulations. read more..
- For Authors
- For Reviewer
- Manuscript Guidelines
- Membership
- Publication Ethics
-
- Journals
- Reprints
- e-Books
- Videos
- Policies
- Contact Us
 COVID-19
- Submissions


Full Text
Advancements in Civil Engineering & Technology
A Statistical Model for Estimating Shear Undrained Strength in Bauxite Mining Tailings Based on in situ Tests
Helena Paula Nierwinski1* and Amanda Silva Barbosa2
1Federal University of Santa Catarina, Brazil
2Graduate Student, Federal University of Santa Catarina
*Corresponding author:Helena Paula Nierwinski, Federal University of Santa Catarina, Brazil
Submission: September 29, 2023;Published: October 11, 2023

ISSN: 2639-0574 Volume5 Issue5
Abstract
Mining tailings’ undrained strength (Su) is a relevant design parameter for tailings storage dams. One way to obtain Su, independent of sample extraction and along the depth, is to carry out field tests, such as the CPTu test. Given some uncertainties related to the estimation of Su from the CPTU test, this paper aims to evaluate the variation of this parameter statistically, comparing it with vane test results and understanding the main variables involved in correctly obtaining the parameter in bauxite mining tailings. The database includes results of CPTu and vane tests carried out at specific depths in two Brazilian bauxite tailings deposits. The results demonstrate that it is possible to establish a statistical model to estimate Su as a function of data obtained by the CPTu test (qt and fs), with an r2 of 0.95.
Keywords:Undrained resistance; Mining tailings; Vane tests; CPTu tests; Statistical analysis
Introduction
The undrained strength of soils (Su), as postulated by Classical Soil Mechanics [1], concerns the material’s operational resistance under loading conditions that do not dissipate excess pore pressure. In the specific case of mining tailings, which are mostly available in deposits under conditions of total saturation, the value of Su gains importance in evaluating the stability of these structures when subjected to rapid loading without time for the excess pore pressure generated to dissipate. Morgenstern et al. [2] and Robertson et al. [3] evaluated rupture mechanisms in Brazilian mining tailings deposits that would have mobilized the material’s resistance in undrained conditions.
Su values can be determined through field and laboratory tests. According to Nierwinski [4], there are difficulties in obtaining a representative and good-quality sample for laboratory tests on these materials. In this way, field trials become attractive for the evaluation of design parameters in mining tailings. Schnaid and Odebrecht [5] highlight that the test traditionally used in the field to obtain Su is the vane test. This test allows an analytical interpretation based on the hypothesis of a cylindrical surface of soil rupture obtained by the rotation of a cruciform element inserted at a certain depth. Despite this attractiveness, the vane test is carried out punctually, and the complete characterization of a profile can become costly and economically unviable. Alternatively, the possibility is presented of obtaining Su from piezocone tests (CPTu) in a semi-empirical way, as presented by Equation 1.
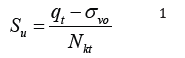
Where qt is the cone tip resistance, sv0 is the total vertical stress, and Nkt is a load capacity factor, whose value is generally calibrated from results of vane tests carried out at the same location or estimated based on results provided in the literature. Although Su’s estimate from CPTu allows obtaining the parameter along the profile, it is guided by empiricism related to the correct definition of the Nkt value [5]. On the other hand, statistical tools have increasingly covered more areas of knowledge. In geotechnics, these tools allow the evaluation of databases in a deterministic way based on concepts of reliability and probability, which supports risk management in design development [6]. Statistical analysis allows a regression of parameters, considering the variability of the studied database. For example, Mayne [7] and Mayne et al. [8] used statistical regressions to define equations to estimate the weight soil specificity from cone test results. More recently, Collico et al. [9] used statistical tools to delineate different soil layers along the geotechnical profile based on material behavior index (Ic) values.
In this context, the present work aims to apply statistical tools to study Su values obtained through field tests (CPTu and vane), seeking to evaluate a possible statistical equation between Su and results obtained in the cone test, such as qt and fs.
Methodology
The database studied consists of results from CPTu and vane tests carried out in two bauxite mining tailings deposits in Brazilian territory. From the first deposit, six vertical CPTu and 19 vane tests are distributed at different depths at the same points as in the CPTu tests. For the second deposit, 15 CPTu verticals and 36 vane tests are distributed at different depths at the same points as in the CPTu tests. The statistical analyses carried out in this work were performed using available tools to the R® software. For the development of the multiple linear regression model, the following tools were used: ggpairs from the Ggally package to compare the variables and identify their correlations; aov to perform analysis of variance; and lm to perform the regressions linearly.
Results
The first step necessary to construct a statistical model based on linear regression involves checking the relationships between possible model parameters and data behavior when crossed with each other [10]. The graph in Figure 1 displays the relationships between fs, u, qt, and Su. The analysis of these results allows us to draw two important conclusions: first, there is a strong correlation between Su and qt; second, the behavior of fs about Su exhibits nonlinear behavior, as can be observed by the highlighted blue line, indicating that a logarithmic function can transform fs to represent Su’s behavior. It is also noteworthy that the heteroscedastic relationships between the variable’s fs and u, fs and qt, and u and qt are not relevant to the context of this work, which aims to estimate Su as a function of other variables.
Figure 1:Statistical correlations between fs, u, qt e Su.

Once the relationships between the variables and the transformation carried out for the values of fs are understood, the second step to building a regression model involves analyzing the impact of each variable dependent and the relationships between them on the variations of Su. In this article, this analysis was carried out through the ANOVA technique [11], evaluating the impact of the factors qt, log (fs), and u individually and when combined. Table 1 shows the analysis of variance (ANOVA) results for selecting the factors relevant to constructing the linear model.
Table 1:Variance analysis (ANOVA).

Considering the results of the analysis of variance, the following were selected for the regression model: linear variables, whose significance factor and consequent impact on the variance of Su was greater than 95%. Therefore, the linear regression model for estimating undrained strength for bauxite tailings is defined according to Equation 2.
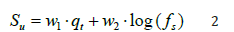
Where w1 and w2 are weights estimated through linear regression, this regression was carried out using the 55 observations containing Su values obtained through the vane test (joining the data referring to the two deposits evaluated).
The results of this estimate can be seen in Figure 2, which displays a scatter plot between the Su value measured by the vane test (y-axis) and the Su value estimated by the statistical model, with w1 = 0.0789 and w2 = - 5.1. As can be seen, this model estimates values with a coefficient of determination (r²) equal to 0.95.
Figure 2:Scatter plot between Su values measured in the vane test and estimated by statistical model.

Conclusion
The present work sought to conduct a statistical study of Su based on a database composed of CPTu and vane tests conducted in two bauxite mining tailings deposits. Through linear regression, it was possible to define a statistical model to determine values of Su from qt and log(fs), assigning weights (w1 and w2) to each variable. The results showed that the statistical equation fits well (r²=0.95) with the measured data. Thus, it would be possible, by statistical means, to calculate the undrained shear strength without necessarily carrying out the vane test several times, considering the evaluated database.
References
- Terzaghi K, Peck RB, Mesri G (1996) Soil mechanics in engineering practice. In: (3rd edn), McGraw Hill, New York, NY, USA, p. 549.
- Morgenstern NR, Vick SG, Viotti CB, Watts BD (2016) Fundão Tailings Dam Review Panel. Report on the Immediate Causes of the Failure of the Fundão Dam.
- Robertson PK, Melo L, Willians DJ, Wilson GW (2019) Report of the expert panel on the technical causes of the failure of feijão dam I.
- Nierwinski HP (2019) Characterization and geo-mechanical behavior of mining tailings. Doctoral thesis, Graduate Course in Civil Engineering, Federal University of Rio Grande do Sul, Porto Alegre, Brazil.
- Schnaid F, Odebrecht E (2012) Field test and applications. In: (2nd edn), Text Office, São Paulo, Brazil.
- Uzielli M (2022) Non-deterministic interpretation and applications of CPT testing data. Cone Penetration Testing 2022. In: Gottardi, Tonni (Eds), ISBN 978-1-032-31259-0, pp. 81-93.
- Mayne PW (2014) Interpretation of geotechnical parameters from seismic piezocone tests. Proceedings, 3rd International Symposium on Cone Penetration Testing, pp. 47-73.
- Mayne PW, Peuchen J, Bowmeester D (2010) Unit weight trends with cone resistance in soft to firm clays. Geotechnical and Geophysical Site Characterization: Proceedings of the 4th International Conference on Site Characterization ISC-4: 903-910.
- Collico S, Arroyo M, DeVincenzi M, Rodriguez A, Deu A (2022) Probabilistic delineation of soil layers using soil behaviour type index. Cone Penetration Testing 2022-Gottardi, Tonni (Eds.), ISBN 978-1-032-31259-0, pp. 332-338.
- Johnson RA, Dean WW (2014) Applied multivariate statistical analysis. Volume 6, Pearson, London, UK.
- Chambers JM, Freeny A, Heiberger RM (1992) Analysis of variance; designed experiments. Chapter 5 of Statistical Models in S. In: Chambers JM, Hastie TJ (Eds.), Wadsworth & Brooks/Cole.
© 2023 Helena Paula Nierwinski. This is an open access article distributed under the terms of the Creative Commons Attribution License , which permits unrestricted use, distribution, and build upon your work non-commercially.
Editor In Chief


.jpg)


Signup for Newsletter

Quick Links
 Editorial Board Registrations
 Submit your Article
 Refer a Friend
 Advertise With Us
Our Recent Edition

.jpg)


Top Editors


.jpg)


.bmp)
.jpg)
.png)
.jpg)


.jpg)


.png)

.png)


.png)


Financial Support

Sponsors

Latest e-Books

Latest Video

 a Creative Commons Attribution 4.0 International License. Based on a work at www.crimsonpublishers.com.
Best viewed in
a Creative Commons Attribution 4.0 International License. Based on a work at www.crimsonpublishers.com.
Best viewed in