- Submissions

Full Text
Advancements in Civil Engineering & Technology
A Numerical Study on the Seismic Performance of Reinforced Concrete Shear Walls Subjected to Lateral and Axial Loads
Mehran Darvishi1,2* and S. Ali Razavi3
1MS Student, Department of Civil Engineering, Concordia University, Canada
2Department of Civil Engineering, University of Science and Culture, Tehran, Iran
3Assistant Professor, Department of Civil Engineering, University of Science and Culture, Iran
*Corresponding author:Mehran Darvishi, MS Student, Department of Civil Engineering, Concordia University, Canada
Submission: April 10, 2023;Published: May 17, 2023

ISSN: 2639-0574 Volume5 Issue4
Abstract
Reinforced concrete (RC) shear walls are commonly used as lateral load-resisting systems in construction projects. In this study, the seismic performance of slender RC shear walls was numerically investigated using the LS-DYNA simulation software. The walls are subjected to both lateral and axial loads to study the effect of axial load on seismic performance. Axial loads were applied at 0%, 10%, 20% and 30% of the wall’s load-carrying capacity. The results indicate that including axial compression loads leads to a higher lateral force required to achieve a certain displacement than no axial loading. Additionally, the energy dissipation rate is related to the increase in axial compression load. The presence of axial loads reduces the pinching effect but gives rise to the P-delta effect, which could lead to earlier failure compared to a wall without axial force.
Keywords:Reinforced-Concrete (RC) Shear Wall; Seismic Performance; Axial Compression Load; Hysteretic Curve; Finite Element Model (FEM); Cyclic Loading; LS-DYNA
Introduction
In recent decades, rapid economic growth and urbanization have led to a significant increase in the construction of large and tall buildings. As a result, there has been a growing focus on developing provisions for the seismic performance of these structures. Reinforced Concrete (RC) shear walls have been widely utilized as an efficient lateral load-carrying system in various buildings around the world. Reinforced Concrete (RC) shear walls are subjected to the combined effects of gravity loads (i.e., dead and live loads) and lateral loads resulting from wind or seismic activities. Numerical studies on structural walls can be broadly classified into two groups. The first group involves the development of various methods for modeling concrete materials, which includes the use of cracked models [1-3] or plastic-damage models [4,5]. The second group of numerical studies involves the finite element modeling of the wall, which is a critical aspect of conducting nonlinear analyses [6-8]. Structural walls can be classified into two categories: squat and slender walls [9-11]. In the design process of slender walls, the objective is to achieve ductile flexural yielding at the wall base.
The performance of slender structural walls has been a subject of concern due to
potential inefficiencies. Over the years, numerous researchers have investigated the seismic
performance of slender RC walls. A key conclusion drawn from these studies is that the
development of cracks under seismic excitations reduces the strength and ductility of the
wall. Previous research has shown that walls reinforced with limited transverse rebars and
subjected to seismic loads may not provide sufficient energy dissipation capacity [12-14].
As a general rule, when the ratio of height to length of the wall is equal to or greater than
 , the dominant behavior of the wall is flexural. In this scenario, the tensile chords of the
wall become prolonged, while the compression chords are shortened. Therefore, the lateral
load results in a significant bending moment at the bottom of the
wall. Moreover, due to the limited length of the wall in contrast
to its height, the concrete boundary elements of the wall require
confined reinforcement to provide sufficient resisting moment..
Description of the Experimental Specimen
The shear wall studied in this research is a standard slender wall chosen from the experimental study conducted by Cho et al. [15]. Details of the wall specimen are presented in Figure 1. The wall’s height, length, and thickness are 3900mm, 1000mm, and 152mm, respectively. To prevent shear failure of the wall, transverse reinforcement has been designed, neglecting the contribution of concrete shear capacity (VC). The wall is subjected to both cyclic and compression axial loading simultaneously at the height of 3750mm. The stress-strain specifications of the reinforcing bars are provided in Table 1. The test setup is illustrated in Figure 2. The wall is horizontally aligned and subjected to axial and cyclic loads simultaneously. To prevent out-of-plane buckling, a steel frame has been used, which acts as a lateral restraint.
Figure 1:Configuration of the shear wall [15].
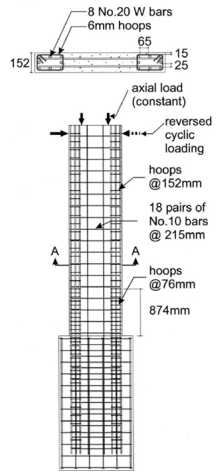
Figure 2:Test setup [16].
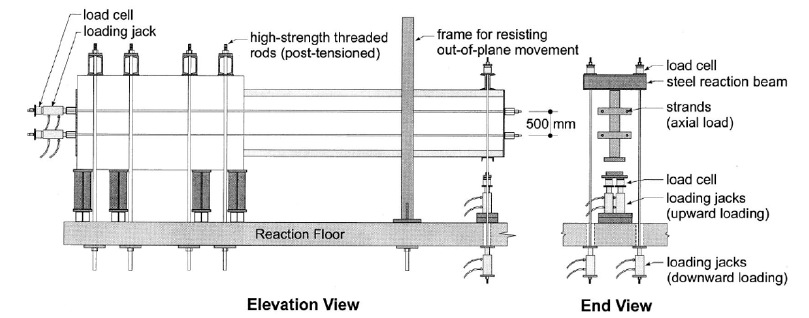
Table 1:Stress-strain characteristics of reinforcing bars.

Numerical Modeling Assumptions &Validation
Introduction of the finite element models
LS-DYNA is a finite element program widely used for solving complex dynamic problems, and it uses explicit time integration as its main approach. The program offers two options for conducting analyses: Double precision and single precision. For explicit analyses with a large number of timesteps, the double precision approach is recommended, and this approach has been adopted in this study. Four cases of numerical modeling have been considered in this study: CSW-1, CSW-2, CSW-3, and CSW-4. CSW-1 is subjected to lateral loading only, with no axial load. In the other three models (CSW-2, CSW-3, and CSW-4), in addition to the lateral load, an axial compression load is applied, equal to 10%, 20%, and 30% of the load-carrying capacity of the wall, respectively.
Mesh generation and boundary conditions
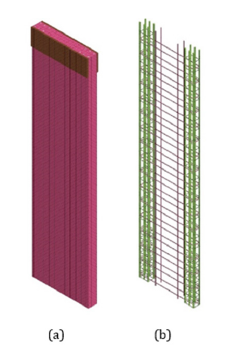
The selection of the mesh size is critical as it impacts both the computational time and the accuracy of the results. The mesh size must be chosen appropriately to ensure an accurate representation of the element behavior while avoiding excessive computational time. In this study, a mesh size of 25mm has been chosen based on these considerations [17]. At the base of the wall, nodes are fully restrained, and therefore, they cannot be displaced or rotated. Figure 3 shows the finite element model of the wall in LS-DYNA.
Figure 3:(a) Finite element model of the slender RC wall; (b) Reinforcing bars.
Material properties
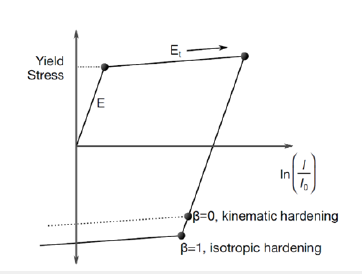
The concrete properties have been defined using the Win-frith Concrete Model MAT085 constitutive model. This model is able to account for the basic plasticity model, improving triaxial tension and compression [18-21]. Additionally, the model considers strainsoftening in tension, which occurs due to the opening of the crack width under tensile cycles, as well as rupture energy and aggregate size. LS-DYNA provides two methods for modeling steel reinforcing bars: smeared and discrete reinforcement. In this study, a discrete approach has been used. The input parameters for defining concrete properties are listed in Table 2. The failure energy has been set to 130N/m based on recommendations from CEB [22]. To capture the nonlinear behavior of the steel, a constitutive model called Plastic Kinematic MAT003 was used in the numerical simulations. This model can account for isotropic, kinematic, and combined hardening. Figure 4 illustrates the behavior of the plastic kinematic model, and Table 3 presents the input parameters used to define this material. The kinematic hardening parameter ranges between 0 and 1 and was calculated by setting β equal to zero to account for the Bauschinger effect, which represents the decrease in yield strength after plastic deformation due to initial loading. In the numerical model, steel plates were used to apply the loads, similar to the experimental model. To prevent stress concentration and achieve greater accuracy between the numerical and experimental results, two plates were placed at the two sides of the wall to distribute the area under the lateral load evenly. To define the rigid behavior of these plates, the Rigid Mat020 constitutive model with elastic behavior was used.
Table 2:Concrete properties.
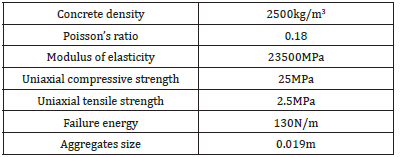
Table 3:Steel properties.

Figure 4:Plastic kinematic model behavior [23].
Concrete-reinforcing bar contact modeling
To simulate the interaction between the concrete and reinforcing bars, the Lagrange-in-Solid constraint was utilized in the numerical model. As the concrete and bars have the same mesh size in this study, the Merge Duplicate Nodes method was used to simulate their interaction accurately. Additionally, to prevent large deformations, the Automatic Single Contact and Automatic General Surface contact methods were employed.
Loading protocol
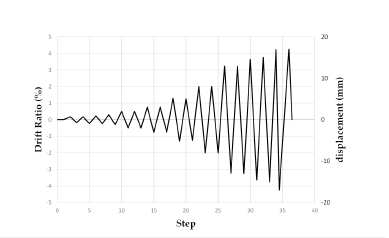
The lateral loading has been applied to the height of 3750mm using the cyclic displacement-controlled method, as shown in Figure 5. The maximum displacement corresponds to a drift of 4.2%. It is important to note that only CSW-1 is subjected to lateral load, whereas CSW-2, CSW-3, and CSW-4 are subjected to 450, 900, and 1350kN compression axial load, respectively, in addition to lateral loads. It should also be noted that before applying lateral load to the walls, axial loading has been applied to the walls and continued throughout the cyclic loading process.
Figure 5:Cyclic loading protocol.
Verification of the hysteresis curve
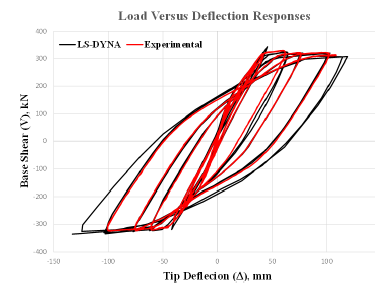
As shown in Figure 6, the force-displacement curve of the laboratory specimen fits with the model built into the finite element software. The loading protocol for this verification is provided in Cho et al. [15].
Figure 6:Hystersis curve of the experimental versus analytical model.
Observation and Numerical Results
Hysteretic force-displacement curves
The plot in Figure 7 illustrates the relationship between lateral force and imposed displacements for the different wall models. The wall CSW-4 exhibits the highest load-carrying capacity compared to the other models, as evidenced by the maximum base shear value of 304.3kN shown in Figure 7(d). Figure 7 (c,b) and 7(a) show that the maximum forces for CSW-3, CSW-2 and CSW-1 are 285kN, 280kN and 257.8kN, respectively. The presence of compressive axial force results in increased force peaks, particularly in the initial cycles of the hysteresis loop. The plots also reveal common behaviors, such as strength and stiffness degradation, pinching, and a low rate of energy dissipation in the second and fourth quarters. As shown in Figure 8, the application of axial load has reduced the pinching phenomenon. This reduction can be attributed to the cracking in the shear wall under cyclic loads, which is particularly noticeable in the tension cycles. It is important to note that these cracks not only reduce the strength and stiffness of the wall but also reduce its ductility. The width of the tension cracks is limited to a certain extent when the compression load is applied.
Figure 7:Hysteretic force-displace curves: (a) CSW-1; (b) CSW-2; (c) CSW-3; (d) CSW-4.
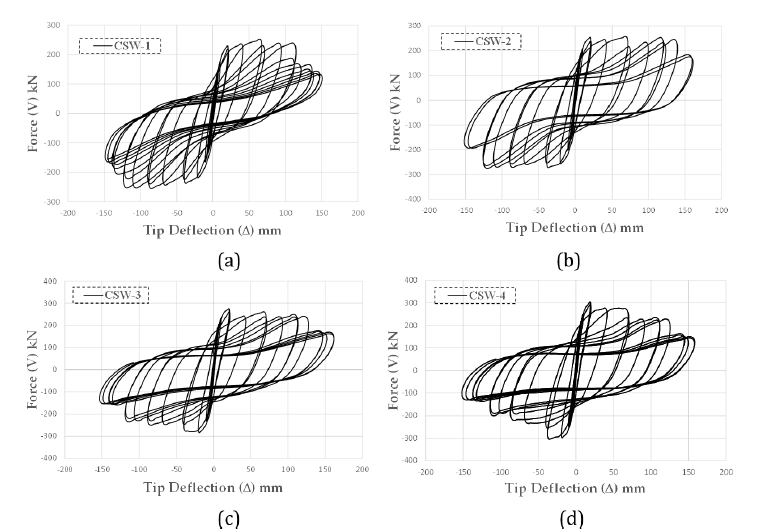
Figure 8:(a) Comparison of CSW-1 and CSW-4 in terms of pinching; (b) Comparison of CSW-3 and CSW-4 in terms of pinching.
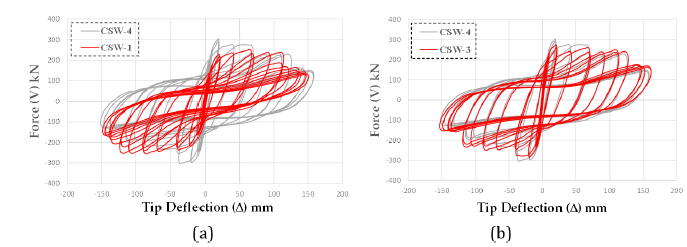
Comparing the force-displacement curves of CSW-3 and CSW- 4 in Figure 8(a), it is evident that the application of compression load has improved the hysteretic behavior of CSW-4 in terms of pinching. Figure 8(b) shows that there is not a significant difference in the behavior of CSW-3 and CSW-4 in terms of pinching. It can be concluded that the application of axial load within a certain limit has improved the performance of the wall in terms of pinching. Increasing the axial load from 10% to 30% did not have a substantial effect on the pinching. Therefore, an optimal limit for the axial load of the wall is recommended to characterize an improved seismic performance. From the point of view of pinching, it is recommended to apply an optimal compressive force of about 10% of the cross-sectional capacity.
Ductility and strength
The displacement ductility ratio (μ) can be calculated as the ratio of ultimate displacement to yield displacement (μu/μy) (Figure 9). The envelope curves obtained from the force-displacement curves have been plotted in Figure 10 to compute the ductility ratio. Various methods have been proposed to calculate the yield and ultimate displacements [24-26]. In this paper, the method proposed by Paulay and Priestley [26] has been utilized [26]. The ultimate displacement corresponds to the displacement at which the force value equals 80% of the maximum capacity (0.8F max), i.e., where the strength loss equals 20%. Figure 10 displays the performance of CSW-2 (10% compression load), and Table 4 presents its ductility parameters. Comparing force-displacement curves indicates that CSW-2 (10% compression load) exhibits the best performance in terms of strength degradation. Generally, the rate of ductility increases with an increase in the axial load. However, it should be noted that for CSW-4 subjected to a 30% compression load, an increase in compression load does not necessarily lead to increased ductility.
Figure 9:Bilinear curve for calculation of the yield displacement [26].
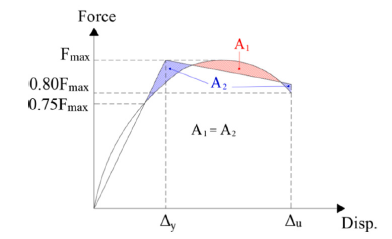
Figure 10:Envelope curves CSW1 to CSW4.
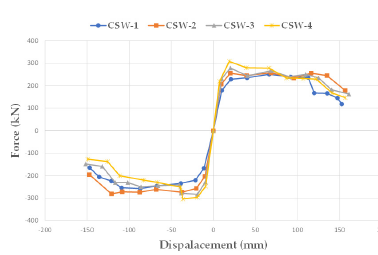
Table 4:Ductility of the RC wall models.

Secant stiffness and energy dissipation capacity
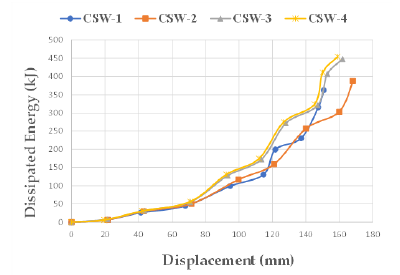
The slope of the line connecting the positive peak to the negative one in a complete cycle of the hysteretic curve defines the secant stiffness of the specimens. Variations in the secant stiffness in different cycles of the hysteretic curve indicate the stiffness degradation of the RC wall under consequent cyclic loading (Figure 11). The stiffness degradation follows a common trend in all specimens, as depicted in Figure 12. Before 1.4% drift, the stiffness degradation occurs with a higher rate, mainly due to cracking of concrete. CSW-2 exhibits a lower slope of the secant stiffness curve between the drift of 0.5 to 1.4% compared to the other models. Furthermore, the crack developing rate decreases in higher drifts, resulting in milder slope in the stiffness-displacement curve (Figure 12). In Figure 13, the accumulated energy dissipated by the walls versus displacement is shown. The area under the force-displacement curves represents this accumulated energy dissipation. As per the results, the rate of energy dissipation for CSW-2, CSW-3, and CSW-4 is 33%, 37%, and 39% greater, respectively, than that of CSW-1, which is the wall without axial load. Therefore, applying an axial load equal to 10% of the wall load-carrying capacity has led to a significant increase in energy dissipation. However, when the rate of the applied axial load exceeds 10%, the energy dissipation has only increased by 4% in CSW- 3 (20% compression load) and 6% in CSW-4 (30% compression load) compared to that of CSW-2.
Figure 11:Calculation process of secant stiffness and energy dissipation in each cycle of loading [27].
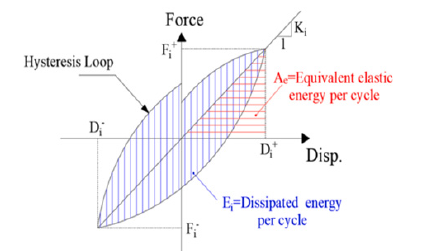
Figure 12:Calculation process of secant stiffness and energy dissipation in each cycle of loading [27].
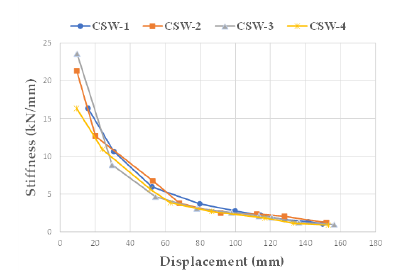
Figure 13:Calculation process of secant stiffness and energy dissipation in each cycle of loading [27].
Cracking Patterns
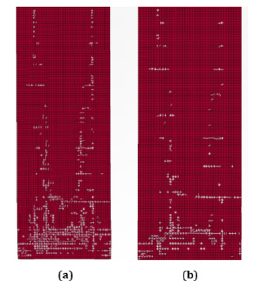
As shown in Figure 14, the cracks generated in the experimental specimen can be classified into three groups. These cracks include concrete crushing cracks in the footwall, diagonal cracks in the web, and horizontal cracks in the boundary elements. LS-DYNA software enables the specification of crack location, angle, and width, which can be visualized in the deformed concrete elements. In this study, cracks with a width of 0.5mm were identified. Figure 15 shows the cracks generated in the numerical model of CSW-2. A comparison between the cracks observed in the numerical and experimental specimens suggests a reasonable agreement. The cracking patterns of CSW-2, CSW-3 and CSW-4 are quite similar to each other. However, the cracking pattern of CSW-1 (without axial load) differs significantly from those of the other numerical models (CSW-2, CSW-3, and CSW-4). For instance, in a particular loading cycle at a drift value of 2%, CSW-1 experiences more cracking compared to the walls subjected to axial loading (Figure 16).
Figure 14:Patterns of the cracks developed in the experimental model [15].
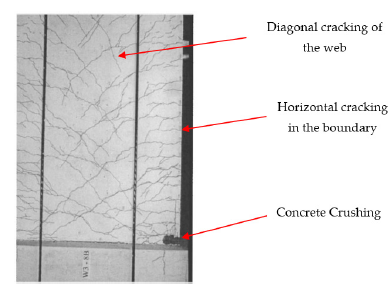
Figure 15:Pattern of cracks generated in CSW-2.
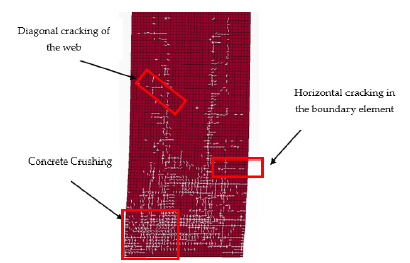
Figure 16:(a) Cracking pattern of CSW-1; (b) Cracking pattern of CSW-2.
Conclusion
In this paper, the cyclic behavior of a slender RC wall subjected
to both lateral and compression axial loading, was numerically
investigated. The results of this study can be summarized as follows:
a) Applying the compression axial load could increase the
area under the force-displacement curve, that is happening due to
reducing the number and sizes of tensile cracks.
b) The presence of the compression axial load reduces the
strength degradation and subsequently the value of the maximum
base shear is greater than that of the wall without compression
load, however, the axial force will give rise to the P-delta effect,
which could lead to earlier failure when compared to a wall without
the axial force.
c) The pinching in the RC shear walls with flexural-dominant
behavior is typically significant, while the presence of the
compression load reduces the pinching effect is remarkable.
d) The pattern of cracks in numerical model are in good
agreement with the experimental observation. This shows that
Finite Element analysis using the procedure described in this
research can reasonably predict the crack formation of the RC shear
walls.
e) Considering the results of stiffness and strength
degradation and the rates of energy dissipation and ductility, it
could be concluded that applying an axial load of 10% of the wall
load-carrying capacity provides better seismic performance in
comparison to other walls, however, considering p-delta effect,
could results in earlier failure. The study highlights the potential
of finite element analysis using LS-DYNA to predict the behavior
of RC shear walls. Future research could investigate the effects of
other wall aspect ratios and out-of-plane actions on the seismic
performance of RC shear walls.
References
- Vecchio FJ, Collins MP (1986) The modified compression-field theory for reinforced concrete elements subjected to shear. ACI Journal 83(2): 219-231.
- Hsu TTC (1988) Softened truss model theory for shear and torsion. Structural Journal 85(6): 624-635.
- Hsu TT, Zhu RR (2002) Softened membrane model for reinforced concrete elements in shear. Structural Journal 99(4): 460-469.
- Lubliner J, Oliver J, Oller S, Oñate E (1989) A plastic-damage model for concrete. International Journal of Solids and Structures 25(3): 299-326.
- Faria, R, Oliver J, Cervera M (1998) A strain-based plastic viscous-damage model for massive concrete structures. International Journal of Solids And Structures 35(14): 1533-1558.
- Spacone E, Filippou FC, Taucer FF (1996) Fibre beam-column model for non‐linear analysis of R/C frames: Part I. Formulation. Earthquake Engineering & Structural Dynamics 25(7): 711-725.
- Vulcano A, Bertero VV, Colotti V (1988) Analytical modeling of R/C structural walls. Proceedings, 9th world conference on earthquake engineering.
- Saritas A (2006) Mixed formulation frame element for shear critical steel and reinforced concrete members. University of California, Berkeley, USA.
- Gulec CK, Whittaker AS (2009) Performance-based assessment and design of squat reinforced concrete shear walls. MCEER Buffalo, New York, USA.
- Birely AC (2012) Seismic performance of slender reinforced concrete structural walls. University of Washington, USA.
- Moehle J (2015) Seismic design of reinforced concrete buildings. McGraw-Hill Education, USA.
- Greifenhagen C (2006) Seismic behavior of lightly reinforced concrete squat shear walls. EPFL, Switzerland.
- Hidalgo PA, Ledezma CA, Jordan RM (2002) Seismic behavior of squat reinforced concrete shear walls. Earthquake Spectra 18(2): 287-308.
- Kuang JS, Ho Y (2008) Seismic behavior and ductility of squat reinforced concrete shear walls with nonseismic detailing. ACI Structural Journal 105(2):225-231.
- Cho SH, Bryce T, William DC, Denis M (2004) Structural steel boundary elements for ductile concrete walls. Journal of Structural Engineering 130(5): 762-768.
- Cho SH (2000) Structural steel as boundary elements in ductile concrete walls. KCI Concrete Journal 12(2): 73-84.
- Epackachi S, Whittaker AS (2018) A validated numerical model for predicting the in-plane seismic response of lightly reinforced, low-aspect ratio reinforced concrete shear walls. Engineering Structures168: 589-611.
- Ottosen NS (1977) A failure criterion for concrete. Journal of the Engineering Mechanics Division 103(4): 527-535.
- Broadhouse B (1986) Drastic: A computer code for dynamic analysis of stress transients in reinforced concrete. UKAEA Atomic Energy Establishment.
- Schwer L (2011) The Winfrith concrete model: Beauty or beast? Insights into the winfrith concrete model. 8th European LS-DYNA Users Conference, Strasbourg, France.
- Broadhouse B (1995) The winfrith concrete model in LS-DYNS3D. Safety performance department. Atomic Energy Authority Technology, Winfrith, England, UK, (95): 363.
- Plauk G (1982) Concrete structures under impact and impulsive loading.
- (2007) LS-DYNA L, Keyword user’s manual. Livermore software technology corporation, p. 971.
- Prestandard F (2000) Commentary for the seismic rehabilitation of buildings (FEMA356). DC: Federal Emergency Management Agency, Washington, USA, 7: 2.
- (2017) Seismic evaluation and retrofit of existing buildings(41-17). American Society of Civil Engineers, p. 550.
- Paulay T, Priestley MN (1992) Seismic design of reinforced concrete and masonry buildings. John Wiley & Sons.
- Priestley MN, Seible F, Calvi GM (1996) Seismic design and retrofit of bridges. John Wiley & Sons.
© 2023 Mehran Darvishi. This is an open access article distributed under the terms of the Creative Commons Attribution License , which permits unrestricted use, distribution, and build upon your work non-commercially.
 a Creative Commons Attribution 4.0 International License. Based on a work at www.crimsonpublishers.com.
Best viewed in


.jpg)


 Editorial Board Registrations
 Submit your Article
 Refer a Friend
 Advertise With Us
.jpg)


.jpg)


.bmp)
.jpg)
.png)
.jpg)


.jpg)


.png)

.png)


.png)


