
- About Us
- Information
-

The Author ensures that the research has been conducted responsibly and ethically with adherence to all relevant regulations. read more..
- For Authors
- For Reviewer
- Manuscript Guidelines
- Membership
- Publication Ethics
-
- Journals
- Reprints
- e-Books
- Videos
- Policies
- Contact Us
 COVID-19
- Submissions


Full Text
Advancements in Civil Engineering & Technology
Assessing the Seismic Capacity of Existing Irregular in-Plan RC Buildings Using Floor Enforced Displacements by Following a Flowchart
Bakalis AP1 and Makarios TK2*
1Ph.D Civil Engineer, Institute of Structural Analysis and Dynamics of Structures, School of Civil Engineering, Aristotle University of Thessaloniki, Greece
2Associate Professor, Institute of Structural Analysis and Dynamics of Structures, School of Civil Engineering, Aristotle University of Thessaloniki, Greece
*Corresponding author:Makarios TK, Associate Professor, Institute of Structural Analysis and Dynamics of Structures, School of Civil Engineering, Aristotle University of Thessaloniki, Greece
Submission: September 16, 2022;Published: October 07, 2022

ISSN: 2639-0574 Volume5 Issue2
Abstract
To facilitate the seismic assessment process of existing, irregular in-plan, reinforced concrete buildings according to Eurocode EN 1998-3, a suitable flowchart is proposed in the current paper. This necessary assessment tool, which is missing from the code, was formulated by examining a set of existing, asymmetric, multi-storey, reinforced concrete buildings, which are seismically assessed according to EN 1998-3 but using a new non-linear static (pushover) analysis procedure suitable for all structural types of asymmetric multi-storey reinforced concrete buildings, torsionally sensitive or not. An intervention strategy to address all the inherent weaknesses of the examined buildings, by adding new structural elements or by strengthening the existing ones with the technique of reinforced-concrete jackets or by combining these methods, was included in the formulation of the flowchart together with all the safety verifications according to EN 1998-3. Finally, a mean elastoplastic-perfect diagram between the effective Peak Ground Acceleration and the average Drift ratio in elevation is presented here, resulted from the capacity curves obtained from the nonlinear static analyses of the “as strengthened” RC buildings. By using this diagram, a preliminary assessment of the quantitative impact of a retrofit study on the seismic capacity of an existing building can be done by performing only linear analyses. This is essential knowledge for the owner of the building, prior to any detailed retrofit design procedure
Keywords:Seismic assessment; Seismic capacity; Pushover analysis; Floor enforced displacements; Capacity curves; Performance levels
Introduction
As it is known, to seismically assess existing multi-storey buildings in Europe, Eurocode EN 1998-3 [1] should be applied, in conjunction with EN 1998-1 [2]. This seismic code provides Civil Engineers suitable normative guidance to assess the seismic capacity of existing buildings and to prepare a retrofit study, while it is quite condensed text without detailed information. A framework of performance requirements and compliance criteria are given in EN 1998-3 to assess the seismic performance of an existing RC building. The former are defined by combining a state of damage with a return period of the seismic action, while the latter include analysis methods and verification/detailing procedures. By performing nonlinear static (pushover) analysis, the assessment procedure according to EN 1998-3 finally leads to the drawing of the seismic capacity curves of the building (along two horizontal principal directions), through which the building is characterized as seismically adequate or not. If the building is found to be seismically inadequate, then appropriate correctives (retrofitting) measures are necessary. After their conceptual selection, a structural analysis of the building including the retrofitting measures is performed and the final dimensioning of structural parts and their connections to existing structural elements takes place. Suitable information about the appropriate material property values and the criteria for analysis and safety verifications are given in Table 4.3 of EN 1998-3 while the technical criteria for structural interventions are presented in section 5.1.2 of the code.
What is missing from EN 1998-3 is an appropriate flowchart to assist the assessment/retrofit procedure of existing buildings. Αn initial flow chart was proposed in an earlier research effort [3], exploiting the experience gained from the application of EN 1998-3 provisions on various existing, multi-storey, asymmetric, reinforced concrete (RC) buildings in Greece designed by older Hellenic seismic regulations in various periods over the last few decades. In the framework of the first author’s PhD Dissertation [4] various existing multi-storey RC buildings were examined, including the previously mentioned. All the examined existing buildings were found to be seismically inadequate according to the EN 1998-3 Performance Matrix (section 2.1 of the code). Then, a suitable intervention scenario was chosen, by adding new structural elements (usually walls) or by strengthening the existing elements with reinforced concrete jackets or by combining the two previous retrofitting measures, considering also local and global ductility issues. Finally, nonlinear static (pushover) analysis was performed to verify the seismic capacity of the as strengthened building according to EN 1998-3. In this work, a new nonlinear static (pushover) analysis procedure -with floor enforced displacements- was preferred for the seismic assessment of the as strengthened buildings [4,5]. This documented pushover procedure is suitable for all structural types of ductile asymmetric multi-storey RC buildings, torsionally sensitive or not, dealing the weaknesses of the EN 1998-3 pushover procedure on multi-storey buildings which have been identified by many researchers [4-12].
All the steps of the seismic assessment/retrofit procedure of existing buildings according to EN 1998-3, including the required linear and (new) nonlinear static analyses and safety verifications, were integrated into a new, upgraded, flowchart that is presented here (Figure 1), Additionally, the current paper presents aggregate results from the seismic assessment procedure of existing multistorey RC buildings, to highlight the effectiveness of the EN 1998-3 provisions using the abovementioned retrofit scenario. Thus, useful conclusions can be drawn for the retrofitting measures of these buildings.
Methodology
Various existing, asymmetric, multi-storey, RC buildings in Europe where seismically assessed according to Eurocode EN 1998-3 in the framework of the first author’s PhD Dissertation [4]. All buildings were found to be seismically inadequate and, therefore, appropriate retrofitting measures had to be proposed. These measures had as their main objective to enhance the stiffness and strength of the seismically inadequate existing buildings and to convert them to the structure type of torsionally stiff buildings and simultaneously to the structural type of dual buildings, equivalent to wall buildings, according to EN 1998-1 [2]. The retrofit scenario selected to achieve this goal was the addition of new structural elements (usually walls) or the strengthening of existing elements with reinforced concrete jackets or the combination of the two previous retrofitting measures. All the previous mentioned are in full agreement with the conclusions reached in the Framework of an investigative program that took place at the Institute of Structural Analysis & Dynamics of Structures, School of Civil Engineering of Aristotle University of Thessaloniki [3].
Next, the seismic capacity of the as strengthened building was assessed by performing a new nonlinear static (pushover) analysis procedure using floor enforced displacements [4,5], instead of the pushover procedure of EN 1998-3. This is fully justified in order to remedy the inherent weaknesses of the EN 1998-3 pushover procedure on multi-storey buildings, which are as follows: (a) according to EN 1998-1 (paragraphs 4.3.3.4.2.1(3), 4.3.1(5), 4.2.1.3(2), 4.3.3.2.3(2)P, 4.3.3.4.2.2(2)P, 4.3.3.1(7)&(8)), the floor lateral static forces should be applied along the “main or appropriate” directions of the building. The problem is that no information is given in EN 1998-1 on how these directions are defined in the general case of a multi-storey building with nonlinear response, (b) by applying the floor lateral static forces according to EN 1998-1 (paragraph 4.3.3.4.2.2(2)P), at the displaced location of the Mass Centre (CM) in each floor by the accidental eccentricity, the real coupled torsional/translational response is seriously underestimated in several cases of asymmetric buildings, (c) the influence of higher modes in the response is not taking into account since it is considered that the response is controlled only by the fundamental mode (paragraphs 4.3.3.4.2.2(1), 4.3.3.2.3(2)P of EN 1998-1), (d) the importance of P-Delta effects on the nonlinear response is not emphasized enough, and (e) combinations of the SRSS-type on the results of the separate static nonlinear analyses, that are generally forbitten in the nonlinear area, are imposed by EN 1998-1 (paragraph 4.3.3.5.1(6)), in order to consider the two seismic components of the seismic action. The new proposed pushover procedure with floor enforced displacements is suitable for any structural type of ductile multi-storey buildings, torsionally sensitive or not. In the new pushover procedure, the main loading directions are clearly defined. This is achieved with the definition of an ideal inelastic principal reference system of the multi-storey building. By using appropriate seismic, inelastic, drift-based, floor enforced displacements, which are parametrically determined by nonlinear response history analysis, the proposed pushover procedure takes full account of the following: (a) the coupling between translational and rotational degrees of freedom at the floor-diaphragms, (b) the influence of higher modes on the response, and (c) the P-Delta effects. Additionally, the response due to the spatial seismic action is considered directly by the envelope of sixteen (16) separate pushover analyses, avoiding combinations in the nonlinear area.
All the steps of the seismic assessment/retrofit procedure of the examined buildings were included into a new flowchart (Figure 1), which is based on the conclusions reached in the current work and is as compatible as possible with the provisions of EN 1998- 3. This flowchart upgrades the existing one of the initial research efforts [3] by including the new pushover analysis procedure using enforced displacements. The following sections describe in detail the sequential steps of implementing this new flowchart. The new pushover analysis procedure is described in detail in a separate section located within the corresponding final steps of the flowchart. Finally, by exploiting the conclusions reached in the current paper, a mean elastoplastic-perfect resistance diagram of existing multistorey buildings retrofitted according to the flowchart is presented, in order to pre-estimate their seismic performance by linear analysis only. It is noted that, this diagram is in full agreement with the conclusions reached in the previous investigative work [3].
Figure 1:Flowchart of assessment/retrofit procedure.

Flowchart Steps
The flowchart of Figure 1 consists of the following 17 distinct steps for the seismic assessment/retrofit of existing multi-storey RC buildings:
Step 1: Building documentation and material quality
In case of a real seismic assessment study, the Civil Engineer should follow the procedure for data documentation proposed in section 3 of EN 1998-3, considering the Knowledge levels. In the framework of the investigative work, which was primarily directed to determine the computational path and not a real retrofit study with immediate application, a theoretical estimate of the actual quality of concrete and its corresponding (mean) modulus of elasticity as well as of the reinforcing steel bars was made for each examined building. Consequently, neither destructive nor other in-situ methods of detecting material quality (e.g., core sampling, ultrasonic and rebound hammer methods, bolt pull out, degree of carbonation control, magnetic detection of reinforcement layout and details, etc.) were used, and no visual identification of the reinforcing steel bars was made. Both the actual quality of the concrete and its modulus of elasticity were theoretically estimated based on the proposed relations in paragraphs 3.1.2 (6) and 3.1.3 (2) & (3) of the Eurocode EN 1992-1-1 [13] and the original design drawings. The latter also used to identify the reinforcing steel grade and it was considered that the building was correctly constructed, exactly according to the design drawings and the study papers, and therefore, the level of Full Knowledge of the data is fulfilled, i.e., KL3 according to ΕΝ 1998-3 [1].
Step 2: 3-D analysis model
The 3-D linear analysis model of the asymmetric multi-storey building is created. This is done according to Eurocode EN 1998- 1 [2] modeling instructions, using the same cross sections of the original static design of the building and the gravitational loads of the seismic combination G + 0.3·Q, where G is the permanent gravity load and Q is the corresponding live load. In this model, the bending and shear stiffness of each structural member is considered equal to 50% of the corresponding values of their geometrical (uncracked) cross-sections, according to EN 1998-1 [2] (paragraph 4.3.1(7)). It is highlighted that, in case of beam supporting discontinued (cutoff) vertical elements, the mass of the column is imported in the beam span as concentrated mass (the vertical degree of freedom is enabled at the joint inserted in the column’s base) and with increased value, to simulate the continuous distributed mass of the beam due to its direct gravity load. It is then obvious that the vertical seismic component must be always considered in calculations, whether it is mandatory or not, since there are masses in the model with enabled vertical degrees of freedom.
Step 3: Verification of torsional sensitivity
Using the 3-D building model of the previous step, a modal analysis is performed. The verification of the “torsional sensitivity” of the building is carried out using the most exact criterion of the Dynamics of Structures. According to this, if -under torsional loading of the building (about vertical axis)- the largest proportion of the effective mass moment of inertia (about the vertical axis) occurs in one of the first two modes of the building, then the building has a “torsional sensitivity” and is characterized as torsionally flexible. Otherwise, is characterized as torsionally stiff.
Step 4: Remove building’s torsional sensitivity by adding walls or lengthen existing ones
If the examined building has a “torsional sensitivity”, then new walls are added in sufficient layout and in appropriate positions or the original walls (if they exist) are lengthened. This is an iterative procedure, until the building is characterized as torsionally stiff according to the criterion presented in the previous step. It is noted that if this requirement is met, then the building is assumed to have a small rotation about vertical axis, and we can approximately and well documented apply the Annex B of EN 1998-1 [2] to estimate the seismic target displacement. This is true because the scientific documentation of this Annex refers only to multi-storey planar frames. Indeed, according to paragraph 4.3.3.4.2.1(3) of EN 1998-1, it is stipulated that in torsional stiff buildings, two planar models can be used, one for each principal horizontal direction, thus paving the way for the application of Annex B of ΕΝ 1998-1. It is noted here that the seismic target displacement is determined directly by the new pushover analysis methodology which is embedded in the flowchart (see step 15).
Step 5: Verification of the structural type (EN 1998-1). Conversion to a “wall-equivalent dual system”
The structural type of the building is verified according to EN 1998-1 [2] (paragraph 5.1.2). The goal here is to have a “wallequivalent dual system” in order to exempt from the mandatory consideration of the masonry infills in the building model (paragraphs 4.3.1 and 4.3.6 of EN 1998-1). This is particularly important for the calculation cost of the study, because if the building cannot be classified as “wall-equivalent dual system” then: (a) the modeling of the masonry infills is mandatory (although, ultimately, only a few or reduced strength masonry infills will be inserted into the model due to their openings or to their large slenderness [14]) and (b) the nonlinear analysis provides larger horizontal displacements. The latter is observed in “frame-equivalent dual systems”, which are much more flexible since their members -into the nonlinear building model- are supplied with the (very low value of) secant stiffness EIsec at yield and the few masonry infills that have to be entered into the nonlinear model fail prematurely. This sometimes triggers second-order phenomena (P-D effects) with adverse consequences.
EN 1998-1 classifies a building into the structural type of “wall-equivalent dual systems” if the shear resistance of the walls at the building base is between 50% and 65% of the total seismic resistance of the whole structural system. Alternatively, the verification can be done in terms of sheer force in the seismic design situation. Following the rationale of step 4, if additional walls are required in order to have a “wall-equivalent dual system”, then new walls are inserted, or the length of those walls inserted in the previous step is increased (again with tests).
Step 6: Deficiency coefficients ρ. Decisions for the structural interventions
The calculation of the deficiency coefficients is carried out
according to paragraph 4.4.2(1)P of ΕΝ 1998-3. All verifications
are carried out in the building model which includes the new
added walls or the lengthened existing ones according to steps
4 and 5. The deficiency coefficient ρi for the i-ductile primary
structural element of the building is equal to the ratio Di/Ci
between the demand Di obtained from a linear analysis under
the load seismic combination and the corresponding capacity Ci
. Alternatively, the deficiency coefficients ρ can be calculated in
terms of reinforcement quantities, i.e., as the ratio of the demanded
reinforcement to the existing one at the structural elements’ critical
cross-sections. For this purpose, it is necessary to proceed with
the analysis of the building and its «theoretical» dimensioning
according to the current code requirements (EN 1998-1), for both
the vertical gravitational loads and the design earthquake using a
behavior factor q=1, as is explicitly defined in paragraph 4.4.2.(2)
P of ΕΝ 1998-3. It is noted that the global behavior factor q of EN
1998-1 divides the values of the elastic spectrum in buildings
designed for energy dissipation and ductility and is indirectly equal
to the product of two terms, considering the ductility factor and the
overstrength factor: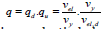 where Vel is the ideal base shear for infinitely-linear-elastic behavior, Vy is the base shear at general yielding and Vel, d is the elastic base shear at the yielding of
the 1st plastic hinge. Additionally, mean values of properties of the
existing materials must be used in the above calculations (EN 1998-
3 2.2.1(5)P), suitably modified according to the data reliability
levels (KL). It should be highlighted that this linear analysis and
«theoretical» dimensioning must be performed in the building
model that already includes the new added or lengthened walls, to
consider the redistribution of the stress on the various structural
elements. The requirements for thorough dimensioning (see also
step 9) are recommended to be taken for the medium ductility class
(DCM) of EN 1998-1, as the building is existing and therefore there
are inherent weaknesses, and consequently it is not possible to meet
the stringent requirements of the high ductility class (DCH) of EN
1998-1 for new structures. The verification process is performed
at each critical cross-section of the i-structural element, which are
usually its two extreme cross-sections. For beams, the coefficients
are calculated twice, for tension of both the upper and lower fibers.
where Vel is the ideal base shear for infinitely-linear-elastic behavior, Vy is the base shear at general yielding and Vel, d is the elastic base shear at the yielding of
the 1st plastic hinge. Additionally, mean values of properties of the
existing materials must be used in the above calculations (EN 1998-
3 2.2.1(5)P), suitably modified according to the data reliability
levels (KL). It should be highlighted that this linear analysis and
«theoretical» dimensioning must be performed in the building
model that already includes the new added or lengthened walls, to
consider the redistribution of the stress on the various structural
elements. The requirements for thorough dimensioning (see also
step 9) are recommended to be taken for the medium ductility class
(DCM) of EN 1998-1, as the building is existing and therefore there
are inherent weaknesses, and consequently it is not possible to meet
the stringent requirements of the high ductility class (DCH) of EN
1998-1 for new structures. The verification process is performed
at each critical cross-section of the i-structural element, which are
usually its two extreme cross-sections. For beams, the coefficients
are calculated twice, for tension of both the upper and lower fibers.
The maximum value of ρ is an indication of the mandatory strengthening of a structural member. According to the comments in paragraph 4.4.2(1)P of EN 1998-3, it is explicitly stated that a value of the ratio ρmax ⁄ρmin >2 or 3-for all the i-ductile main elements of the building with ρi1 -indicates a “clear deficiency”, where ρmax and ρmin are the maximum and minimum values of i ρ . If we assume min ρ >1, then a mean value for ρmax is equal to 2.5, as it is proposed by the Eurocode EN 1998-3. Additionally, in paragraph 5.5.2(a) is stated that ifρ > 2.5 it is forbidden to use linear static or dynamic analysis. It should be noted that “the global behavior q-factor approach” of EN 1998-3 is the only linear (static or dynamic) method that allows a global behavior factor q greater than one. In the other two linear analysis methods of EN 1998-3 (lateral force analysis and modal response spectrum analysis), the global behavior factor q to be used is equal to one [14]. Also, there is no sense of the behavior factor in non-linear analysis methods. Therefore, considering also the paragraphs 4.2(3)P and 2.2.2(3) of EN 1998-3 about the Near Collapse (NC) limit state and having in mind that in the strengthened building all requirements for both the ductile and brittle members will be met, the maximum global behavior (q) factor that can be used in a linear method of analysis, in order to design the retrofitting of a building (step 9), cannot exceed 2.50, otherwise it would violate theρ > 2.50 which should normally be applicable to each primary element of the structure. Therefore, indirectly we conclude that, in this case, the maximum acceptable value of ρ is 2.50, which we will use in order to obtain the minimum possible sectional stress for the dimensioning of the reinforced concrete jackets and of the new added or existing lengthened walls.
Step 7: Normalized axial force of adequate vertical members
The normalized axial force (nd) in columns that were found to be adequate in the previous step (ρ < 2.5) should be verified in this step. If 0.65 vd ≤ , then this value is acceptable as defined in paragraph 5.4.3.2.1(3)P of the EN 1998-1 for DCM. If a column does not satisfy this condition, it must be retrofitted by a reinforced concrete jacket to prevent the lateral dilation due to the increased compressive axial force, with adverse consequences on column ductility.
Step 8: Short columns check
Short columns (by location or nature) must be identified throughout the building. Frequently, for each planar frame considered, the conversion of at least one short column into a wall can degrade the problems encountered as it relieves the rest due to the active limitation of the horizontal diaphragm displacements. However, it should be noted that when the building is designed as a “wall-equivalent dual system” according to paragraph 5.1.2 of EN 1998-1, the adverse effects of short columns are degraded.
Step 9: Dimensioning of retrofitting measures (added or lengthened walls and concrete jackets)
The new added walls or the existing lengthened ones as well as all the reinforced concrete jackets for the strengthening of the (inadequate) structural members are dimensioned in this step for the medium ductility class (DCM) of EN 1998-1 (see step 6). Concrete jackets are “mantles” of reinforced concrete that modify the crosssectional dimensions of the strengthened members. Therefore, the building model (which already includes the additional walls and the existing lengthened ones) should firstly be updated with the modified cross-sectional dimensions of the strengthened members by concrete jackets prior to any analysis. This is opposed to the case where fibre-reinforced polymers (FRP) are used as a retrofit measure and, therefore, the cross-sections of the strengthened members are unchanged. Next, a linear seismic analysis of the building is performed, using a maximum global behavior factor q=2.5 (see step 6). The minimum stress levels resulted from the previous analysis are the basis for the design of the reinforced concrete jackets and of the new added (or lengthened) walls, using the characteristic strength values of the materials.
It is also recommended that all the concrete jackets in the vicinity of column-beam joints to be capacity designed (in flexure and shear), to ensure the development of plastic hinges always on the beams and not on the columns. To accomplish this, the reinforced concrete jackets of all beams should firstly be dimensioned and then, having known the strength moments of the beams, the dimensioning of the reinforced concrete jackets of the columns should follow. Also, the joints from which column or beam concrete jackets begin (concrete jackets joints) should be suitably strengthened to be able to transfer the growing stress from the deformation of the beams to the columns. Finally, it is clarified that the beam concrete jackets can be restrained at the ends of the beams or, in the case of beams supporting columns, in the vicinity of a discontinued (cut-off) supporting column, provided that the proper anchorage length of the steel bars of the concrete jackets is available (at least as long as the critical length of the beams, i.e., 2hb , where hb is the height of the cross-section of the beam).
Step 10: Section analysis. M-φ diagrams
A section analysis should be performed, to find the yield and ultimate characteristics of the end-sections of structural members. In this respect, both the new strengthened cross-sections and the initial adequate cross-sections are modeled with fiber elements in order to find the Moment-Curvature (Μ-φ) diagram along various bending planes and the spatial interaction diagram P-M2-M3 in biaxial bending with axial force. It is noted that the new hoops to be placed in the reinforced concrete jackets of the columns should satisfy Equation (5.15) of EN 1998-1 about the minimum mechanical volumetric ratio of the confinement steel in the critical cross-sections and since only perimetric hoops can be placed in the concrete jackets, sometimes Ø12/80 (mm) confinement hoops of class B500c or more must be placed. Accordingly, Equation (5.20) of EN 1998-1 must be satisfied for the boundary elements of the walls. It is also noted that the confinement hoops of reinforced concrete jackets or those of the boundary elements of added/lengthened walls must be already known, because they strongly affect the confinement concrete model of columns to be used immediately below. Thus, the examined cross-section must be separated into an unconfined and a confined concrete region, while there is also a question on whether (or not) to consider the original column cross-section as confined (or unconfined). The latter usually has sparse hoops (not properly closed in most old buildings) but now is encapsulated by the concrete jacket and therefore cannot be deformed transversely. In this phase, the mean material properties (suitably modified according to the data reliability levels - KL) are used, as well as the proposed model of confined concrete by Equations (A.6-A.8) of EN 1998-3.
The Moment-Curvature (M-φ) diagram must be idealized to an equivalent elastoplastic-perfect one by applying a reliable procedure (e.g., by Caltrans, to maintain the stability of the calculations in the non-linear analysis), from which the mean moment at yield and the mean curvature at yield can be found graphically. Their intersection point reflects the yield of the entire cross-section and not the beginning of yield of a steel reinforcement bar. Additionally, the available curvature ductility factor can be calculated as μϕ= ϕu/ϕy, where ϕu is the mean curvature of the section at ultimate. Here, care should be taken to ensure that there is adequate curvature ductility. As a recommendation, we can be satisfied if 10 μϕ > , although this limit is not mandatory for every cross-section case, especially for walls.
Step 11: Conversion of M-φ diagrams to M-θ diagrams
The elastoplastic-perfect capacity diagram of Moment- Curvature (M-φ) is converted into an elastoplastic-perfect capacity diagram of Moment-Chord Rotation (M-θ), where the chord rotation θ of an examined end-section of a structural member is defined as the drift ratio of the shear span Lv of the end-section, i.e., θ=δ/Lv where δ is the translation of the “free end” of the shear span Lv assuming that as an ideal cantilever. The available chord rotation θy at yield and the corresponding one at ultimate are calculated by using the appropriate Equations of EN 1998-3 (A.10-A.11 & A.1-A.3) while their difference directly gives the available plastic chord rotation θpl =θu−θy . The latter is theoretically equal to the available plastic rotation taking place within the plastic hinge length Lpl , i.e., is theoretically equal to the integral of the plastic curvatures ϕpl over the plastic hinge length as can be calculated indirectly by the Equation (A.4) of EN 1998-3. The appropriate plastic hinge length Lpl is given by the Equation (A.9) of EN 1998-3.
Step 12: Verification of ductile and brittle components/ mechanisms
A verification check is performed in this step, in order to prevent the possibility of a shear failure over the bending one. The shear strength VR of an end cross-section is calculated from Equations (A.12-A.16) of EN 1998-3. Given that the shear span Lv is known, which implies that plastic hinges have already been developed at both ends of the structural member, the moment MVR at the extreme cross-section, when the shear force is equal to the shear strength, is easily calculated, i.e., MVR=VR.Lv. MVR >> My , where My is the plasticity (yield) moment of the end cross-section found from the elastoplastic-perfect diagram Μ-φ. It is noted here that the above verification check always tends towards the safety side in the case where plastic hinges do not develop at the ends of the columns. This is always true when the concrete jackets have been capacity designed in flexure and shear (see step 9). Failure modes and behavior mechanisms are also categorized in this step to ductile and brittle ones. According to EN 1998-3, the former should be verified in terms of deformations while the latter in terms of strengths. A structural member is characterized as ductile when all the following apply: μθ>2 or μϕ >3 and MVRz >> My and av= M/(V.h)=Lv/h>2.
Step 13: Mandatory consideration of the secant stiffness ΕΙsec at yield
According to EN 1998-3, the secant stiffness sec EI at yield is mandatory for each structural member of the nonlinear building model. It is considered constant over the entire length of a structural member and equal to the numerical average of the ΕΙsec values of its two end cross-sections for positive and negative bending. For an examined end cross-section, it is calculated from the equation EIsec = (My .Lv ) / (3.θy )of EN 1998-3 (in paragraph A.3.2.4(5)), where My is the yield moment, v is the shear span and θy is the chord rotation at yield. In other words, it is considered that each structural member is divided into two ideal cantilevers of length v (Figure 2) and each one of them has a constant sec EI value over the entire shear span Lv . The later can be approximated to half the clear length of the structural member, in columns or beams (Figure 2b). For shear walls, v can be taken different in each floor, equal to half of the distance between the examined wall section at the base of each floor and the wall top (Figure 2a). Also, for beams with one direct supporting end, v may be taken equal to the total clear span of the beam.
Figure 2:Shear span of an end-section and chord rotation.

It is worth noted that the values of the secant stiffness sec EI at yield are very low relative to the corresponding values of the geometric (uncracked) stiffness EIg of a section [5, 15]. Here of course there is the contradiction “... why should we provide the model with the secant stiffness at yield (and, moreover, right from the beginning of the analysis) in the case where plastic hinges cannot be developed at the ends of a column due to the capacity design”? Additionally, as is sometimes shown after the end of nonlinear analysis, even in the state of imminent collapse, there are still many structural members of the building that have not developed plastic hinges at both ends (and in several cases not even one). Thus, by providing all the main structural members of the building with the secant stiffness at yield, we obtain a particularly flexible model where the resulting displacements are always larger than the real ones, even in the state of imminent collapse, while for the “Damage Limitation” performance level the deviation from the real displacements often appears particularly large. Therefore, for the higher seismic performance levels, such as that of “Damage Limitation”, and for performance levels that are even earlier (i.e., in the linear region), the non-linear analysis proposed by EN 1998-3 provides very large displacements, sometimes unrealistic. In this issue, appropriate suggestions can be found in the first author’s PhD Dissertation [4] and in [5], where the EIsec values are proposed only for verifications at the Near Collapse (NC) limit state. For the other two limit states, Significant Damage (SD) and Damage Limitation (DL), higher values of the effective stiffness are proposed, 0.25EIg ≤ EIeff,DL =2EIsec ≤ 0.5EIg and EIeff,SD= (EI + EIeff,DL)/2 respectively.
All the required nonlinear static (pushover) analyses of the as strengthened building, using the new pushover procedure with floor enforced displacements which was embedded in this flowchart, as well as the calculation of the seismic demand and of the stress and deformation due to the spatial seismic action and the final evaluation, are performed in the last four steps of the flowchart. For this reason, these last four steps are included inside a new section which describes in detail the new pushover procedure using floor enforced displacements.
Pushover Analysis using Floor Enforced Displacements [4,5]
Step 14: Non-linear static (pushover) analysis and capacity curves
To this end, the non-linear model of the building is formed by inserting point plastic hinges of M3 or P-M2-M3 type at the end-sections of each structural member and by providing them with their secant stiffnessat yield for verifications at the NC limit state. For the SD and DL limit state, the procedure is revised accordingly. It is noted that the pushover procedure using floor enforced displacements that is embedded into this flowchart is suitable for ductile buildings only. The later should have been capacity designed according to EN 1998-1 for DCM or DCH, in order to prevent a floor-type mechanism. But this is the case resulting from the retrofit strategy embedded in the flowchart (see steps 8, 9). To perform the pushover analysis procedure using enforced displacements the following should be done:
(a) The ideal inelastic principal reference system of the multistorey buildingCRsec (Isec , IIsec , IIIsec ) is determined with linear analysis. CRsec is the pole of rotation into the floor-diaphragm closest to the height of 0.8 Htot , where Htot is the total building height. The inelastic static eccentricity along each horizontal direction sec I and IIsec is equal to the distance between the CM and IIIsec vertical axes along the corresponding horizontal direction, where the IIIsec axis is passing through sec CR . The inelastic torsional radii Isec; IIsec r relative to the previously defined ideal reference system are also determined with linear analysis.
(b) The building is considered as torsionally sensitive if
rI,sec or rII,sec ≤ 1.10.rm applies, where  is the radius of gyration
of the floor closest to the 0.8 tot H level, Jm is the mass moment of
inertia of the same floor about a vertical axis passing through
its geometric centre and m is its mass. Τhis revised equation of
structural dynamics for the nonlinear area (with a limit value equal
to 1.1 instead of 1) was proposed to address building cases with
observed deterioration of the torsional sensitivity in the non-linear
area. Ηere it should be emphasized that, although by step 4 the
building has been converted to a torsional stiff one, the torsional
sensitivity of the building should be rechecked according to the
new criterion in the nonlinear area, to select the appropriate floor
enforced rotations in the next step.
is the radius of gyration
of the floor closest to the 0.8 tot H level, Jm is the mass moment of
inertia of the same floor about a vertical axis passing through
its geometric centre and m is its mass. Τhis revised equation of
structural dynamics for the nonlinear area (with a limit value equal
to 1.1 instead of 1) was proposed to address building cases with
observed deterioration of the torsional sensitivity in the non-linear
area. Ηere it should be emphasized that, although by step 4 the
building has been converted to a torsional stiff one, the torsional
sensitivity of the building should be rechecked according to the
new criterion in the nonlinear area, to select the appropriate floor
enforced rotations in the next step.
(c) The proposed values of the seismic enforced interstorey drift ratios γI ;II at the location of IIIsec axis and along the Isec or IIsec axis and of the seismic floor enforced rotations ψR,III about the IIIsec axis are obtained directly from Figure 3 and 4. In these figures, Hi/Hn is the relative height of the examined level (Hi , measured from the ground level) to the total building height Hn . Linear interpolation can be performed for intermediate number of stories. The structural type of the building (according to EN 1998- 1 [2]) and the number of stories must be known in order to use Figure 3.
Figure 3:Proposed seismic enforced interstorey drift ratios γI,i or IIi,γ (rad) in elevation for the NC performance level, at the location of the vertical axis IIIsec and along the horizontal directions Isec and IIsec , for all cases of inelastic static eccentricity and torsional sensitivity.

Figure 4:Proposed seismic floor enforced rotations ψ R,III ,i (rad) about vertical axis in elevation for the NC performance level and for all cases of inelastic static eccentricity.

Additionally, the torsional sensitivity of the building (TF for torsionally flexible buildings and TS for torsionally stiff buildings) must be known in order to use Figure 4. Figures 3 and 4 provide proposed patterns of γI;II and ψR,III along each horizontal direction Isec and IIsec , separately. Then, the unique values of the i-floor enforced rotations ψR,III,i are obtained as the average of the corresponding values along each horizontal direction. It is noted that, according to step 5 of the flowchart, the as strengthened building is characterized as a “wall-equivalent dual system”. Therefore, the right diagram of Figure 3 and one of the two diagrams in the third line of Figure 4 should be used to provide the proposed values of γI;II and ψR,III (d) The proposed values of the seismic enforced interstorey drift ratios γI ;II of Figure 3 are further revised to fit better to the examined building. This is achieved by performing two (2) temporary sets of pushover analysis with floor forces along the Isec and IIsec axes, which are applied at the location of the vertical IIIsec axis. The floors forces of the first set are determined from a unit base shear which is distributed according to the pattern of the fundamental translational mode of the building along the Isec and IIsec axes. The same applies for the second set, but with a distributed base shear equal to 0.8 while the remainder 0.2 of the unit base shear is applied as a concentrated lateral load at the top of the vertical IIIsec axis. Considering the two signs (±) of action of the lateral floor forces, eight (4) pushover analyses are performed in each temporary set. The target displacement of these pushovers with forces can be obtained directly from Table 1, through the proposed mean value of the seismic drift ratio t,top γ of the building top at the location of the vertical IIIsec axis, along the directions of the Isec and IIsec axes. For intermediate structural types of dual systems (consisting of frames and walls) or coupled (via beams) wall systems, as well as for various number of storeys, linear interpolation is performed.
Table 1:Mean seismic (target) drift ratio γt,top (rad) of the building at the NC state, on the top of the vertical axis IIIsec and along the horizontal axes Isec and IIsec , for all cases of inelastic static eccentricity and torsional sensitivity.

The final values of the proposed interstorey drift ratios γI;II , which will be used to calculate the floor enforced translational displacements ψI;II of the proposed procedure along the sec I and sec II axes (Eq. 1), are calculated as the average of the proposed values of Figure 3 and of those computed from the envelope of the eight (8) total pushover analyses of the two temporary sets.
(e) The floor enforced translational displacements ψI;II of the pushover procedure are calculated using the following equation, starting from the base towards the top of the building:
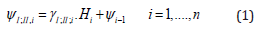
Where Hi is the floor height and γI;II;i are the revised values of the interstorey drift ratio of the i-floor according to (d). For the first floor, ψI,II;i = γI,II,i; H1 . It is noted that the value of γI;II;i.Hi gives directly the i-floor seismic drift along the horizontal direction Isec or IIsec . (f) In order to consider directly the spatial seismic action, sixteen (16) non-linear static (pushover) analyses should be performed along the Isec and IIsec axes. In these pushovers, the three enforced displacements ψI,i , ψII,i and ψR,III,i act simultaneously on the location of the vertical IIIsec axis inside each i-floor but should be combined with each other in an appropriate way depending on the main direction under consideration. Therefore, the floor enforced translational displacement along the examined (main) loading direction ( Isec or IIsec keeps its full value inside the combinations while the other floor enforced translational displacement, along the normal direction ( IIsec or Isec ), is inserted in the combinations with 30% of its full value. Considering the two signs (±) of action of the floor enforced displacements, eight possible combinations are obtained for each one of the main loading directions sec I and sec II (Table 2 & 3), giving a total of sixteen (16) pushover analyses that must be performed.
Table 2:Earthquake spatial action of simultaneous floor enforced displacements that maximize the displacement along Isec axis.

Table 3:Earthquake spatial action of simultaneous floor enforced displacements that maximize the displacement along IIsec axis

Therefore, a total of 16 non-linear static (pushover) analyses of the “bare” building arise, as we have an exemption from the mandatory consideration of masonry infills into the nonlinear model when we have a “wall-equivalent dual system” (step 5). Each one of the sixteen non-linear static analyses leads to the drawing of the corresponding capacity curve of the building, along the direction under consideration. This is a diagram between the base shear force and the displacement of the monitoring point (which is usually the Mass Centre of the top floor in the EN 1998-1 pushover but in our case is the top of the IIIsec axis) along the examined main direction. According to paragraph 4.3.3.4.2.3(1) of EN 1998-1, the capacity curve is plotted for displacement values of the monitoring point between zero and 150% of the target displacement (see next step).
It should be noted that, in each analysis, the performance of the capacity designed concrete jackets must be verified, because sometimes computational plastic hinges are developed in the columns despite the capacity design of the concrete jackets around beam-column joints. If this happens, then the concrete jackets of the columns must be further strengthened.
Step 15: Determination of the seismic demand through the target displacement
Τhe target displacement for verifications at the ΝC state is explicitly defined in the new pushover procedure by the seismic enforced displacement of the top floor, ψI,II,n. In other words, the seismic demand is known a priori. For the other limit states DL and SD, the target displacement is considered equal to 30% and 70% of the ΝC target displacement. This seismic demand is safe-sided for the estimation of the seismic floor drift ratios but is conservative as regards the floor displacements. Therefore, it is indirectly reduced as described in the next step for the in-plan displacement profiles.
Since the target displacement for the NC state is explicitly defined, we can directly apply the informative Annex B of EN 1998-1 to evaluate the results of the sixteen (16) non-linear static analyses (using floor enforced displacements) relative to the seismic demand. For the documented application of this Annex, it is necessary to define an ideal equivalent non-linear single-degree of freedom (SDoF) system that represents the whole building. This is accomplished by the bilinearization of each capacity curve. The first branch of this bi-linear idealization corresponds to the (elastic) lateral stiffness of the SDoF. It is emphasized here that, according to the informative Annex B of EN 1998-1, the bilinearization technique of the capacity curve leads to a lower value of lateral stiffness of this ideal SDoF system, with respect to the slope of the initial first (elastic) branch of the capacity curve. But this is not rational since the secant stiffness at yield ( EIsec ) was assigned to all structural members, which is the lowest value of stiffness that the members can have. Therefore, a more rational basis is to consider the lateral stiffness of this ideal SDoF system equal to the slope of the initial part of the capacity curve, as derived from each nonlinear analysis for verifications at the NC state. Finally, using this Annex, typical earthquakes (in terms of peak ground acceleration, PGA) that correspond to the three seismic performance levels of the building can eventually arise.
Step 16: Seismic demand due to the spatial seismic action
(g) The sixteen final pushover analyses of Table 2&3 are performed using as target displacement the value of the enforced translational displacement ψI,II,n of the top of the vertical axis IIIsec , along each main loading direction Isec and IIsec , calculated by Eq. (1). The envelope of the response of the sixteen (16) pushover analyses with floor enforced displacements provides a safe prediction of the seismic demand at the NC state, especially as regards the inter story drift ratios. The floor displacements are computed slightly conservatively in multi-story buildings with more than three floors and are totally corrected with the reduction factor Su calculated in Eq. (2):
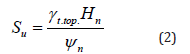
where Hn is the total height of the building, t,top. γ is taking by Table 1 and ψn is calculating by Eq. (1). The use of the reduction factor Su is proposed for multi-storey buildings with four or more floors. It is noted that, if the building under seismic assessment is not ductile enough to sustain the floor enforced displacements ψI,i, ψII ,i and ψR,III,i at the NC state, then all the proposed values from Figure 3&4 must be reduced accordingly and the same should be done for the proposed values of Table 1. This can be observed in some cases of strengthened existing multi-storey buildings with the retrofit scenario used in this flowchart.
(h) For verifications at the DL and SD limit state, first the effective stiffness of the nonlinear building model is revised with the new values of 0.25EIg ≤ EIeff,DL =2EIsec ≤ 0.5EIg and EIeff,SD= (EI + EIeff,DL)/2 respectively. Second, the proposed values of the seismic enforced inter story drift ratios γI,II and of the seismic floor enforced rotations ψR,III obtained from Figures 3 and 4 are directly reduced by 30% for SD and by 70% for DL and the same should be done for the proposed values of Table 1. Then, all the previous steps of implementation of the pushover analysis using floor enforced displacements are performed in sequential order.
Step 17: Final seismic evaluation
From the previous results, a final verification of the structural elements is made in terms of deformations or forces. More specifically, ductile elements are verified in terms of chord rotations while brittle elements are verified in terms of shear forces. In case an element proves to be inadequate in these checks, a review process is performed by rerunning the flowchart steps. This is likely to happen in few cases of non-retrofitted brittle elements that initially were adequate in bending.
Pre-estimation of the Seismic Performance of a Retrofitted Building
The main target of performing a non-linear static (pushover) analysis is to plot the capacity curve of the seismically assessed building, in terms of “Base Shear” and “Top Displacement”. According to the informative Annex B of EN 1998-1, this diagram is converted into a “resistance diagram” of an elastoplastic-perfect ideal SDoF system which is approximately “sufficiently equivalent” to the original building. The mathematical definition of this SDoF is necessary, in order to calculate the target displacement by using the inelastic acceleration response spectrum. As it is well known, spectra are defined exclusively in single-degree of freedom oscillators and they would make no sense in multi-degree of freedom systems unless these systems have been previously mathematically converted into an equivalent SDoF system. In our case, the target displacement is known a priori (step 15), it is equal to the floor enforced displacement of the top floor in the pushover procedure, and the definition of this SDoF is necessary only for the estimation of the maximum earthquake that the building can withstand (in PGA terms). At this point, it is worth noting that there are currently more precise procedures for the definition of more successful ideal SDoF systems compared to this outdated proposed by Annex B of EN 1998-1. Indeed, among others, an integrated and mathematically documented methodology, about the definition of an elastoplastic-perfect ideal SDoF system that is sufficiently equivalent to the highly asymmetric multi-story buildings with torsional sensitivity, stands out [16]. From this more precise definition, it follows directly, as a partial case, the usual case of the planar multi-story frames which are dealt with in Annex B of the EN 1998-1.
Returning to the current research paper, we have examined the possibility of developing normalized resistance curves of the examined buildings, with the aim to have, if possible, global application irrespective of the building under consideration. The proposed normalization (Figure 5) is done by the following procedure:
Figure 5:Mean elastoplastic-perfect diagram of the Peak Ground Acceleration (PGA) and the average Drift ratio (utop / Htot ) in elevation of the “as strengthened” RC buildings.

(a) The top displacement of the multi-storey building is divided by the total height Htot of the building to provide the average Drift ratio (Htop /Htot) Hu in elevation, where the height represents the distance of the top floor from the ground or from the ground floor in the case of an elevated basement and the top displacement corresponds to the displacement of the monitoring point (i.e. the node inside the top floor on which the enforced displacements of the non-linear static procedure are applied, approximately the CM). (b) Instead of the Base Shear, the peak ground acceleration (PGA) values are used. These values are calculated using the elastic acceleration spectrum of EN 1998-1 which corresponds to the performance levels of Damage Limitation (DL), Significant Damage (SD) and Near Collapse (NC). The later correspond directly to the target displacement, which is the floor enforced displacement of the top floor (step 15) used in the pushover procedure. The PGA values are obtained in combination with Annex B of EN 1998-1, as shown in the following example.
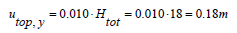
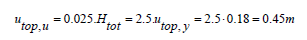
Provided that we follow the flowchart proposed in this paper, using concrete grade C30/37 and steel grade B500c for the design of the reinforced concrete jackets or for the added/lengthened walls, and also for buildings with a “wall-equivalent dual system” based on paragraph 5.1.2 of the EN 1998-1, it was observed that the dispersion of these normalized resistance curves of the retrofitted buildings is rather small. The yield displacement utop,y at the point from which passed the vertical III-axis at the top of the building is between 0.0075. Htot and 0.0125. Htot , with mean value equal to 0.010. Htot and does not depend in particular on the age of the original building or on the number of floors, but mainly on the fundamental lateral period of the “as retrofitted” structure (or, equivalently, from the lateral period of the ideal SDoF system, which is equivalent to the retrofitted real building, as defined in Annex B of the EN 1998- 1). It is emphasized that, the previous mean displacement values at yield are valid for non-linear building models in which all their structural members are supplied with their secant stiffness EIsec at yield. If a more accurate non-linear static analysis is performed, considering the step-by-step change of the building stiffness (i.e. by inserting Fiber-Hinges), the average Drift ratio at yield ( utop,y/Htot) of the retrofitted buildings becomes approximately equal to 0.80%. Additionally, the displacement of the building top at ultimate, utop,u , is considered equal to 2.5 times the yield displacement (see step 6), and therefore, the average Drift ratio at ultimate (utop,u /Htot) of the retrofitted buildings is taken equal to 2.5%. The proposed diagram is shown in Figure 5 and allows us to know approximately and in advance the final seismic performance of a building by linear calculations only, if we retrofit it according to the Eurocode EN 1998-3 provisions following the flowchart that proposed in this paper. This information is particularly important for the owner of the building who intends to seismic retrofit/upgrade it.
Numerical Example
The work path based on the key point of the diagram (Figure 5) is as follows:
Data: Suppose that we have an asymmetric multi-story RC building of total height 18 Htot = m and of total lateral mass (of all floors) mtot=1500(kN.S2 /m ) . The two-uncoupled fundamental lateral periods along the actual or fictitious principal axes X and Y of the building, after its retrofitting with walls and reinforced concrete jackets, are calculated as , 0.65 TX,unc = s and , 0.70 TYunc = s , respectively. The uncoupled fundamental lateral periods TX ,unc and TY ,unc of the retrofitted building are obtained by linear calculations (i.e. modal analysis) of the uncoupled model, along the actual or fictitious principal directions of the building, assuming effective (reduced) stiffness equal to 50% of that of the geometric (uncracked) element sections according to paragraph 4.3.1 (7) of Eurocode EN 1998-1. It is noted that, following the flowchart of the present study, the examined building is considered as “torsionally stiff” (i.e. it is not “torsional sensitive”, see step 4) and will always be characterized as a “wall-equivalent dual system” according to paragraph 5.1.2 of EN 1998-1 (step 5).
Results: From Figure 5 we can see the following:
The displacement at yield of the building at the point from which passed the vertical IIIsec-axis on the top floor is estimated:
The ultimate displacement at failure of the building at the point from which passed the vertical IIIsec-axis on the top floor is estimated:
The effective lateral period T*X or T*Y of the ideal SD of system (along the principal building directions), that is considered equivalent to the retrofitted real building according to Annex B of EN 1998-1, can be estimated by the following equations:
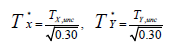
The denominator 0.30 satisfactorily reflects the consideration of the secant stiffness at yield EIsec assigned to all structural elements for verifications at the NC state, which is mandatory in the framework of non-linear analysis according to the paragraph A.3.2.4(5) of Eurocode EN 1998-3.
Therefore, the effective lateral periods T*X or T*Y are estimated:
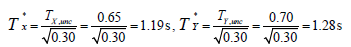
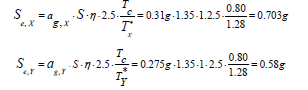
Figure 5 shows that the peak ground accelerations (PGA) which cause the yielding of the building are ag,X = 0.31g for the X-seismic component and ag,Y =0.275 g for the Y-seismic component.
The spectral acceleration for the above two earthquakes is calculated according to the elastic spectrum of EN 1998-1 (for soil D, S=1.35, η=1.00, Tc=0.80 s) along the X or Y-axis:
Consequently, the two corresponding mean base shears that cause the yielding of the building along the X or Y-axis can be estimated and then the mean elastoplastic-perfect resistance curve of the retrofitted building along the same axes can be drawn (Figure 6):
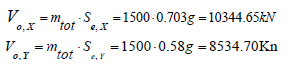
Figure 6:Pre-estimation of the mean elastoplastic-perfect capacity curve of the “as strengthened” RC building.

In this way, a safe pre-estimate of the mean elastoplastic-perfect resistance diagram of the building under seismic evaluation was achieved. This pre-estimate was based solely on the use of linear analyses but exploiting the results of this relevant investigation work using non-linear analyses.
Conclusion
Α new flowchart which assists the seismic assessment/ retrofit procedure of existing multi-story RC buildings according to Eurocode EN 1998-3 was presented in this paper. This new flowchart is an upgrade of an earlier version [3], by incorporating a new nonlinear static (pushover) analysis procedure with floor enforced displacements instead of the corresponding procedure of EN 1998-1. It was developed in the framework of the PhD Dissertation of the first author [4,5], by assessing the seismic capacity of real, asymmetric, multi-story RC buildings in Europe, while the conclusions reached in the current work are in fully in agreement with the earlier research effort.
All the existing buildings under seismic evaluation had been
designed by old seismic codes and present clear static deficiency
according to the Seismic Performance Matrix set out in EN 1998-
3. According to the flowchart, the most suitable retrofit measures
for the examined existing buildings should be a combination of the
following:
a) addition of new walls (or lengthening of existed ones) in order
to characterize the buildings as “torsional stiff” and, at the
same time, as “wall-equivalent dual systems”,
b) reinforced concrete jacketing of the inadequate members.
Next, the seismic assessment of the “as strengthened” RC
buildings can be implemented by performing the (new) pushover
analysis with floor enforced displacements on the non-linear “bare”
model of the building, without the reception of the masonry infills.
From the results of pushover analyses that performed, a mean elastoplastic-perfect diagram between the Peak Ground Acceleration (PGA) and the average Drift ratio (utop/Htot) in elevation of the “as strengthened” RC buildings was parametrically determined. Additionally, a simplified procedure is presented in detail, using only linear analysis and the previous diagram, to approximately pre-estimate the seismic performance of any multi-story RC building which will be strengthened by the abovementioned retrofitting measures. Following this procedure, the mean elastoplastic-perfect resistance diagram of the building is obtained. Therefore, the building owner has at his disposal valuable information on the effectiveness of the specific retrofit measures, before performing any detailed retrofit design study of his building, that will help him to adopt the appropriate decisions.
References
- EN 1998-3, Eurocode 8 (2005) Design of structures for earthquake resistance-Part 3: Assessment and retrofitting of buildings. The European Union Per Regulation 305/2011, Directive 98/34/EC, Directive 2004/18/EC, Brussels.
- EN 1998-1, Eurocode 8 (2004) Design of structures for earthquake resistance-Part 1: General rules, seismic actions and rules for buildings. The European Union Per Regulation 305/2011, Directive 98/34/EC, Directive 2004/18/EC, Brussels.
- Makarios T, Bakalis Α (2018) Flowchart of assessment studies of seismic capacity about Hellenic r/c building using Eurocode EN 1998-3. In Proceedings of Sixteen European Conference of Earthquake Engineering, 2018, June 18–21, Thessaloniki.
- Bakalis A (2021) Seismic non-linear static analysis of asymmetric reinforced concrete buildings at capable near collapse state using imposed floor displacements or inelastic dynamic eccentricities. PhD Dissertation. School of Civil Engineering of Aristotle University of Thessaloniki, Greece.
- Bakalis A, Makarios T (2021) Seismic Enforced-Displacement pushover procedure on multistorey R/C buildings. Engineering Structures 229.
- Krawinkler H (2006) Importance of good nonlinear analysis. Struct Des Tall Spec Build 15(5): 515-531.
- Chopra AK, Goel R (2001) A modal pushover analysis procedure to estimate seismic demands for buildings: theory and preliminary evaluation, Report No. PEER 2001/03, Pacific Earthquake Engineering Research Center, University of California, 2001, Berkeley, CA, USA.
- Chopra AK, Goel RK (2004a) A modal pushover analysis procedure to estimate seismic demands for unsymmetric-plan buildings. Earthquake Engng Struct Dyn 33(8): 903-927.
- Goel RK, Chopra AK (2005b) Role of Higher-“Mode” Pushover Analyses in Seismic Analysis of Buildings. Earthquake Spectra. 21(4): 1027-1041.
- Gupta A, Krawinkler H (1999) Seismic demands for performance evaluation of steel moment resisting frame structures (SAC Task 5.4.3), Report No. 132, John A. Blume Earthq. Engineering Center, Stanford University, Stanford, CA, USA.
- Goel RK (2004) Evaluation of nonlinear static procedures using building strong motion records, In Proceedings of the 13th World Conference on Earthquake Engineering, Paper No. 3213, 2004, August 1-6, Vancouver, B.C., Canada.
- Kunnath SK (2004) Identification of modal combinations for nonlinear static analysis of building structures. Computer-Aided Civil and Infrastructure Engineering, 19(4): 246-259.
- EN 1992-1-1, Eurocode 2 (2004) Design of concrete structures-Part 1-1: General rules and rules for buildings. The European Union Per Regulation 305/2011, Directive 98/34/EC, Directive 2004/18/EC, Brussels.
- Bakalis A (2013) Evaluation of the linear and non-linear analysis methods of KAN.EPE. for the seismic assessment of r/c buildings. MSc Thesis. School of Science and Technology, Earthquake Engineering and Seismic-Resistant Structures, Hellenic Open University, Greece.
- Bakalis A, Makarios T (2018) Dynamic eccentricities and the “capable near collapse centre of stiffness” of reinforced concrete single-storey buildings in pushover analysis. Engineering Structures 166: 62-78.
- Makarios T (2009) Equivalent Non-Linear SDF system of spatial asymmetric multistory buildings in pushover procedure. Theory & Applications. Journal of the Structural Design of Tall & Special Buildings 18(7): 729-763.
© 2022 Makarios TK. This is an open access article distributed under the terms of the Creative Commons Attribution License , which permits unrestricted use, distribution, and build upon your work non-commercially.
Editor In Chief


.jpg)


Signup for Newsletter

Quick Links
 Editorial Board Registrations
 Submit your Article
 Refer a Friend
 Advertise With Us
Our Recent Edition

.jpg)


Top Editors


.jpg)


.bmp)
.jpg)
.png)
.jpg)


.jpg)


.png)

.png)


.png)


Financial Support

Sponsors

Latest e-Books

Latest Video

 a Creative Commons Attribution 4.0 International License. Based on a work at www.crimsonpublishers.com.
Best viewed in
a Creative Commons Attribution 4.0 International License. Based on a work at www.crimsonpublishers.com.
Best viewed in