- Submissions

Full Text
Advancements in Civil Engineering & Technology
Ventilation of Isolation Room and Infection Risk in House
Ryoichi Kuwahara, Hyuntae Kim* and Takumi Kuga
Department of Architectural Design and Engineering, Yamaguchi University, Japan
*Corresponding author: Hyuntae Kim, Department of Architectural Design and Engineering, Yamaguchi University, Japan
Submission: February 24, 2022;Published: March 14, 2022

ISSN: 2639-0574 Volume5 Issue1
Abstract
Due to the COVID-19 pandemic, there has been an increase in the number of people infected with coronavirus and the number of infected people being indoors. In particular, infection between family members in house is serious. However, there is insufficient information on how to create an isolation room in house or how to ventilate it. Therefore, this study investigated the air flow from the isolation room to the common space and suggested a ventilation method for the isolation room. The study result showed that the ventilation port of isolation room was effective in securing the ventilation volume of isolation room. Moreover, the ventilation volume in the isolation room could be increased by operating the exhausted ventilation fan, thereby reducing the risk of infection in isolation room. This implied that air flow from isolation room to the shared space might be suppressed by operating a simple ventilation fan, so it can reduce the risk of infection in cohabit-ants of the shared space. Infection countermeasures at home differ depending on the total area, the number of people, the number of households, presence/ absence of ventilation, performance of ventilation system, and location of isolation room. Thus, measures and countermeasures under various conditions should be ad-ministered in the future.
Keywords:COVID-19; Pandemic; Isolation room; Home recuperation; Ventilation
Introduction
COVID-19 infection is caused by COVID-19 “SARS-CoV2,” and the World Health Organization (WHO) has termed the infection caused by this virus as “COVID-19” [1]. As of March 9, 2021, the number of people infected and dead worldwide was reported to be 117,114,432 and 2,724,162, respectively [2]. In Japan, 439,992 people were reportedly infected with COVID-19 infection and 8,253 people died [3]. On April 17, 2020, the Government of Japan declared a state of emergency based on Article 32 of the Law on Special Measures for New Influenza to prevent an increase in the number of people infected with COVID-19 [4]. In addition, due to an increase in the number of domestically infected people during the second wave, a state of emergency was reissued from January 7, 2021. The Ministry of Health, Labor, and Welfare decided to avoid three Cs (closed spaces, crowded places and close-contact settings) to prevent COVID-19 infection in Japan [5]. In addition, hand washing, cough etiquette (use of a mask, tissue, handkerchief, sleeves, inside of the elbow, etc. to hold the mouth and nose when coughing or sneezing), and a new lifestyle incorporating these practices were announced. In particular, the new lifestyle included (1) basic infection control measures for each individual; (2) basic lifestyle for daily life; (3) lifestyle for each scene of daily life; and (4) working styles [5]. The Ministry of Health, Labor, and Welfare announced ventilation methods to improve “closed spaces with poor ventilation” in winter [6] and suggested (1) opening the window and (2) mechanical ventilation (air conditioning equipment and mechanical ventilation equipment) as ventilation methods. Furthermore, to confirm whether the required ventilation volume was satisfactory, a carbon dioxide concentration measuring device was used to check whether the carbon dioxide concentration in the room exceeded 1000 ppm (reference level).
With an increase in the number of people infected with COVID-19 in Japan, there are concerns regarding the collapse of medical infrastructure. According to the test-positivity status of patients in Tokyo, as on March 8, 2021 (updated at 18:30) [7], 1,427,417 patients received accommodation treatment; 570 received home treatment; and 285 patients were hospitalized. Among those who tested positive, the number of people receiving medical treatment at home was large, and there have been reports of an increase in infections at home [8]. According to the compilation of the Japanese Society for Infection Prevention and Control [9], guidelines to prevent COVID-19 infection at home are as follows: (1) separate the infected person’s room from other cohabitants as much as possible; (2) limit the number of people who care for the infected person (preferably one person); (3) use masks to the extent possible; (4) gargle and wash your hands; (5) ventilate as much as possible during the day; (6) disinfect common parts such as doorknobs; (7) wash dirty linen and clothes; and (8) seal and dispose garbage. Among these, this study focuses on two points, namely separation of the infected person’s room from other cohabitants as much as possible and maximum ventilation during the day.
In Japan, attention has been paid to the ventilation of houses since pollution became a social problem in the latter half of the 1990s. To solve the domestic “sick house syndrome,” air concentration guidelines were set for 13 substances that were chosen as indoor air pollutants [10]. In July 2007, the Building Standards Law was amended to require the installation of a mechanical ventilation system to ensure the required ventilation volume [11]. The Ministry of Land, Infrastructure, Transport and Tourism created a “Housing Ventilation Equipment Manual for Measures against Sick House Syndrome” [12]. The contents of the ventilation equipment manual of the house included ventilation frequency, ventilation volume, ventilation route, and ventilation method.
Recently, ventilation in hospitals and buildings has been attracting attention to reduce human-to-human infection [13-16]. To prevent leakage of contaminated air into other spaces, various negative pressure differentials and ACH (air changes per hour) are recommended in isolation room. Taiwan suggests a minimum negative pressure of 8 Pa with respect to an adjacent room or corridor [15]. On the other hand, guidelines in other countries recommend a negative pressure in the range of 5 to 10 Pa [17- 20]. The US Centers for Disease Control and Prevention (CDC) recommends a negative pressure of 0.25 Pa and an exhaust flow rate of 1.8 m3/min or 10% greater than the amount of air supplied to control the direction of airflow between room and its adjacent areas [21]. In addition, the minimum ventilation rate in an isolation room recommended by the Ameri-can Institute of Architects (AIA) is typically 6 ACH [22].
In Japan, the ventilation rates in a house is generally recommended for 0.5 ACH. On the other hand, most of the buildings built before 2007 do not have a ventilation system. In addition, since the air flow route differs depending on the ventilation method, it is obvious that there is a concern about infection between noninfected persons and infected persons in the house even if the ventilation volume can be secured. How-ever, it is difficult to newly install a ventilation system with a large ventilation capacity due to the occurrence of infected patients in the family. Therefore, if the infected family cannot be admitted to the hospital and is waiting at home, it is necessary to propose a simple ventilation method that can secure the amount of ventilation for the isolation room in the house. This study aimed to confirm the air flow from the isolated room by operating the exhausted ventilation fan installed in the house. In addition, a simple ventilation fan was in-stalled in the isolated room to check whether air was flowing from the isolated room to the common space, and this study presented a method to prevent air infection in the house.
Outline of Research
This study assumed that a person with a positive test was being treated in an isolated room in a general house and measured the air flow from the isolated room to the common space. CO2 was used to confirm the air flow route. Figure 1 shows a plan of the house to be measured. The total floor area is about 67.68 m2; the target house is the first floor of a Reinforced Concrete (RC)5-story apartment building, 3LDK (3LDK designates three bedrooms with living room, dining room, and kitchen) and the building to be measured is 43 years old. As of 2018, there are about 2.4 million apartments built by the same period [23] and it is known that the usage rate is high. In addition, the target housing is a family structure of two adults and two children. A separate room of approximately 4.5m2 was assumed as the isolation room to minimize contact between testpositive and non-infected persons.
As shown in Figure 1, it was divided into an isolation room area in the blue shaded area and a common area in the red shaded area. In addition, ventilation fans are installed in the bathroom to enable exhausted ventilation. In the isolation room, there is a ventilation port (120mm x 380mm) for taking in outside air above the window on the balcony side, which is able to promote ventilation in the isolation room. The ventilation port is located at the top of the window and can be opened and closed directly by the occupant. The windows of the bedroom and living room have ventilation port and if ventilation port was kept open, it is assumed that air of the common space will not flow back into the living room. Finally, the air tightness of the target house is not good.
House to be measured and measurement conditions
Table 1 lists the specifications of the measuring equipment. Figure 1 & 2 show the measurement points and a photograph of the equipment used to conduct measurements. The measurement items were temperature, CO2 concentration and differential pressure between the isolated room and the common space. Four measurement points in this study are as follows: balcony (Point 1); the inside of the isolation room (Point 2); the common space (Point 3); and the bathroom (Point 4). Assuming that a test-positive person was being treated in the isolation room, CO2 was generated in the isolation room; and the temperature and CO2 concentration were measured at each measurement point. The differential pressure was measured in the isolated room (Point 2) and in the common space (Point 3). Regarding the installation of the differential pressure gauge, the measurement was conducted on the floor surface, and the gap between the doors of the differential pressure gauge tube was sealed with the tape. The length of the tube of the differential pressure gauge was about 1m; and the measurement was performed with the isolated room as the positive pressure and the common area as the negative pressure.
Table 1: Overview of the measuring equipment.

Figure 1 :Floor plan of the house and measurement point.

Figure2 :Measuring equipment (Left: Differential pressure gauge, Right: Carbon dioxide, temperature, relative humidity sensor).
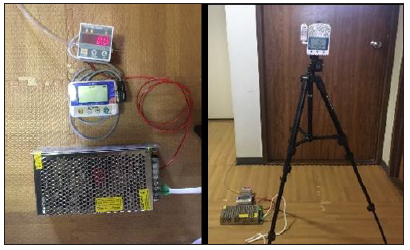
Table 2: Measurement condition.
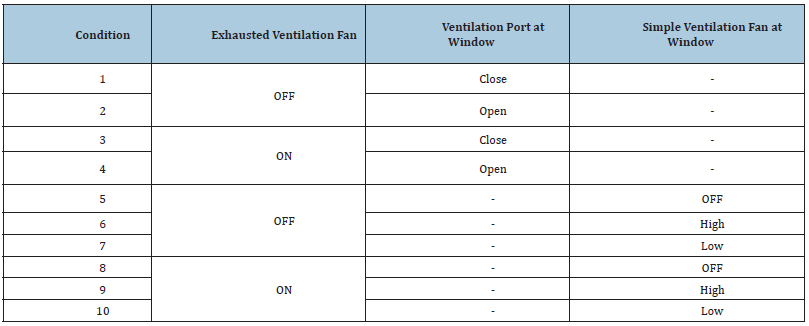
Table 2 lists the measurement conditions. The displacement of the bathroom ventilation fan was 300–350 m3/h; and the measurement time was 2h under each condition. CO2 in the isolation room was generated using a carbon dioxide cylinder. The amount of carbon dioxide is controlled by the regulator, and the amount of carbon dioxide generated is 1ℓ/min. Measurement conditions 1 to 4 were measured by combining the use or non-use of the exhausted ventilation fan and the use or non-use of the ventilation port installed in the balcony window. To measure the air flow through the ventilation port, condition 1 was set when the ventilation port of the isolation room was closed; and condition 2 was set when the ventilation port was opened in the isolation room without operating the bathroom ventilation fan. In order to measure the airflow by the bathroom ventilation fan, condition 3 was applicable when the ventilation port was closed; and the exhausted ventilation fan in the bathroom was operated. The condition 4 was set when the ventilation port was opened. The conditions 1, 2, 3, and 4 were measured for 2h each. As shown in Figure 3, a simple ventilation fan was attached to the ventilation port above the balcony window of the isolated room, and the air flow from the isolation room to the ventilation fan in the bathroom was measured when the simple ventilation fan was operated.
Figure 03 :The simple ventilation fan installed in the ventilation port.

Table 3: Specifications of small ventilation fan.

Table 3 lists the specifications of a simple ventilation fan. The simple ventilation fan measured 80mm × 80mm and the ventilation air volume had a two-stage function of high and low. This simple ventilation fan was selected due to its ease of installation and because it could be easily purchased from an online shop during an emergency. Actual measurement conditions 5 to 10 combined the presence/absence of the ventilation fan installed in the bathroom and the presence/absence of a simple fan installed in the ventilation port of the balcony window. Condition 5 was applicable when the ventilation fan installed in the bathroom was off and the simple ventilation fan was not operating. Condition 6 was applicable when the simple ventilation fan was operated at a high speed and condition 7 was operated at a low speed. To confirm the air flow in the case that the simple ventilation fan and the bathroom ventilation fan were used together, condition 8 was applied when the bathroom ventilation fan was on and the simple ventilation fan was not operating. Condition 9 was set when the simple ventilation fan was high; and condition 10 was set when the simple ventilation fan was operating at a low speed. The conditions 5~7 and 7~10 was measured for 2h each. CO2 emissions in the isolation room under each condition is assumed to be 0.3 ℓ/min. Assuming that one test-positive person stays in the isolation room, the amount of CO2 generated per hour would be 18 ℓ/h, based on the average adult human exhalation [24]. The occupants did not stay indoors during the experiment. This study proposes a ventilation method that occupants can have in the house when an infected person of COVID-19 occurs in the family and the wind speed and direction of the outside air are not considered.
Results
Average temperature at each measurement point
Table 4: Average temperature (℃).

Table 4 lists the average temperature under each measurement condition. The temperature at each measurement point varied depending on the measurement period and measurement time; however, the maximum temperature was measured at each measurement point in the isolation room (Point 2). In addition, the temperature inside the house tended to be higher than the outside (Point 1) temperature; and it decreased in the following order: isolation room, common space (Point 3), and bathroom (Point 4). The maximum temperature difference in the house was under condition 1 (7.3 °C). Therefore, fluctuations in air flow due to temperature under each condition is minimal.
Air flow route due to differential pressure
Figure 4 :Changes in differential pressure over time (Condition 1 and 2).
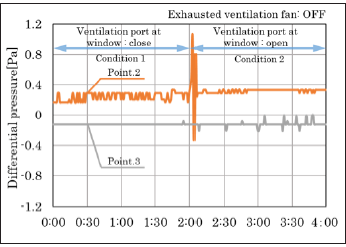
Figure 4 shows the differential pressure results of measurement conditions 1 and 2; and Figure 5 shows the differential pressure results of measurement conditions 3 and 4. Figure 4 demonstrates the results when the ventilation fan installed in the balcony window is changed from a closed condition to an open condition and also when the ventilation fan of the bathroom is turned off. The measurement results revealed that the isolated room (Point 2) had a positive pressure; and the shared space (Point 3) had a negative pressure. The study results confirmed that the outside air flowed into the isolated room through the window of the balcony; and the air in the isolated room was flowing into the common space through the gap between the doors.
This study also found that when the bathroom ventilation fan was off, the opening and closing of the ventilation openings installed in the balcony windows did not affect the air flow in the room. The measurement results of measurement conditions 3 and 4 were obtained with the bathroom ventilation fan turned on. As shown in Figure 5, the isolation room had a positive pressure; and the common space had a negative pressure. The results were similar to those of measurement conditions 1 and 2.
Figure 5 :Changes in differential pressure over time (Condition 3 and 4).
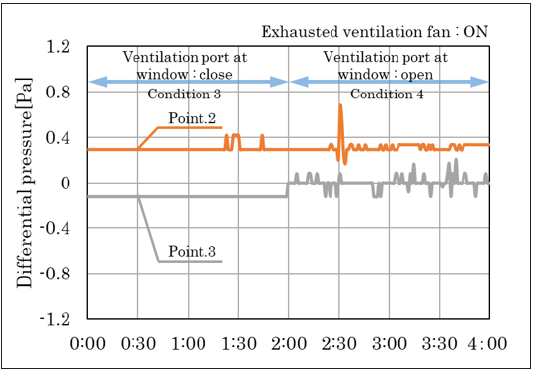
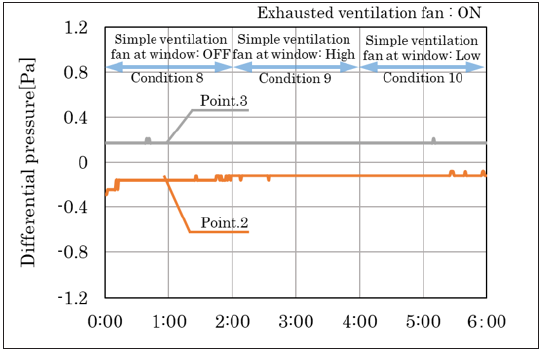
Figure 6 :Changes in differential pressure over time (Condition 5, 6 and 7).

Figure 6 shows the differential pressure results under measurement conditions 6 and 7 and Figure 7 demonstrates the differential pressure results under measurement conditions 9 and 10. Measurement conditions 6 and 7 were the results of measuring the air flow with and without the operation of the simple ventilation fan, respectively, when the bathroom ventilation fan was off. The isolation room (Point 2) had a negative pressure; and the shared space (Point 3) had a positive pressure (Figure 6). In addition, the same tendency was seen when the ventilation fan in the bathroom was operated (Figure 7). The ventilation volume of the bathroom ventilation fan was five to six times larger than that of a simple ventilation fan. However, it is possible that the simple ventilation fan in the isolation room was not affected because of the poor airtightness of the entrance door and windows of the common area. Thus, air could flow from the common space to the isolation room and from the isolation room to the outside by installing a simple ventilation fan in the isolation room..
Figure 7 :Changes in differential pres-sure over time (Condition 8, 9 and 10).
Air flow route depending on whether the ventilation vent is open or closed and when the exhausted ventilation fan is on and off
Figure 8 :Changes in CO2 concentration over time (Condition 1 and 2).
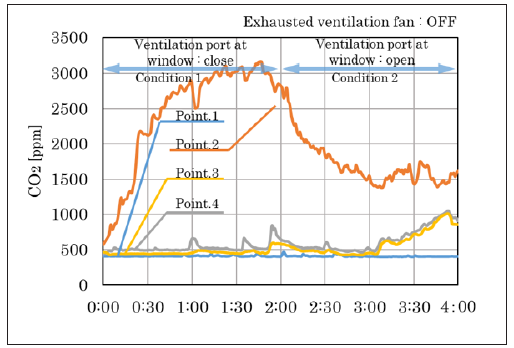
Figure 8 shows the measurement results of changes in CO2 concentration over time under measurement conditions 1 and 2. Figure 8 displays the results of checking the air flow depending on whether the ventilation port installed on the balcony window is opened or closed when the ventilation fan in the bathroom is off. Since CO2 was generated in the isolation room, the CO2 concentration in the isolation room (Point 2) rose sharply till 3160 ppm after 1h and 30min. Subsequently, when the ventilation port installed in the window of the balcony was opened, the CO2 concentration in the isolation room was gradually decreased. Ventilation of the isolated room was confirmed from the ventilation port. However, some CO2 flowed into the common space (Point 3) and bathroom (Point 4). Moreover, it can be confirmed that the CO2 concentration in the common space and the bathroom has exceeded 1000ppm since 1 hour after opening the ventilation port.
Figure 9 :Changes in CO2 concentration over time (Condition 3 and 4).
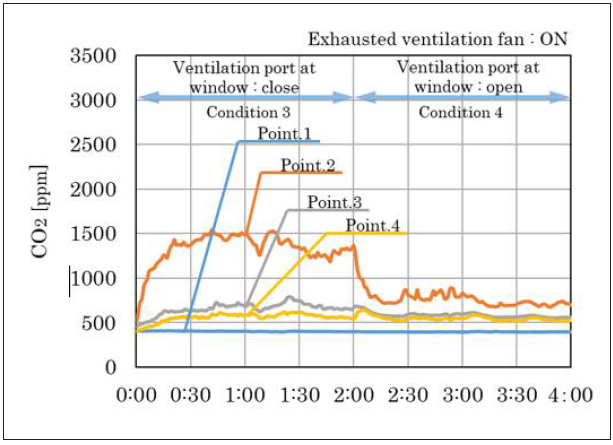
Figure 9 shows the results of changes in CO2 concentration over time under measurement conditions 3 and 4 as well as the results of air flow, depending on whether the ventilation port installed on the balcony window is opened or closed when the ventilation fan in the bathroom is on. Owing to the operation of the ventilation fan in the bathroom, the isolation room had a much lower CO2 concentration than Condition 1. In addition, by opening the ventilation port of the balcony window, ventilation was further promoted; and the CO2 concentration in the isolation room was 1000 ppm or less. However, by operating the ventilation fan in the bathroom, the CO2 concentration in the common space and the bathroom was higher than that in conditions 1 and 2, indicating that the air flow from the isolation room was more. Overall, it was observed that when the bathroom ventilation fan was off, the ventilation volume in the isolated room was increased by opening the ventilation port installed above the balcony window. On the other hand, the study confirmed that air flowed from the isolated room to the common space regardless of whether the ventilation port was closed or opened. Moreover, when the bathroom ventilation fan was on, the amount of air flowing into the common space and the bathroom was large, although the CO2 concentration in the isolated room was low owing to a large amount of ventilation.
Air flow due to the operation of the simple ventilation fan when the third ventilation system is on and off
Figure 10 shows the measurement results of changes in CO2 concentration over time under measurement conditions 5 to 7. Figure 10 reveals the results of measuring the simple ventilation fan when it is off (condition 5), operating at high speed (condition 6) and operating at low speed (condition 7) when the exhausted ventilation fan in the bathroom is off. When the ventilation fan in the bathroom and the simple ventilation fan was turned off, CO2 concentration in the isolation room was gradually increased to approximately 1500ppm. In addition, CO2 generated in the isolation room leaked to the common space and the bathroom, leading to an increase in CO2 concentration. However, two hours later, the CO2 concentration in the isolated room was gradually decreased after the simple ventilation fan installed in the ventilation port of the balcony window was operated (<1000ppm). Furthermore, CO2 concentration in the common space and bathroom became equivalent to the CO2 concentration of the outside air. Thus, there was no difference between the operation of the simple ventilation fans at high and low speeds.
Figure 10 :Changes in CO2 concentration over time (Condition 5, 6 and 7).
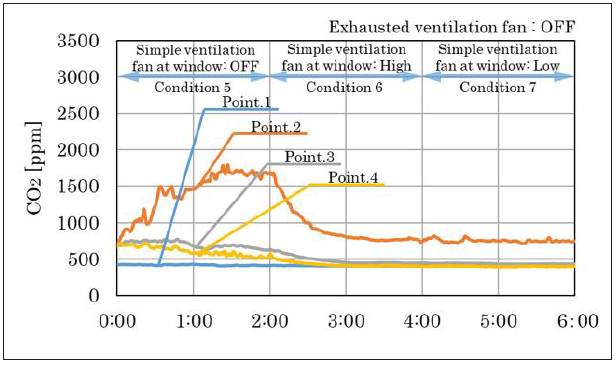
Figure 11 :Changes in CO2 concentration over time (Condition 8, 9 and 10).

Figure 11 shows the measurement results of changes in CO2 concentration over time under measurement conditions 8 to 10. It shows the results when the simple ventilation fan is off (condition 8), operating at high speed (condition 9), and operating a low speed (condition 10) when the ventilation fan in the bathroom is on. When the bathroom ventilation fan was operating, the CO2 concentration in the isolation room was approximately 1000ppm, which was lower than when the bathroom ventilation fan was not operating. However, it was confirmed that the CO2 concentration in the common space was increased. On the other hand, by operating the simple ventilation fan, CO2 concentration in the isolation room was lowered and that low in the common space and bathroom. Thus, this study showed that installing a simple ventilation fan at the ventilation port of the balcony window of the isolation room secured the ventilation volume of the isolation room and suppressed the air flowing in the common space.
Discussion
The World Health Organization (WHO) announced that the infection routes for COVID-19 (SARS-CoV-2) were droplet infection and contact transmission. To minimize infection, the WHO released guidelines stated securing a minimum distance of 1 to 2m from a person, wearing a mask, washing hands frequently, and disinfecting the indoor surface [25]. However, cases of cluster infection due to airborne infections have been reported in China and South Korea [26-28]. The WHO also reported that in case of insufficient ventilation in a room, there is a possibility of infection through aerosols generated from the infected person. Therefore, ventilation of closed spaces was recommended [29]. For ventilation of houses in Japan, mechanical ventilation equipment is obligatory as a measure against sick house syndrome and the ventilation frequency of the ventilation equipment is set at 0.5/h [11]. However, the ventilation system is rarely installed in the houses built before 2007 and it is confusing to secure the ventilation volume of the isolated room. In addition, the existing exhausted ventilation fan has a ventilation route planned so that air flows from the isolated room to the common space. Therefore, it is difficult to control the air in the isolation room not to flow into the common space.
In this study, air flow from the isolation room to the common space was supposed when a person who was positive for the COVID-19 test was treated at home. Assuming a house without an exhausted ventilation fan, the differential pressure and CO2 concentration were measured by opening and closing the ventilation port installed above the balcony window. It was revealed that air flowed from the isolation room to the common space where the bathroom, toilet, entrance and wash basin were located. In addition, when the ventilation fan installed in the bathroom was operated, air flow from the isolation room to the common space was confirmed. By opening the ventilation openings and operating the bathroom ventilation fan, CO2 concentration in the common space was found to increase gradually. Sufficient ventilation was secured in the isolation room via ventilation openings installed above the balcon windows and operating the bathroom ventilation fan. However, it is possible that the air flow from the isolation room to the common space will increase the risk of infection in the common space.
It was confirmed that when a simple ventilation fan was installed in the ventilation port above the window of the isolation room, air did not flow from the isolation room to the common space. At this time, the air volume of the simple fan installed in the isolation room was 79m3/h. The ventilation volume of the isolated room in this house was about 3.7 ACH. This study also confirmed that the CO2 concentration in the common space was hardly increased even when the simple ventilation fan was operated while the ventilation fan in the bathroom was operated. The reason for this is that this building is not airtight. There is a possibility that when the exhausted ventilation fan was operated, outside air flowed in through the gap between the entrance door and the window of the common space. In addition, the measurement results in this study found that the simple ventilation fan installed in the isolated room can prevent air from flowing from the isolated room to the common space.
Conclusion
This study focused on the ventilation of an isolation room in a house and on the airflow to the common space when a COVID-19 infected person was treated at home. The present study found that natural ventilation using the ventilation port of the isolation room was effective in securing the ventilation volume of the isolation room. Moreover, the ventilation volume in the isolation room could be increased by operating the exhausted ventilation fan in the bathroom, thereby reducing the risk of infection in the isolation room. The present study also demonstrated that the isolation room can be ventilated by operating a fan installed in the bathroom. However, this result means that the virus ejected from the respiratory tract of an infected person can flow into the common space, and there is a possibility that non-infected people in the house will be exposed to the virus in common space. Therefore, this study implies that existing ventilation methods pose a risk of airborne transmission between non-infected and infected persons in a shared space. It is considered desirable to install a simple ventilation fan or the like to perform local ventilation so that air does not flow from the isolated room to the common space. In addition, it is expected to block the air flowing out of the isolation room by supplying air to the common space, which will be conducted in a future study.
References
- WHO (World Health Organization).
- REUTERS.
- Ministry of health, labour and welfare.
- Cabinet Secretariat, Japan (Countermeasures for COVID-19 infection).
- Ministry of health, labour and welfare (Countermeasures for COVID-19 infection).
- Ministry of health, labour and welfare (ventilation method for improving closed space with poor ventilation).
- Tokyo metropolitan government (New coronavirus countermeasure site).
- News, home recuperation.
- Ministry of health, labour and welfare, Japan.
- Ministry of health, labour and welfare, Japan (Sick House).
- Ministry of land, infrastructure, transport and tourism.
- Residential ventilation equipment manual.
- Tung YC, Hu SC, Tsai TI, Chang IL (2009) An experimental study on ventilation efficiency of isolation room. Building and Environment 44(2): 271-279.
- Tungjai A, Kubaha K (2017) Indoor air quality evaluation of isolation room for hospital in Thailand. Energy Procedia 138: 858-863.
- Yang-Cheng S, Cheng-Chi C, Oscar W (2007) Dynamic airflow simulation within an isolation room. Building and Environment 42(9): 3194-3209.
- Ragil S, Nandy P, Imansyah Ibnu H, Fadhil Fuad R, Teuku Meurah IM (2021) Utilizing heat pipe heat exchanger to reduce the energy consumption of airborne infection isolation hospital room HVAC system, Journal of Building Engineering 35: 102116.
- American Institute of Architects (1996) Guidelines for design and construction of hospital and health care. Washington, DC: American Institute of Architects, USA, pp. 1-33.
- ASHRAE Handbook (2003) HVAC applications: Health care facilities. American Society of Heating, Refrigerating and Air-Conditioning Engineers (ASHRAE) Inc, Atlanta, Georgia, p. 1-7.
- Department of Human Services (1999) Guidelines for the classification and design of isolation rooms in health care facilities. Standing Committee on Infection Control, Department of Human Services, Vic, Australia.
- Health Canada (1996) Guidelines for preventing the transmission of tuberculosis in Canadian health care facilities and other institutional settings e IV Engineering controls to minimize TB transmission. Canada Communicable Disease Report, p. 22S1.
- Centers for Disease Control and Prevention (1994) Guidelines for preventing transmission of mycobacterium tuberculosis in health-care facilities. MMWR (Morbidity and Mortality Weekly Report) 43: NRR-13.
- Menzies D, Fanning A, Yuan L, Fitz Gerald JM (2000) Hospital ventilation and risk for tuberculous infection in Canadian health care workers. Canadian collaborative group in nosocomial transmission of TB. Annals of Internal Medicine 133: 779-789.
- Ministry of Land, Infrastructure, transport and Tourism.
- (2011) Ventilation requirements for acceptable indoor air quality shase, pp. S102-2011.
- (2020) WHO Modes of transmission of virus causing COVID-19: Implications for IPC precaution recommendations, USA.
- Shen Y (2020) Airborne transmission of COVID-19: Epidemiologic evidence from two outbreak investigations.
- Li Y (2020) Evidence for probable aerosol transmission of SARS-CoV-2 in a poorly ventilated Med Rxivpreprint, China.
- Park S, Kim Y, Yi S, Lee S, Na B, et al. (2020) Coronavirus disease outbreak in call center, South Korea. Emerg Infect Dis 26(8): 1666-1670.
- WHO (2020) Transmission of SARS-CoV-2: Implications for infection prevention precautions, USA.
© 2022 Hyuntae Kim. This is an open access article distributed under the terms of the Creative Commons Attribution License , which permits unrestricted use, distribution, and build upon your work non-commercially.
 a Creative Commons Attribution 4.0 International License. Based on a work at www.crimsonpublishers.com.
Best viewed in


.jpg)


 Editorial Board Registrations
 Submit your Article
 Refer a Friend
 Advertise With Us
.jpg)


.jpg)


.bmp)
.jpg)
.png)
.jpg)


.jpg)


.png)

.png)


.png)


