
- About Us
- Information
-

The Author ensures that the research has been conducted responsibly and ethically with adherence to all relevant regulations. read more..
- For Authors
- For Reviewer
- Manuscript Guidelines
- Membership
- Publication Ethics
-
- Journals
- Reprints
- e-Books
- Videos
- Policies
- Contact Us
 COVID-19
- Submissions


Full Text
Advancements in Civil Engineering & Technology
Soil Behavior Under Onshore Wind Turbine Foundation-Case Study in Brazil Using New French EOLIFT Technology
Imanzadeh S1,2*, Pantet A2, Taibi S2 and Ouahbi T2
1Normandy University, INSA Rouen Normandie, Laboratoire de Mecanique de Normandie, Saint-Etienne du Rouvray, France
2Normandy university, UNILEHAVRE, UMR 6294 CNRS, LOMC, 76600 Le Havre, France
*Corresponding author:Imanzadeh S, Laboratory of Mechanics of Normandy, Normandie University, France
Submission: February 11, 2021;Published: March 30, 2021

ISSN: 2639-0574 Volume4 Issue4
Abstract
In the face of future climatic and demographic challenges, the development of renewable energies is essential to face environmental challenges. The public works profession is involved in innovation, in the construction of production facilities (power stations, wind farms) and transport (technical galleries, underground and aerial networks), in connection with laboratories and universities. In the framework of the new French technology EOLIFT (for EOlienne LIF Ting) project, allowing the erection to take place at high wind speed without the use of large cranes, numerical analysis of the soil response at a spread footing interface of a very tall onshore wind turbine was conducted using a finite element method. The motivation of this study is to understand the soil structure interaction and the behavior of turbine foundation of this new EOLIFT technology. After presentation of project and geotechnical investigations of the study case in Brazil, it was chosen to study two cases of the superstructure effects on a rigid foundation laid on the soil or buried: (1) with generalized concept of the torsor applied on the foundation, (2) considering a more realistic superstructure representation using structure elements. The results showed the foundation’s depth influence. Finally, Case 2 is better to describe different construction phases of wind turbine.
Keywords: Geotechnical investigation; Soil-structure interaction; Slender structures; Wind turbine foundation; Numerical modelling; Differential settlements
Introduction
Currently, the increasing needs of renewable energy demand new research in the field
of wind turbines. According to Global Wind Energy Council (GWEC), worldwide installed
wind power exceeded 500,000 MW in March 2017. Around the world, this form of electricity
production is growing at a rapid pace, with an average annual growth rate of 30% over the
previous decade. In order to make wind energy more competitive against fossil energy,
technological innovations in recent years aim at increasing the power and the effectiveness
of the turbines. This requires higher wind turbines to obtain stronger and more regular wind.
When the soil has sufficient bearing capacity (with or without soil treatment), tall slender
structural systems, can be founded on shallow foundations. They are generally embedded
in the ground, during strong wind to prevent risks again tilting, overturning or as the case
may be moving or slipping. For that, the foundations of those structures should be designed
carefully to ensure long-term stability.
Tall wind turbines are classified in the 3rd geotechnical category which includes the
types of structures constructed in unusual conditions of soil and load [1]. Furthermore, the
design and construction of the foundations of these superstructures require understanding
the mechanical behavior of the soil which supports them. The system of loads under the
foundations is complex and not easy to identify the soil-structure interaction. They include
not only static loads as gravity but also cyclic and dynamic loads such as aerodynamic
effects, start-stop phase of turbine, turbulence etc. For the foundation design of such slender
structures, an eccentric inclined load, resulting from the wind load and the structure’s selfweight,
is generally considered. The failure by heaving or by sliding of the structure should
be particularly examined. Generally, the soil failure is often associated with the excess of
vertical load. For these slender structures, the analysis must consider the horizontal loads.
To avoid sliding, the shear developed between the footing base and soil underneath is
necessary. To extend such study, similar problems should be also examined experimentally and numerically in 3D with different soil configurations, such as
soil nature, soil properties, soil layers geometry and ground water
level. The 3D analysis seems to be mandatory in order to get a
better understanding of soil behavior.
The French Society for Soil Mechanics and Geotechnics (2011)
gives specific descriptions on the design, the execution and the
control of wind turbine foundations, which are principally based
on the Eurocode 7 [1] and the French Guide 62-V (1993). These
common referential documents are usually used for homogeneous
soils. For generally complex natural geological conditions such
as thickness layer variation and soil heterogeneity, finite element
methods (FEM) are more suitable. The FEM is particularly useful
for identifying the patterns of stress- strain distribution in the
soil. Many constitutive models are presented in the literature and
may model the mechanical behavior of soils at various degrees of
accuracy [2-4]. Some commonly used models are the Mohr-Coulomb
failure criterion, Hardening soil model, Hardening soil-small model
and Soft soil model [5,6]. Amongst them, the Mohr-Coulomb model
is generally considered as a first order approximation for soil
behavior. This model is relatively simple and widely used among
practicing engineers for the works of first and second geotechnical
categories [1]. To use the other behavior laws, it is necessary to
have many parameters, which are not easily to measure. Generally,
the properties are defined from database, own at each experimental
tests or literature review on similar soils.
The study of tall onshore wind turbines also takes part in
the EOLIFT project managed by FREYSSINET International, in
partnership with the Laboratory of Mechanics of Normandy-INSA
Rouen Normandy and the Laboratory of Waves and Complex
Media-University of Le Havre. This project is sponsored by French
government agencies within the program for the investment
of the future and the call for expressions of interest “Big Wind
Turbine” launched in 2011. As part of an AMI ADEME project,
the international group FREYSSINET has recently developed a
new technology, consisting in the construction of large onshore
wind turbines, made up of precast concrete cylindrical elements
assembled by pre-stressing. Erection of such towers performed
using a purpose-made system, called EOLIFT, allowing the erection
to take place at high wind speed without the use of large cranes. The
first construction site is located on the TRAIRI site, in the state of
CEARÀ in the NE of Brazil. To represent the construction site in the
numerical model, it is necessary to have a large set of data which
characterize the construction site in different conditions (static,
cyclic, dynamic) which are difficult to identify or to know due to a
lack of data [7]. The problem of transmission from the wind to the
superstructure and then, to the soils is always difficult and needs to
study with more detail.
The ground investigation on the construction site was realized
with the Standard Penetration Test, SPT [8,9] to determine
geotechnical profile variability of superficial soils and to follow the
wind tower distribution in the field. The soil strain modulus and
the internal friction angle values were deduced from the existing
correlations with the measured value of SPT-N [10-12]. Next,
the displacement and the stress fields under the wind turbine
foundation were studied with considering the Mohr-Coulomb
as a soil behavior. The project manager defines the loads of the
superstructure and the Service Limit State (SLS) data was used.
In the present research paper, after the description of the project
and the procedure to define the geotechnical data, some focus
will be put on the numerical analysis of stress and displacement
distributions in the soil under a large circular spread footing for
wind turbines under static loads with a finite element method using
Plaxis 3D© software [2,13]. The main objective of this research paper
is to analyze the effects of loads distribution and the wind either
by classical method with torsor (forces and moment) applied on
the foundation and either by considering the main superstructure’s
elements (tower, hub and blades) and wind as a horizontal force
applied at the blade level. Of course, torsor elements are equivalent
at the distributed loads by the superstructure. In the first case, the
resulting loads are eccentric inclined load applied in a point and
in the second case; the distributed loads under the superstructure
are applied on an annular area corresponding to the interaction
superstructure-foundation base. The numerical modeling by Plaxis
3D© with the Mohr-Coulomb model (MC), using the geotechnical
properties of soil along with different construction phases, is
successfully performed for these estimations.
First Prototype of Wind Turbine in the World Using the Eolift Technology
The current study will consider one of the areas in which FREYSSINET Company specializes, namely wind-powered generators. It will be specifically focused on soil displacement and stress under the foundation for wind-powered generators, deployed in Brazil. These displacement and stress could be caused by static, cyclic and dynamic loading due to the structure own weight and wind forcing.
EOLIFT technology
FREYSSINET Company developed a new concrete tower design and construction concept for craneless erection of towers (EOLIFT system), with potentially no limit on tower height and weight of concrete components.
The EOLIFT system offers a solution with:
a) Local pre-casting of the tower concrete segments on the
wind farm site using local resources, thus maximizing local
contents with also positive effect on carbon footprint,
b) Erection using purpose-made erection equipment,
allowing all workstations to be located at or near ground level
thus improving the safety of all operations
c) No wind constraint since the erection equipment is
designed to work up to a wind speed of 20m/s, which represents
the maximum wind speed for 95% of the time on an average
wind farm.
FREYSSINET Company implemented its EOLIFT technology in Brazil in 2016 on a prototype farm in TRAIRI, in the State of CEARA, where a wind farm already exists, because the geographical location, ocean influence and trade winds give many potentials for wind energy production. Three EOLIFT systems were commissioned for the project and 20 towers (hub mounted with 2.7MW turbines) were erected. This prototype project enabled an “in-situ” comparison between the efficiency of the EOLIFT system (Figure 1) and the classic erection method with high-capacity cranes. The trade wind conditions are favorable because a wind farm is already on the spot. FREYSSINET Company is therefore seeking new financial partners to develop this activity and secure market share in the field of tall towers for onshore wind farms using this French technology. Erection under these conditions requires controlling the wind speed and having a good soil quality under an EOLIFT system foundation, not sensitive to differential settlement [14] to ensure its stability and therefore the safety of assembly operation.
Figure 1:Tower erection (EOLIFT system).

Geological setting and local soils conditions of TRAIRI site
The construction of wind turbine site is located in Brazilian state of CEARA and specifically on the TRAIRI site. The latter is divided into four areas (Cacimbas, Estrela, Ouro Verde and Santa Monica, Figure 2). It is situated between Fortaleza and Acaraù River where littoral coast is oriented, ESE-WNW. The tropical climate is characterized by the wet and dry seasons, with wind intensity determined by the meridional shift of the Intertropical Convergence Zone [15]. The precipitation is negatively correlated with the wind power and between sea surface temperatures. The littoral landforms of CEARA state, Northeast of Brazil are the results of many geological events, such as the opening of the Atlantic Ocean during Cretaceous Period (110 Millions) and many phenomena linked to the climatic and eustatic evolutions [16-18]. A detritic sediment from Neogene (when the world level marine was very down inducing important erosion phenomena, named Formation Barreiras) is characteristic of the coastal zone. A vast field of active and stabilized sand dunes is on the coast of CEARA State (Figure 2). Paleo dunes are generally in red sand covered with vegetation, and overlie Barreiras Formation [19], the actives are much whiter (Figure 2).
Figure 2:a) Part of the lithology map of the site of TRAIRI (Zuquette et al. [12]), b) Littoral sediments along the coastal of State CEARA (Tsoar et al. [15]), c) Lines of tall wind turbine on TRAIRI site.

Their thickness varies between 2 to 30m, according to wind direction and intensity. Residual soils from Barreiras Formation mainly consist in unconsolidated materials formed from sandstones, siltstones and claystones. The weathered profiles are very variable due to the spatial distribution and frequently comprise three layers from highly, moderate to slightly weathered, in gradational contact with the bedrock [15,19]. The littoral area of CEARA state is very sensitive to urban development (harbors, constructions, dams, seaside resorts) and is characterized by high sediment transport with intense erosion process. In this condition the littoral erosion increases, helped by natural process with migration of transgressive dunes where the most important transport elements are the wind and the waves [19,20].
Ground investigation and SPT procedure
The aim of the ground investigations was to provide details of the
stratigraphy from the littoral complex. In this case, an underground
investigation was decided. The designers had considered that there
is sufficient information to assess construction risks. In the ground
investigation, to determine lateral variability of superficial soils,
Standard Penetration Test (SPT, ASTM, 2011), Lawson et al. [21] are
realized to follow the wind tower lines in the field. The Standard
Penetration Test is a dynamic penetration test, which allows
defining the soil nature and resistance to penetration. Based on SPT
test, geotechnical sections of the ground can be established about
the type of soil constituting the different parts of the ground. They
were organized one by one on the site of each tower wind. The SPT is
carried out in a borehole by driving a standard split spoon sampler
(length 450mm), using repeated blows of a hammer (weight 63.5
kg) falling through 762mm. The penetration resistance N is the
number required to drive the split spoon at the last 300mm, because
the first part is considered to have been disturbed. Known as an old
equipment for investigation, Terzaghi was the first using the term
Standard Penetration Test at 1947 [22]. To unify equipment and
practice, the International Reference Test procedure was published
in 1988 [23] and Clayton [24,25] gives procedures and standards
adopted around the world. SPT data can be corrected for a number
of site-specific factors to improve its repeatability. SPT is a simple
test with advantages and disadvantages [8,9], often underlined but
always largely used in the world [26].
In spite of the critical look at this test, it seems that many
authors use it to establish correlations with shear parameters or
to estimate the liquefaction potential of the soil under dynamic
loads. Recent studies, indicating the still very frequent use of this
test in the world [9,25,26]. SPT-N values were correlated with many
soils or weathered rock properties, with many empirical relations
but with a large database of information. Many researchers have
asked themselves the question about the quality of this parameter
and the possibility to give satisfactory correlations with the large
range of parameters. However, it is found in the recent literature
review, many studies about this field test showed good agreements
[8,27,28].
In sands, the N value has been found to be influenced by the
effective overburden pressure, relative density, particle size
and over-consolidation [29]. To its advantage, this in situ test
associates a measure of soil resistance with the taking of disturbed
samples allowing at least their visual identification. However, the
interpretation of the test is difficult because of numerous problems
of execution related to different technical parameters and to the
state of the soil, thus different authors made corrections. Among
the proposed relations for the correction of the value of N is that of
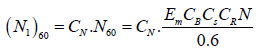
Liao and Whitman, 1986.
 (1)
(1)
where (N1)60: specific correction to SPT, CN: correction coefficient of the effective stress, Em: correction coefficient of hammer efficiencies, CB: borehole diameter correction, CS: sample barrel correction and CR: rod length correction. Bowles [12], Skempton [29], Seed et al [30], and Robertson et al [31] have proposed the values for Em, CB, CS et CR. Tokimatsu et al [32] have proposed the following formula to estimate the value of CN, with the effective stress expressed in kgf/cm2 (1kgf/cm2 = 98.1 kPa).
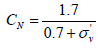 (2)
(2)
Given its widespread use around the world and studies on threshing and propagation of waves, some authors have proposed to establish correlations between the measured value of N and the common soil parameters: soil strain modulus (Es) and the internal friction angle (Ø'). These values of Es and Ø' are calculated from different semi-empirical models. In the literature, very little research proposes correlation between the SPT results and the soil strain modulus. Bowles [12] & Mikhejev [33] have proposed the semi-empirical models to estimate the soil strain modulus using relationships as presented in Table 1. These authors mentioned that these models are applicable to sandy soils. However, it can be seen that the soil strain modulus value given by these two models varies by a factor of 2 or more. In this research study, a mean value of soil strain modulus was chosen within the range proposed by these two models
Table 1:SPT semi-empirical models to estimate the soil mechanical parameters, Es in kPa and Ø' in degree 

On the other hand, with respect to the internal friction angle, Kulhawy et al. [10] & Wolff [11] proposed for sandy soils, semi-empirical models using relationships as presented in Table 1. These two models are consistent and give almost the same values of internal friction angle. A soil investigation field consisting in 36 SPT with a maximum depth of 22.45m has defined the organization of layers of sand and their mechanical characteristics. Figure 3 shows the poor-quality soil situated in the first meter’s depth in the case of the CACIMBAS area geotechnical section. The low consistency soil is situated in more or less than 3m, and from that depth it becomes moderately too much more consistent. One note that a lateral variation of the thickness of the layers and also a general increase of the compaction with depth.
Figure 3:Geotechnical profile of CACIMBAS site in Brazil, (GWT: Ground Water Table).

In this research paper, it was decided to study a foundation of the wind turbine on borehole SP3 of CACIMBAS (Figure 3). However, one can consider three representative layers (Table 2). The soil conditions were assessed, prior to tendering, using SPT, combined with the taking of disturbed samples for both visual classifications and sieve analysis. The revealed strata were mainly sands and silts. The mean measured SPT values for the three representative soil layers and for the borehole SP3 of CACIMBAS site are presented in Table 2. As one can see, the measured SPT values increased as depth increases. The value of N varies between 7 and 40. Table 2 shows also the soil parameters (Es, Ø') deduced from the correlations using the borehole SP3 of CACIMBAS on the TRAIRI site. The other soil parameters values are considered from the similar case studies in the literature [19,34] and are collected in Table 2.
Table 2:Soil properties and mean measured SPT values according to the boring SP3 of CACIMBAS area.

γd: dry unit weight of soil, γsat: saturated unit weight of soil, Es: soil strain modulus, C': cohesion, Ø’: friction angle, ψ: dilatancy angle, υ: Poisson’s ratio
The level water table was noted many times, but level variations and flow conditions were not sufficiently followed. Non-hydrogeological study was performed during a representative and meaningful time to understand the seasonal effects. This difficult point will be not discussed here, but it remains an important point [26]. In this research study, it is considered that there is no water table and then the interstitial pressure is zero, therefore the effective stresses are equal to the total stresses. Mohr-Coulomb's law as a soil behavior was considered because correlations were established with (Es, Ø'), the other soil parameters were taken from literature review [19,34].
Numerical Method and Assumptions
Numerical methods have been widely employed to solve
problems related to geotechnical engineering. They, nowadays, have
been largely used due to some advantages compared to analytical
methods and experimental works, such as reduced calculation
time, cost-effectiveness aspects, complex problem-solving ability,
and acceptable accuracy. A finite element code using Plaxis 3D
© [2] was used to perform finite element modelling. Theoretical
principles of the Plaxis are based on a finite element method that
has been developed specifically for analysis of deformation and
stability in geotechnical engineering projects. This software can
design and perform advanced finite element or limit equilibrium
analysis of soil and rock deformation and stability, as well as soil
structure interaction and groundwater and heat flow.
The soil behavior laws implemented in Plaxis software such
as Soft soil, Hardening soil, Cam Clay laws, isotropic elastic, Mohr-
Coulomb models may be applied [2,35]. Based on the behavior
of materials, an appropriate model should be selected. A mesh
optimization has been carried out beforehand to ensure the good
convergence of calculations. More information about the theoretical
principles of the Plaxis can be found in https://www.bentley.com.
Moreover, to validate the numerical computation, the numerical
simulations realized with the 3D finite element code were validated
by comparison with analytical solutions in the case of a circular
foundation resting on an elastic soil.
Soil data
From the basic underground investigations, a large and detailed bibliography was done to determine engineering properties and to establish site specific correlations between parameters, fabric and engineering properties. SPT values were discussed, and the Mohr-Coulomb law behavior was chosen on the one hand, for its simplicity and it requires few soil parameters, on the other hand, because it fairly well describes the behavior of the in-situ soils. Mohr-Coulomb parameters are defined in Table 2. Two layers (medium 6 m thickness, stiff sand 6 m thickness) laid on very stiff sand. Horizontal stratification, without thickness variations have been considered. The geotechnical properties increase with depth, from medium sand to very stiff sand. Yield surface of this model is an extension of Coulomb’s friction law to general states of stress [2]. It should be mentioned that this soil behavior does not consider the damage of soil modulus and it cannot be used to evaluate the soil fatigue under a foundation [36].
Figure 4:Model geometry in the finite elements code 3D for the foundation laid on the ground surface.

Figure 5:Model geometry in the finite elements code 3D for the superstructure laid on the ground surface.

No ground water level was considered, as the data are not sufficiently credible without hydrogeological investigations. Two cases were studied: A foundation on the ground surface and a foundation at a depth of 4.2m by considering two mechanical representation of the loads in static conditions. The depth ratio D/B (depth/diameter of foundation) ranges from 0 to 0.21. In order to consider effect of layering and mechanical properties of subsoil on the displacements and the soil stresses, the geometry modeled in finite element code was extended down to the influence depth of the foundation, which is given to be eight times of circular foundation width (Figure 4 & 5) [37].
Mechanical data of the superstructure
It is important to clarify the behavior of the soil structure interface under cyclic and dynamic loadings, but because of the lack of experimental data, only the structure behavior in static conditions is examined Figure 6. Indeed, the loads created by dynamic effects (aerodynamic effects, start-stop phase of turbine, turbulence etc.) are not sufficiently known. FREYSSINET Company has defined the static loading conditions with Service Limit State (SLS) data, respectively vertical and horizontal forces Fz, Fx, and the moment M as shown in Figure 4 & 7. The weight of the superstructure is 17.3MN. A horizontal force of 1.37MN and a moment of 109.6 MN.m represent the wind value effect. One must be careful, the study is realized a preferential the wind direction imposed in x axis, whereas in reality it is a variation zone defined by compass. As the convention in soil mechanics, all values depending on axis z (gravity direction) are given positive, so the problem is symmetric in the plane (x,z). From industrial information, one can accept that the weight of superstructure is the superposition of different elements: tower (50%), hub (34%) and blades (16%) [7]. In this study, the direction of the wind is defined by the blades position (Figure 7).
Figure 6:Schematic presentation of the main construction phases step by step.

Figure 7:Schematic presentation of the load distribution of the superstructure on the foundation.

To model the moment applied at the top of the foundation, two hypotheses are studied:
a. The first is to apply the moment at the center of gravity
of the foundation, in addition to vertical and horizontal loads
(Figure 7).
b. The second is to apply an eccentric inclined force, whose
eccentricity, multiplied by the vertical component of the
inclined force, generates an equivalent moment (Figure 7).
The idea is to compare these two approaches and analyze their
equivalence.
In this study, a circular wind turbine concrete foundation with a diameter of 19.8m and a depth of 4.2m is modeled as a rigid plate element in 3D finite elements code. The modeled soil mass is a parallelepiped volume of 160m of side in the horizontal plane and 80m of depth (Figure 4 & 5). The boundary conditions imposed at the parallelepiped edges are a zero-horizontal displacement on the sides and fixed at the bottom (Figure 4 & 5). Assuming an elastic behavior of the reinforced concrete foundation material, the unit weight, the Young’s modulus and the Poisson’s ratio are respectively 25 kN/m3, 30 GPa and 0.2. The soil-structure interaction at the base of the concrete foundation is characterized by a soil-concrete friction angle δ = 2/3 Ø’ where Ø’ is the friction angle of the soil.
The loads are represented either as a torsor applied on the rigid plate (Figure 4 & 7), by using the structures elements available in the database of 3D finite elements code (Figure 5 & 7). The main construction phases, step by step were simulated. Figure 6 summaries these different construction steps. A concrete tower with the height of 80m is also modeled as a rigid plate element. A hollow concrete cylinder with the external and internal diameters of respectively 7.2m and 6.8m, was used as a tower as shown in Figure 7. The equipment (blades and hub) is represented with vertical forces (Figure 5 & 7). Two cases have been considered: The foundation is located on the ground surface and the foundation is buried to a depth of 4.20m, with a 0.21 value of embedment ratio of the plate.
For the foundation simply laid (noted LF) on the ground surface, there are three steps, foundation construction, vertical load and eccentricity of inclined load or moment. For the buried foundation (noted BF), there are four steps, with added excavation phase before the foundation’s construction. A torsor is a mathematical tool well known to describe the movements of solids and the mechanical actions they undergo from their environment. The loads (total weight of the tower, the hub and the blades and wind effects) are represented by a torsor, defined as a set of two fields, F the resultant and the moment applied at the gravity center (Figure 4 & 7). It could be replaced by the resultant applied at an eccentricity defined by e = M/F. This method, named Meyerhof theory is common in soil mechanics [12].
With the other method using structure elements, the total weight of wind turbine is defined with the tower weight (50%), hub weight (34%) and blades weight (16%) as shown in Figure 7. The wind effects represented horizontal force, applied at the top of superstructure, at the center of the blades (Figure 5). In this case, it is not necessary to apply a moment, because it is created normally by the construction and the position of the horizontal force applied at the center of the blades. It is assumed that the action of the wind occurring after the construction of the superstructure. The superstructure is represented by the total weight (tower, blades and hub). Finite element mesh, which comprises 10-node tetrahedral elements, was generated automatically regarding the maximum allowable element size.
In all cases, the soil failure
In all cases, the soil failure is not reached and the soil remains in the elastic domain. The level of loads is lower than the bearing capacity of soil. This point has been also verified by analytical methods (EC 7) based on Terzaghi’s principles [38]. Generally, the calculation of this type of structure is governed more by the criterion of deformation than the criterion of rupture. They are significantly affected by wind and consequently the lateral forces are important. The calculation of the global construction (without steps) is in agreement for the final displacements and the mechanical stresses [39]. The bearing capacity of the soil is reached for many high values. In all cases, the total displacements and the vertical stresses at the level -4.5m in the plane of the wind (x,z) were observed. So, the results are presented in Figure 8 & 9. In the case of laid structure, the superficial layer, in medium sand has a thickness of 6m, whereas, in the other case, the thickness is 1.8m.
Figure 8:Displacement and stress profiles at 4.5m/ground surface for laid and buried foundations submitted to the resultant torsor (x: -20m, +20m).

Figure 9:Displacement and stress profiles at 4.5m/ground surface for laid and buried foundations submitted to the superstructure (x: -20m, +20m).

Torsor analysis
If the loads are represented by torsor elements step by step
or all together, the same results are obtained at the final step. The
superposition principle is valid because the soil behaves in linear
elastic manner. Figure 8 collected the results at a depth of 4.5m,
either 4.5m under the laid foundation, either 0.3m under the buried
foundation (with an excavation phase) under vertical loads. These
results show a symmetric behavior. If the foundation is laid on the
ground surface, the profile displacement is similar to Gaussian curve
and the distribution stresses under the foundations are uniform. If
the plate is buried, after excavation an uprising is observed, then
the profile displacement is uniform and the distribution stresses
show arching effect like under a rigid plate.
Under eccentricity or moment, it is noticed that for laid
foundation, an asymmetric curved profile displacement and
trapezoidal to triangular stresses distribution. Of course, the same
results are obtained for the two representations of the eccentricity
rule (step 4’) and moment (step 4). For buried foundation, the
profiles of displacement became triangular. Stress distribution is
also modified to triangular profile, but it is reduced compared to
the laid foundation. Integrating an excavation phase with a depth
of 4.2m and also the diameter (19.8m) are important for the final
results and reducing the thickness of the first layer modifies the soil
response regarding both displacements and stresses.
There is a clear difference related to the embedding of the
foundation where torsor is applied at the center of foundation.
It is logical to find a weaker displacement with a laid foundation
because the diffusion of stress is as a function of depth. The
initial state stress is similar at 4.5m depth, but the impact of the
stress-strain distribution is significant for the shape of profiles
but insignificant for the average values. The thickness of the layer
between the bottom of the foundation and the observation level
has an important effect as a mattress. This is conformed to the soil
mechanic assumption based on the theory of plates developed by
Boussinesq [39] if the foundation is rigid or flexible. There is an
intermediate depth in the soils, where the rigidity of the plate or the
foundation has a smaller effect. When the soil mattress thickness
between the base of the foundation and the observation level is
important, the profile becomes more and more flexible, depending
on the deformation modulus of the concerned soil.
Interaction soil structure analysis
It was observed a similarity of the displacements and
stresses for each characteristic step with the consideration of
the main elements of the superstructure giving the same efforts.
Integrating an excavation phase is also important for the final
result and reducing the thickness of the first layer modifies the soil
response regarding both displacements and stresses. Although the
representation with the superstructure reveals a moment of gravity
related to the difference of the distributions of the superstructure
weight, which is increased by that of the wind (Figure 5 & 7).
The advantage of using the main elements of the superstructure
(tower, hub and blades) is to show a moment of gravity before
the application of the effects of the wind. The tower weight is
represented by an annular uniform load and not with a vertical
force applied to the center of the foundation as shown in Figure 7.
It is more in conformity with the real case. A curved displacement
profile is associated to a constant stress profile, and a constant
displacement profile is associated to a curved stress profile (Figure
9). This is in agreement with the knowledge about the flexible and
rigid foundation assumption in soil mechanics [40].
Figure 10:Comparison of the two loading systems for the last construction phase.

When the horizontal force simulated the wind is applied at the
center of blades, it results reversal and tilt. Differential settlements
occur and can become prejudicial to the wind tower. The maximum
displacement values are nearly similar, but the shape of the curves
is different. The thickness of soil between the base of the foundation
and the observation level (4.5m) has an important impact on
all the profiles. However, the comparison between the two methods
(Figure 8 & 9) is not very significant for displacements (a difference
about of 0.2mm), but significant on the stress’s profiles (difference
about 100 kPa for maximum stress). This was shown in Figure 10
where the comparison of the two-loading system is presented for
the last step of construction phase. To understand the depth factor
reduction (0 and 0.21), the influence of the observation level in the
two cases (laid and buried superstructure) is examined with depth.
As the initial stress state depends on the depth, (it must be remembered
that soils are naturally pre-stressed materials), and the impact
of the excavation phase, the differences between Laid Foundation
(LF) and Buried Foundation (BF) are more important [41].
The depth of the plane observation has a significant effect on
the distribution of stress in soils. So, one can discuss the mattress
effect between the base of the foundation and the observation level.
The scenario is more realistic with superstructure. Indeed, one can
also visualize the tower deformation (Figure 11). This research
study is simplified, but this finite element code 3D can give some
help to the wind tower designers. The project manager often
divides the problem, one for superstructure, the other for the soil
bearing capacity. Here, it is shown the possibility to increase the
knowledge between soil-structure interaction, of course with some
simplifications, but it remains interesting. To clarify the effect of the
thickness of the layer between the base of the foundation and the
level of observation, the calculations were completed only for the
superstructure in both laid and buried configurations. Gradually,
this thickness in both cases was increased. It must not be forgotten
that for the laid structure, the superficial layer, in medium sand has
a thickness of 6m, whereas, in the other case, the thickness is 1.8m,
and the ground soil is stratified (Figure 12).
Figure 11:Zoom of the deformed mesh scaled up 20 times a) foundation laid on the ground surface, b) superstructure laid on the ground surface.

In the case where foundation is laid at ground surface, the profile was examined at 4.5m under the foundation. In the case of the buried foundation, the profile was examined at 0.3m under the foundation (Figure 12). When the soil thickness between the foundation and the observation level is small, the effect of the embedment depth is important. For a thickness of 0.3m under the foundation in both configurations, the maximum displacement is -7.2cm for the buried foundation and -11.1cm for a foundation simply laid (Figure 12). For a thickness of 4.5m under the foundation in both configurations, the maximum displacement is -4.7cm for the buried foundation and -6.2cm for a foundation simply laid (Figure 12). Moreover, the greater the thickness increases, the more the shape of the deformed surface becomes curved. This thickness is the function of a mattress, which modifies the distribution of displacements, from uniform to curved, under vertical loads. The effect of the moment creates a tilt [42].
Figure 12:Maximum displacements under the foundations at different levels according to the different construction phases a) laid foundation, b) buried foundation.

It is worth to remember the important conditions in soil mechanics, about the soil-structure interaction. Figure 13 is an example of the stress profiles observed following the soil-structure interaction under a flexible and rigid foundation. For a rigid foundation, near to the ground soil, arching effect appears. With wind effect, the profile becomes triangular similar to a flexible foundation. The stress difference (σmax - σmin) for each construction phase at different levels is presented in Table 3. After comparing the columns levels -0.3 (LF)m, -4.5 (LF) and -0.3m (BF) in the Table 3, the difference of stresses is higher for buried foundation. In LF condition, stresses decrease because of Boussinesq effect and homogeneous soil, but not for BF, because the properties of second soil layer (stiff sand) have an influence on the results. When the loads are not only vertical (steps 4 and 5, Figure 9) for both buried and laid foundations, the difference increases and at the same time the shape of the profiles is approximately modified from uniform to triangular for the rigid case.
Table 3: Stress difference (σmax - σmin) in (kPa), for different construction phases at different levels.

Figure 13:Comparison of the shape of stress profiles according to the elasticity theory in soil mechanics [38].

In soils mechanics, the increasing of average stresses is defined by (σmin+σmax)/2 brought by a superstructure depending on the construction steps and progressively reducing with the depth. By using the initial stress (σini), defines as a geostatic stress at the observation level, a dimensionless relative factor is defined to compare the results more easily [43].
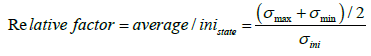 (4)
(4)
The consideration of an excavation phase is very important for the stress fields, because the geostatic stress fields influence it. When the dimensionless relative factor is determined, the calculated values according to the stresses data are near between the two cases except for the observation level of -0.3m for the laid foundation, because the numerical calculation gives very small negative stresses near to zero. These negative values have no physical signification where soil cannot support traction (Figure 14). Finally, the comparison of the displacement and stress fields in the two cases at the final step is presented in Figure 15. The affected zone by the construction is more important if the foundation is laid, for both displacements and stresses [44,45].
Figure 14:Relative factor for different construction phases, with the depth foundation at different levels.

Figure 15:Comparison of displacement iso-values and diffusion of stresses only in soils (BF: Buried Foundation, LF: Laid Foundation).

Even, the representation of the superstructure actions gives near results compared to torsor representation, it is chosen to adopt the superstructure representation, not more difficult to be used, because it presents a better scenario of the construction while introducing the wind effect. To deepen this study, it is necessary to consider complex phenomena such as construction phasing during the implementation of the EOLIFT system, soil fatigue related to the dynamic loading imposed by the structure, as well as the presence of fluctuating water tables. This study is currently underway.
Conclusion
Firstly, it is important to underline that the design presented
here is an adaptation of the site of TRAIRI, where wind turbines
farm was built by FREYSSINET thanks to the EOLIFT system. The
site is located near the littoral coast in CEARA State, where wind
intensity is determined by the meridional shift of the Intertropical
Convergence Zone. The geotechnical soil investigation was done
by the Standard Penetration Test (SPT). Although, SPT is the most
commonly used method in the world for in-situ soil investigations,
it provides only limited information, such as penetration resistance
with N value. Some correlations have been proposed to determine
the soil mechanical properties from the measured value of N.
However, the correlations allow determining only the Mohr
Coulomb parameters. The soil parameters deduced from the
correlations were used in the design of a wind turbine foundation,
after detailed literature review. In geotechnical application,
for numerical modeling, horizontally stratified site is generally
investigated. To represent the variation of the layer thickness is
more difficult, but it would be possible to approach the geological
conditions.
In this project, the representation of the loads by torsor or by
using structure elements are similar and the results (displacements
and stresses distributions) are neighbor, however the step-by step construction is more detailed in the second case. Indeed, a
moment appears because of the different weight between hub
and blades. The similarity of the results is also linked with the
rigidity of the concrete foundation (a plate of 4.2m thickness with
concrete characteristics). However, there is a clear difference
related to depth factor reduction (depth foundation/diameter
of the foundation) because it has introduced a phase excavation
and consequently modification in the stress-strain state. The
embedding of foundation of the wind turbine tower (laid or
buried), has a significant effect on the distribution of the profiles
of displacements and stresses according to the observation level.
To complete this first analysis, it could be decided to adopt the
second representation with taking into account superstructure
elements. The interaction soil/foundation/ superstructure could
be adapted to study the cyclic and dynamic effects with different
interface conditions. However, to be able to follow the cumulative
displacements during functional cycles, it would be necessary to
introduce parameters to describe the damages of the materials
during a cycle number, intensity and frequency of the wind effects,
defined by compass from the studied site. In-situ, some wind
turbines have been instrumented at the soil-foundation interface
to follow the evolution of stresses and displacements in long-term
service. As soon as the data of these measurements are acquired,
a comparison with the numerical results will be carried out and it
will be the object of a new publication in this journal.
References
- Collectif (1996) Eurocode 7, Norme XP 1997-1: Calcul géotechnique: AFNOR.
- Brinkgreve RBJ (2005) Selection of soil models and parameters for geotechnical engineering application. In: Yamamuro JA, Kaliakin VN (Eds.), Geotechnical Special Publication 128: 69-98.
- Ti KS, Huat BBK, Noorzaei J, Jaafar MS (2009) A review of basic soil constitutive models for geotechnical application. Electron J Geotech Eng 14: 1-18.
- Plaxis 3D Manuals (2013) Plaxis BV, Netherlands.
- Surarak C, Likitlersuang S, Wanatowski D, Balasubramaniam A, Oh E, et al. (2012) Stiffness and strength parameters for hardening soil model of soft and stiff Bangkok clays. Soils and Foundations 52(4): 682-697.
- Schweiger HF (2009) Influence of constitutive model and EC7 design approach in FE analysis of deep excavations. Proceeding ISSMGE Int Semin Deep Excav Retaining Struct - Budapest, Hungary, pp. 99-114.
- Fitzgerald B, Basu B (2016) Structural control of wind turbines with soil structure interaction included. Eng Struct 111: 131-151.
- Fabbrocino S, Lanzano G, Forte G, Santucci de Magistris F, Fabbrocino G (2015) SPT blow count vs. shear wave velocity relationship in the structurally complex formations of the Molise Region (Italy). Eng Geol 187: 84-97.
- Hettiarachchi H, Brown T (2009) Use of the SPT blow counts to estimate shear strength properties of soils: Energy balance approach. J Geotech Geoenvironmental Eng 135: 830-834.
- Kulhawy FH, Mayne PW (1990) Estimating soil properties for foundation design. EPRI Report EL-6800, Electric Power Research Institute, USA, p. 306.
- Wolff TF (1989) Pile capacity prediction using parameter functions. ASCE Geotechnical Special Publication 23: 96-107.
- Bowles JE (1996) Foundation analysis and design. (5th edn), The McGraw-Hill Companies, New York, USA, pp. 624.
- Nordal S (1999) Present of Plaxis. Beyond 2000 in Computational Geotechnics-10 Years of PLAXIS International. Balkema, Rotterdam, Netherlands, pp. 45-54.
- Imanzadeh S, Denis A, Marache A (2014) Foundation and overall structure designs of continuous spread footings along with soil spatial variability and geological anomaly. Eng Struct 71: 212-221.
- Tsoar H, Levin N, Porat N, Maia LP, Herrmann HJ, et al. (2009) The effect of climate change on the mobility and stability of coastal sand dunes in Ceará State (NE Brazil). Quat Res 71(2): 217-226.
- Braga APG, Passos CAB, Souza EM, França JB, Medeiros MF, et al. (1981) Geology of the northeastern region of the State of Ceará, Fortaleza Project, Brazil, p. 123.
- Carvalho AM (2003) Coastal dynamics between Cumbuco and Matões-NW Coast of the State of Ceará: Emphasis on wind processes. Universidade Federal da Bahia, Salvador, Brazil, p. 188.
- Perrin P, Costa MIP (1982) The coastal dunes in the region of Natal-RN. In: Proceedings of the quaternary symposium of Brazil, 4° Belo Horizonte (MG), Brazil, pp. 291-304.
- Zuquette LV, Pejon OJ, Dos Santos Collares JQ (2004) Engineering geological mapping developed in the Fortaleza Metropolitan Region, State of Ceará, Brazil. Eng Geol 71: 227-253.
- Castro JWA, Malta JV, Miguel LLAJ, Cabral CL, Passemilio AB (2017) Chronological reconstruction of eolianites and transversal mobile dunes of northwest coast of Ceará State - Brazil, in the last 3000 cal yrs BP. 28: 51-57.
- Lawson WD, Terrell EO, Surles JC, Moghaddam RB, Seo H, et al. (2018) Side-by-side correlation of Texas cone penetration and standard penetration test blow count values. Geotech Geol Eng 36: 2769-2787.
- Terzaghi K, Peck RB, Mesri G (1948) Soil mechanics in engineering practice. John Wiley & Sons, New York, USA, p. 566.
- Decourt L, Muromachi T, Nixon IK, Schmertmann JH, Thorburn SC, et al. (1988) Standard Penetration Test (SPT): International reference test procedure. ISOPT I, Orlando, USA.
- Clayton CRI (1990) SPT energy transmission: Theory, measurement and significance. Ground Engineering 23(2): 33-42.
- Clayton CRI, Simons NE, Matthews MC (1995) Site investigation. Halstead Press, New York, USA, p. 424.
- Simons N, Menzies B, Matthews MA (2002) A short course in geotechnical site investigation, London. Thomas Telford Publishing, London, England, p. 353.
- Dikmen U (2009) Statistical correlations of shear wave velocity and penetration resistance for soils. J Geophys Eng 6: 61-72.
- Mendes R, Lorandi R (2008) Analysis of spatial variability of SPT penetration resistance in collapsible soils considering water table depth. Eng Geol 101(3-4): 218-225.
- Johari A, Khodaparast AR (2013) Modelling of probability liquefaction based on standard penetration tests using the jointly distributed random variables method. Eng Geol 158: 1-14.
- Youd TL, Idriss IM, Andrus RD, Arango I, Castro G, et al. (2011) Liquefaction resistance of soils: Summary report from the 1996 NCEER and 1998 NCEER/NSF Workshops on evaluation of liquefaction resistance of soils. J Geotech Geo-environmental Eng 127: 297-313.
- Skempton AW (1986) Standard penetration test procedures and the effects in sands of overburden pressure, relative density, particle size, ageing and over consolidation. Geotechnique 36(3): 425-447.
- Seed HB, Tokimatsu K, Harder LF, Riley CM (1985) Influence of SPT procedures in soil liquefaction resistance evaluations. Journal of Geotechnical Engineering 111: 12.
- Robertson PK, Wride CE (1998) Evaluating cyclic liquefaction potential using the cone penetration test. Can Geotech J 35(3): 442-459.
- Tokimatsu K, Yoshimi Y (1983) Empirical correlation of soil liquefaction based on SPT N-value and fines content. Soils and Foundations 23(4): 56-74.
- Mikhejev VV (1961) Foundation design in the USSR. (5th edn), ICSMFE 1: 753-757.
- Rogers JD (2006) Subsurface exploration using the standard penetration test and the cone penetrometer test. Environmental and Engineering Geoscience 12(2): 161-179.
- Brinkgreve RBJ, Vermeer PA (1997) Plaxis finite element code for soil and rock analysis-Version 7. Balkema, Rotterdam.
- Imanzadeh S, Cuffel S, Pantet A (2016) Soil behavior under foundations of very tall wind turbine. EMI International Conference, France.
- Boussinesq J (1885) Application of potentials to the study of balance and motion of elastic solids, Gauthier-Villars, Paris.
- Kachkouch FZ, Rodriguez D, Imanzadeh S, Melen B (2016) Behavior of soils under high-rise wind turbine foundations. National Days of Geotechnics and Engineering Geology (JNGG), Nancy, France, p. 8.
- Pouv KS, Ouahbi T, Pantet A (2014) Foundation of onshore wind turbines-case of a stratified massi. 32nd AUGC Meetings, Polytech Orleans, France, p. 10.
- ASTM D1586-11 (2011) Standard test method for standard penetration test (SPT) and split-barrel sampling of soils. ASTM International: West Conshohocken, USA.
- French Committee for Soil Mechanics and Geotechnics (CFMS) (2011) Wind turbine foundation.
- Liao S, Whitman RV (1986) Overburden correction factors for SPT in sands. Journal of Geotechnical Engineering 112: 373-377.
- Ministry of equipment, housing and transport, technical rules for the design and calculation of foundations for civil engineering works (1993) Fascicle No. 62.
© 2021 Imanzadeh S. This is an open access article distributed under the terms of the Creative Commons Attribution License , which permits unrestricted use, distribution, and build upon your work non-commercially.
Editor In Chief


.jpg)


Signup for Newsletter

Quick Links
 Editorial Board Registrations
 Submit your Article
 Refer a Friend
 Advertise With Us
Our Recent Edition

.jpg)


Top Editors


.jpg)


.bmp)
.jpg)
.png)
.jpg)


.jpg)


.png)

.png)


.png)


Financial Support

Sponsors

Latest e-Books

Latest Video

 a Creative Commons Attribution 4.0 International License. Based on a work at www.crimsonpublishers.com.
Best viewed in
a Creative Commons Attribution 4.0 International License. Based on a work at www.crimsonpublishers.com.
Best viewed in