- Submissions

Full Text
Advancements in Civil Engineering & Technology
Accuracy of Code Compliant Design-Stage Building Energy Performance Simulation Models
Sergio Tarantino*, Patrick Shiel and Martin Fischer
Department of Environmental and Energy Engineering, USA
*Corresponding author: Sergio Tarantino, Department of Environmental and Energy Engineering, Stanford, CA 94305-4020, USA
Submission: March 02, 2020;Published: March 13, 2020

ISSN: 2639-0574 Volume4 Issue2
Abstract
Energy reduction standards have been adopted in legislation by many US states, such as ASHRAE 90.1. Aspects of 90.1 have also been adopted within many country’s national mandated building regulations. The development of Building Energy Performance Simulation (BEPS) models is one of the principal methods used to show compliance with these mandated building codes. In order to achieve the higher levels of certification of LEEDTM, a design stage model is virtually a requirement. Researchers and practitioners are indicating a growing concern with the perceived inaccuracies of BEPS models when compared to an occupied building’s energy usage. While the standard’s authors state that compliance models should not be used to compare to the actual building’s energy use, the developers funding the creation of such models, may not be aligned with this view.
This study has been undertaken in order to assess the accuracy of BEPS models developed to show code compliance and where these models fit on the spectrum of design stage models. A methodology has been developed to examine these model’s accuracy at different points through the building design process, from early stage conceptual design to finished construction, but pre-occupation. Four different building types have been examined to determine the relative complexity and accuracy of five typical pre-occupation model stages. The study assesses the accuracy of each of the five model types when compared to the actual energy usage figures for each building and discusses the industry expectations of a particular model type.
Keywords: Building energy performance simulation; Building energy model; ASHRAE 90.1; Code compliance; Energy model sensitivity analysis; Performance Gap
Background
Curbing energy usage in new commercial buildings has become a common theme within
mandated standards adopted by many states of the US. Since 1975, when ASHRAE first
published its Energy Standard for Buildings following the first oil crisis [1], focus has been
placed on the energy efficiency of buildings during the design and construction phases. Most
of these standards attempt to allow the buildings designers flexibility in how compliance can
be demonstrated. ASHRAE 90.1 [2], has been adopted by many states in the US and is the most
common of the national energy conservation standards for commercial buildings. It is also
used as a benchmark for many country’s national standards such as the Middle East, Africa
and Asia. 90.1 has been updated on a continuous maintenance basis starting in 2001. Since
then the standard has re-issued in revised form every three years following the evolution
of more efficient equipment and building technological advances. Certain states, whilst
following the general guidance offered within ASHRAE 90.1, compiled their own standards,
such as California’s Title24, which is administered by the California Energy Commission (CEC).
Title24 is effectively a version of 90.1, but with different parametric thresholds to achieve
compliance. Although the two codes are developed separately, a fair amount of synergy and
similarity exists [3].
Starting from 2016, there are three possible paths for showing code compliance in
Standard 90.1: one Prescriptive path and two Performance paths named Section 11-Energy
Cost Budget (ECB) and Appendix G-Performance Rating Method. The Prescriptive path
requires certain building elements and components to meet or exceed the minimum thermal
performance requirements imposed. Properties of these elements need thermal transmittance
values (or U-Values) to be equal to or lower than those prescribed. Both Standard 90.1
Performance path can accommodate certain trade-offs between façade materials and
requires a whole building analysis which demonstrates that the proposed building uses less energy than a baseline building specified within the standard. A
building energy simulation model is used to compare the proposed
building design with a baseline. Appendix G provides a significant
advantage over the ECB performance path. The baseline in ECB,
to which a proposed building design is compared, is essentially a
clone of proposed design, with each parameter set at exactly the
prescriptive code efficiency level. Appendix G on the other hand,
uses a more independent baseline, where many of the parameters
are set to standard practice, thus allowing credit for design features
that go beyond standard practice.
This should encourage integrated design and results in
lower energy consumption in buildings [4]. The Standard
90.1-2016-Appendix G performance path requires the building
(the full architectural model) to be analyzed with the proposed
parameters (this building is called Proposed Building Design) and
then with the standard practice parameters (the Baseline Building)
[2]. The energy usage of the proposed building design must not
exceed that of the standard baseline building. The comparison
between the two model results is used to calculate the Performance
Cost Index (PCI). PCI is calculated as the ratio of the proposed design
energy cost and baseline building energy cost and needs to be less
than targets shown in a table based on building type and climate
[2]. The intent is that any building energy code or beyond code
program can use this methodology and merely set the appropriate
PCI for their needs.
ASHRAE 90.1 Appendix G is indeed used to rate the
performance of buildings for “beyond code” programs including
USGBC’s LEED Rating System, ASHRAE’s Green Building Standard
189.1, and the International Green Construction Code (IgCC). The
USGBC who introduced the LEEDTM certification process in 2000
and updated to v4 in 2010 [5], also leverages Standard 90.1 as a
baseline comparison. With the 90.1-2016 Appendix G version, code
compliance and beyond-code programs such as LEED share the
same modeled baseline. LEED v4 also includes a pilot credit based
on Appendix G performance rating method. For the purposes of
this study, building energy simulation can be regarded as a generic
term used to describe the process whereby a Building Energy
Performance Simulation (BEPS) model is created for the building
under design. In seeking to show compliance with the required
local standards, be they mandatory or indeed discretionary such
as LEEDTM, there appears to be a growing need and requirement
for the creation of a design stage BEPS model. This is clear from
participants in the AIA 2030 Challenge in 2015, in which 37% of
new commercial buildings >200Ksqft and 50% of medium sized
buildings (50K-200Ksqft) had a building energy model created
during the building design process [6].
Historically however, a reasonable perception has developed
within the construction industry and research community that
BEPS models are generally not accurate. Regardless as to why this
inaccuracy exists and the reasons BEPS models are created in the
first place, it is important that a better understanding is sought as
to the accuracy of a BEPS model specifically designed to achieve
compliance with ASHRAE 90.1 and the parametric inputs which
may influence such accuracy.
Introduction
BEPS models are under-utilized for the reason that they lack the credibility of an accurate forecasting tool [7]. The cost of developing and the time to develop an energy model has also been a significant barrier [8]. Since the beginnings of building energy simulation and modeling, researchers and practitioners continue to highlight the often-large discrepancies uncovered when comparing the building energy performance predictions outcomes of design stage BEPS models and the actual energy consumption of buildings, postoccupancy [9-11]. In general, it is possible to conclude that design stage BEPS models do not accurately predict post-occupancy building energy consumption.
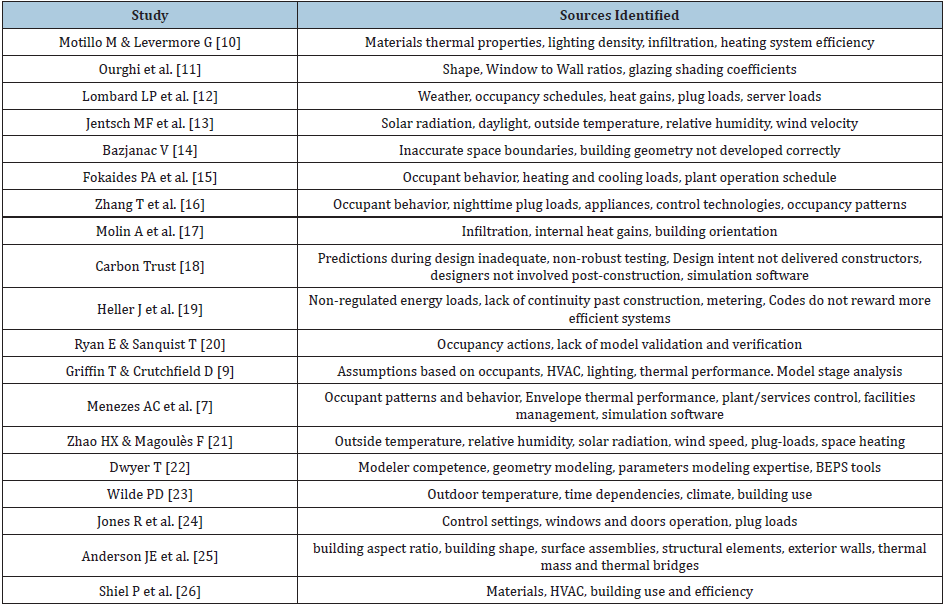
There is an increasing concern about the existing mismatch typically addressed as the “performance gap” [12,13]. Reducing the performance gap is fundamental to allow building design to provide serious input into the delivery of buildings that meet the expected performance. Researchers have attempted to enhance forecasting accuracy by using more accurate input parameters and observed data from the occupied building. This process is commonly known as model calibration [14]. Multiple studies have focused on model input parameters and identified several causes of discrepancy between BEPS predictions and actual post-occupancy measured building energy performance [15-29]. The list in Table 1 indicates these previous studies and reports the parameters identified as main sources of influence on the overall BEPS accuracy, in the respective studies (Table 1).
Table 1:Sources explaining some of the causes of the energy model performance gap.
The design of a building presents a complex challenge in terms of energy modeling and accurate prediction. Different types of BEPS models are developed during a building’s design stage. Each model iteration at any building’s design phase affect the BEPS predictions. Any design-stage BEPS model is characterized by a multiplicity of parameters including materials properties, occupancy levels, equipment schedules, HVAC and plant operation, climate and weather [14]. The importance of these parametric groups has been highlighted within the development of the IEA EBC Annex 53 and Annex 66. The annexes have sought to develop a common framework of terms, data representations and methods within energy analysis of buildings [30,31]. While the post-occupancy calibration process typically results in a more accurate BEPS model, it offers little guidance on how to improve the accuracy of a designstage BEPS model or indeed, to indicate how accurate the model used to achieve code compliance might be when compared to actual energy usage, post-occupancy.
During the design phase, energy modeling is often introduced too late in the process to substantially affect key design decisions and instead, the BEPS model is often used as an accounting or code compliance tool to establish that only minimum requirements are met. Used in this way, design teams overlook significant opportunities to inform and improve building design [7]. Given the costs of implementing a BEPS model for compliance purposes [8], the opportunity to use it to predict future building energy performance with a high accuracy level helps to bring real value for building owners and developers. The design team might expect that the model should allow them to accurately experiment with many high efficiency and high-performance conceptual options to achieve better and more efficient buildings. Design stage BEPS models can then be leveraged to support post-occupancy building operations, rather than something to be discarded after compliance has been achieved.
In this context, RMF/NREL has discussed the value of design stage BEPS models to inform the design team of the effects of design decisions, if building efficiency is a primary goal [32]. This would imply that accuracy is an important requirement of these early design models. However, a diffuse lack of comprehension of the impact of BEPS parameters on design-stage simulation results’ accuracy undermines the value of BEPS adoption. Moreover, it limits the BEPS goal to support and catalyze the development of new business models able to serve multiple stakeholders throughout the whole building lifecycle, such as performance-based contracting [26]. Assessing the differences in prediction accuracy between BEPS models developed at the concept stage of the building design phase, models developed to show compliance with ASHRAE 90.1 and model used to predict post-occupancy performance represents the first step to bridge the performance gap between design goals and post-occupancy achievements.
Common design stage BEPS models
BEPS models created during building design are generally used for one of three purposes:
A. To compare design alternatives.
B. To document compliance with a code or a standard.
C. To predict future energy use.
From earlier work [29], nine types of BEPS models have been identified which can be developed during a building’s design stage, primarily depending on available data. It has been shown that the particular model type implemented and the stage of building’s design phase at which it gets implemented, will affect the models’ accuracy. By following the ASHRAE guidance for BEPS model parameter classification, the major parametric groups used in any BEPS model can be broken down into four categories:
A. Design: geometry, materials, glazing.
B. System: comfort provision with HVAC (plant and schedules).
C. Use: lighting, plug loads, occupancy (equipment and
schedules).
D. Context: adjacencies, weather.
Concept stage-early design model: At the building concept stage, an energy model can be developed which reflects the planned geometry, but no design decisions have yet been made about materials, systems, use or context. These models can make use of the ASHRAE recommended materials and occupancy schedules, Ideal Loads and averaged weather for the general location. In this study, this concept stage model is referred to as the Early Design (ED) model.
Code compliance: For regions using ASHRAE 90.1 or some part or variant thereof, using either the Prescriptive or Performance path, compliance is usually demonstrated prior to the granting of building permits. If the designers have opted for the Performance path, a building energy simulation model may be required at an early stage in the design process. The general code compliance calculation procedure for the Performance path includes the comparison between energy performance results coming from two different BEPS models: Proposed Building Design model and Baseline Building model [4].
A. The BEPS modeling procedure for the Proposed Building Design follows these steps:
i. Detailed description of the proposed design including the building envelope, the lighting systems, the HVAC systems, the water heating systems, and other important energy-using systems to provide an estimate of annual energy use for a typical weather year.
ii. Develop the BEPS model for the Proposed Building Design. If some of the values are not known, defaults based on the building type are used.
iii. Simulate the proposed design BEPS model and determine how well the heating and cooling loads are being satisfied, in terms of Un Met Load Hours (UMLH). UMLH consists of the number of hours during a year when the HVAC system is unable to maintain the setpoint temperatures defined for the building.
iv. If the UMLH are less than or equal to 300, then the model and the simulation results may be considered final; if the UMLH are greater than 300 for the year, then the owner needs to modify the proposed building design.
B. Baseline Building BEPS model is created following the rules from ASHRAE 90.1-2016-Appendix G. [2], based on the most up-to-date code available during post-occupancy analysis of the building. The BEPS model has the same floor area, number of floors, and spatial configuration as the Proposed Building Design however, Window-to-Wall Ratio (WWR), materials definition, HVAC systems and components are modified to be in minimum compliance with Standard 90.1- 2016 Performance Rating Method based on building type. The HVAC systems representation in the BEPS model for the Baseline Building depends on the primary building activity (residential or non-residential), the floor area, and the number of stories. Once these building descriptors have been identified, the HVAC system is selected from a table (Table 2 & Table 3), and the selected system has to conform to the descriptions from another table (Table 4); [2].
Table 2:Compliance model implementation stages.
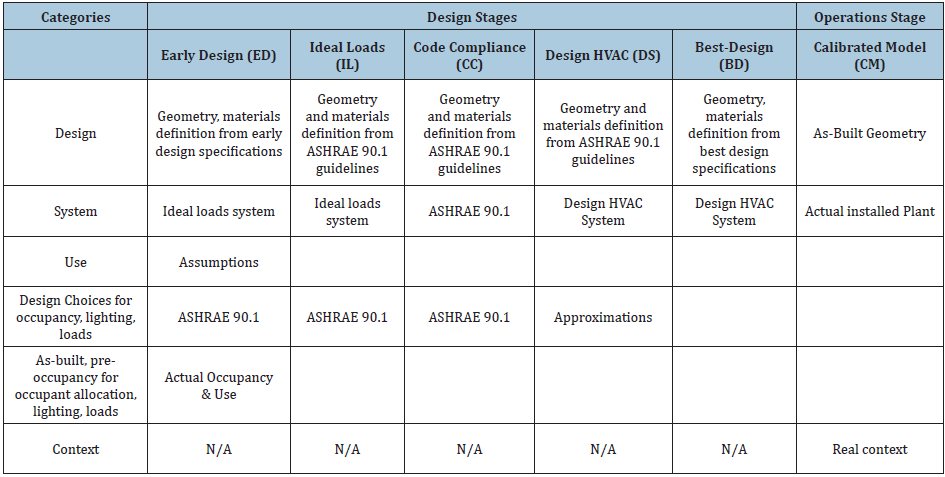
Table 3:Study buildings overview - Pilot P1 and Test T1-T3

Table 4:P1 Building model outcomes comparing five design stage model types over one year.

For many of the HVAC systems in ASHRAE 90.1, each thermal zone is modelled with its own HVAC system. However, a smaller subset of systems requires each floor to be modelled with a separate HVAC system. Besides the HVAC system type, floors with identical thermal zones can be grouped for modelling purposes. This HVAC systems definitions and modelling rule variations can generate a BEPS model representation with different number of HVAC systems serving the proposed design compared to the baseline building. There is no one-to-one relationship between the proposed design and the baseline building for HVAC systems in Baseline Building BEPS model for code compliance verification.
After the two BEPS models have been developed and simulated, the results are used for determination of compliance with ASHRAE 90.1. In order to get a building permit. BEPS model of the Proposed Building Design must match the completed construction documents and needs to be submitted. If the construction results in any significant variation from construction documents the BEPS model must be updated again and still show compliance in order to be granted a certificate of occupancy that allows the building to be occupied. In this study, the Baseline Building is referred as Code Compliance (CC) model. The CC model or Baseline Building represents the annual energy use for a building design intended for use as a baseline for rating above standard design, as defined in ASHRAE 90.1. The achievement of compliance of the final building design is assessed based on the CC model energy predictions.
Post-construction, pre-occupancy-best design: As the building design and construction progresses often over several years, more detailed design decisions become finalized and the four main parameter groupings of Design, System, Use and Context which detail building geometry, materials, HVAC, lighting, loads, occupancy, aspect, location, and shading all become better defined. This would imply that design stage BEPS models are seldom brought to the point at which the most accurate parameters can be applied to the model, prior to building occupation. Had the BEPS model development kept pace with the design decisions as geometry, materials and HVAC were chosen and accurately specified, the model would have become the most accurate possible, prior to occupation. This relatively accurate design stage BEPS model is referred to as the Best Design (BD) model. The logical conclusion of carrying the model forward past the design phase and into the operational phase would be to use actual data from the building, post occupancy. This represents the commonly discussed calibrated model which is not included in this study.
Observed problem: There has been a dearth of discussion about the parametric analysis and accuracy comparison concerning the now common compliance models and their purpose, particularly given the cost of developing them. Models developed for code compliance do not necessarily predict future building energy use and are therefore not particularly suitable for accurate prediction. These energy models may not meet stakeholders’ expectation of an accurate prediction of a building’s future energy consumption, given the major effort required for the implementation. This is due to the function of the code compliance model itself: to determine if a proposed design would use more or less energy (or energy cost) than its reference building baseline design. With a particular emphasis on compliance and the use of ASHRAE 90.1 parametric guidance to prove such compliance, it is important for the practitioners and researchers to understand the likely accuracy of these compliance models, even with the warning offered by ASHRAE about the use of such models.
“Neither the proposed building performance nor the baseline
building performance are predictions of actual energy consumption or costs for the proposed design after construction. Actual
experience will differ from these calculations due to variations
such as occupancy, building operation and maintenance, weather,
energy use not covered by this procedure, changes in energy rates
between design of the building and occupancy, and the precision of
the calculation tool.”
ASHRAE Standard 90.1 2013, Appendix G, Note 2 to G1.2 Given
the important costs of implementing a BEPS model for compliance
purposes [29], the opportunity to use it to predict future building
energy performance would bring a real value for building owners
and developers. However, BEPS models used to demonstrate
compliance, are often discarded once building permits or
permissions have been secured. An important question about BEPS
models arises: why the owner and the design team should develop
a costly energy model which estimates some of the building
characteristics, such as occupancy, just to show compliance and not
be available to accurately assess the design goals and options under
energy efficiency.
Study Objectives
The study has been developed to assess the differences in prediction accuracy between BEPS models developed at the concept stage of the building design phase and the models developed to show compliance with ASHRAE 90.1-2016. In order to validate how useful, the baseline models for code compliance are when used to support forecasting building energy usage postoccupancy, the reference baseline building models (CC model) for compliance are further compared to the Best Design model. The study also examines the parameters used and the influence of those parameters in model accuracy, particularly those parameters and values suggested within 90.1 for compliance purposes. Given an actual building for which various BEPS models have been developed, the following objectives have been identified:
A. Identify four commercial buildings in different climates, each of which has a design stage energy model developed to demonstrate ASHRAE 90.1 compliance. For the building selected as the pilot P1, the ED model has been updated as the construction progressed.
B. Identify the parametric groups and individual inputs needed to facilitate the development of the Early Design model, 90.1 compliance models and the Best Design model.
C. Determine the relative accuracy of each model type. Given that a substantial number of modern commercial buildings in the US could have a BEPS models following ASHRAE 90.1- 2016 to show code compliance, it is important to understand how accurate these models are, relative to what is ultimately possible using accurate building design data post-construction but pre-occupancy.
D. Assess how group parameter changes affect model accuracy when compared with the baseline compliance model. E. Assess the effort required to produce each model type.
Methodology
The methodology used in the study is shown in Figure 1 and can be summarised as follows:
A. Examine and contrast the parameters used for both Early Design (ED) and Best Design (BD) BEPS models for the P1 building.
B. Map the P1 models to the thirteen-group parameter classification (Appendix I).
Figure 1:Methodology Overview -ASHRAE 90.1 building energy models analysis.
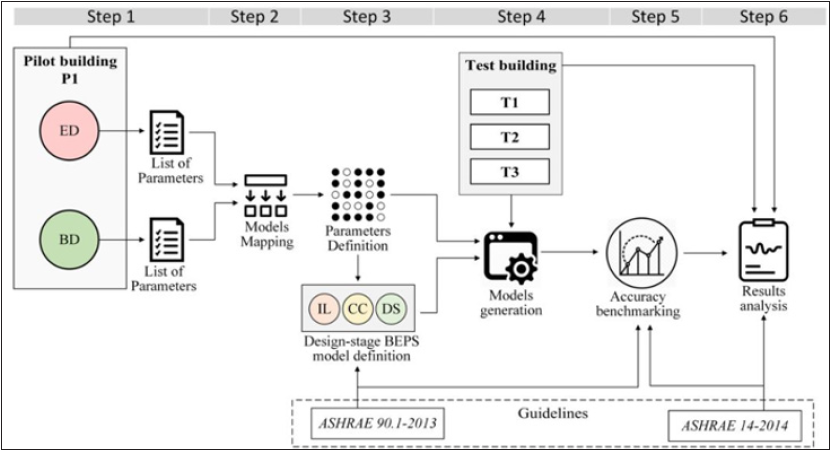
C. Of the thirteen parameter groups, determine which parameters to fix and which to vary in generating the P1 90.1 performance path compliance models.
D. Apply these procedures to all test buildings to generate the five models set out in the objectives.
E. Setting the 90.1 performance path compliance model as the baseline for each of the four buildings, compare forecasting accuracy of all models.
F. Analyse and summarize the results of these model changes for all buildings.
As part of the methodology, the model types to be developed
are shown in Table 2, with three of these models (IL, CC and DS)
designated as typical examples used to prove compliance with
90.1. Maile [33] has discussed the evolution of early stage design
assumptions developing into approximations as design decisions
are taken and the building nears completion. This study has been
undertaken to explore the types of common BEPS models which
are developed during the design phase of a commercial building to
prove compliance, the parametric and data requirements of such
models and their relative accuracy when compared to the actual
energy usage in the occupied building. In order to try to isolate the
important parameter changes affecting accuracy, the geometry and
Context (adjacencies and weather) have been kept constant with
all five models. Geometry forms part of the Design parameters
classification. The parameter groups allowed to vary in going from
model to model are materials, glazing, System (HVAC, infiltration,
ventilation) and Use (occupancy, schedules, plug loads, lighting).
The Early Design (ED) model includes simplified building
geometry and thermal zoning representation, assumptions
for heat transfer coefficients of material surfaces, mechanical
systems defined as an ideal VAV terminal unit with variable supply
temperature, humidity and air flow rate in order to satisfy the
zone heating or cooling load, zone humidity controls and outdoor
air requirements (ideal loads) [34], assumptions for occupancy,
lighting and plug-loads, and fixed building location for context and
statistical weather data. The methodology has been developed to
help determine what parameter changes are required to implement
fully compliant ASHRAE models during design stage BEPS model
development, and to determine what changes in model accuracy
result from those changes.
The methodology also calls for the implementation of the
Best Design (BD) model which includes accurate geometry
representation and thermal zoning definition, HVAC and lighting
systems based on specifications from finalized building design preconstruction,
approximations for occupancy allocation and building
loads profiles This model has been included to assess the difference
in accuracy between CC model (ASHRAE 90.1 Baseline Building
BEPS model) necessary to achieve code compliance with the BD
model which embeds the most accurate parameters available at the
end of the design and construction phases (ASHRAE 90.1 Proposed
Design Building) [4].
Software tools
The following modelling tools were used in this study:
i. Autodesk Revit (2018).
ii. Energy Plus (version 8.6).
iii. Euclid (Open Studio plug-in).
iv. Trimble SketchUp (2017).
v. Open Studio 2.1.0.
Parametric groups exhibiting most influence on model accuracy
Energy Plus requires a substantial number of parameters to be decided for its correct operation [35]. These have been sub-divided into 13 categories or groups for the purpose of this study. Given the existence of an accurate BEPS model (within 10% variation when compared to the actual building’s energy usage) for the chosen pilot building, it was possible to determine the influential groups. The broad range of input parameters required for this study are shown in summary form in Appendix I. They are broken down into the familiar design, system use and context, and further broken down into the thirteen sub-categories as shown. Considering the amount of information available to the BEPS modeler at the start of the design phase, it is easy to imagine the number of assumptions required involving many aspects for the building, simply because firm design decisions have not yet been taken. Both the ASHRAE 90.1-Appendix G suggested parameters and their values, along with the information gleaned from the Best Design BEPS model for the pilot building, guided the parameter selection in Appendix I. The listing of parameters in Appendix I indicates the detailed level of understanding required of the BEPS modeler in the implementation of the actual HVAC system.
Buildings
The four buildings are quite recent in construction dating from 2013/2015 and are summarized in Table 3. The fuel type is almost entirely grid power. Window-to-Wall Ratio (WWR) is comparatively low for all four buildings given they are modern offices at between 25 and 35%. There is large variation in the type and complexity of HVAC utilizing Variable Refrigerant Flow (VRF), Direct Outside Air Systems (DOAS), Variable Water Volume (VWV) and Air-Source Heat Pump Air Conditioning Systems (ASHPAC), along with the more conventional air handling units (AHU) and air chillers. Lighting is all LED with either Occupancy Sensing (OS) or Daylight Sensing (DS), or both. T1 has a local solar hot water system installed while the other three have electrically heated DHW systems.
The U-Values shown for walls, windows and roofs would indicate reasonable high-performance materials, particularly in the glazing for building P1 and T1. All external façade and roof elements would indicate the use of modern and thermally efficient materials. (U-Values have their usual dimensions of W/m2*K). The four office buildings comprise two comparatively fixed Use buildings (P1 and T3) and two of more variable Use (T1 and T2 have been observed to exhibit more variability on plug-loads, occupancy and lighting). The presence of local electricity generation capacity has been ignored for the purposes of these models.
Parametric constraints and identification of the parameters advised by ASHRAE 90.1
In generating the five model types, care was taken to follow the ASHRAE 90.1 parametric guidance offered. The parameters and their classification as applied to the models are listed on Appendix I. In the case of compliance models, the parameter values are specified within 90.1. For consistency, the parameters are grouped according to the 13 classes as identified in section 2 Methodology. On completion of the analysis of the two available P1 models (ED, BD), it was decided to constrain all five models for the four buildings by fixing geometry, adjacencies and weather. Geometry was fixed to the as-built building. Infiltration and ventilation were also fixed as per Section G3.1.1.4 and Section G3.1.2.6 of Standard 90.1 suggested values.
Appendix I outlines the variables which were used for the five model types in each of the four office buildings. Each of the six groups of changing variables, including Materials, Glazing, Whole System HVAC, Lighting, Plug Loads and Occupancy. The data available for the various model types varied across the four buildings. For P1 and T1, the early stage design data was available, but in order to generate the early design models for T2 and T3, the ASHRAE 90.1 suggested parameter values had to be used. This limited the analysis as to the broad accuracy effects of the six parameter groups on the model types. Sufficient data did exist however, to allow an analysis on the effect of the HVAC implementation. This resulted in models being created using Ideal Loads, ASHRAE suggested configurations and values, and finally the actual designed HVAC.
Results of the parametric change iterations to P1
Following the parametric analysis of the Early Design and Best Design models already in existence for the P1 building, the full set of five models were developed based on the fixed and variable parameter groups outlined in Appendix I. The results for P1 are shown in Table 4 which describes the level of variability observed between actual daily energy use data and that daily energy use forecast by the various models including Early Design (ED), Ideal Loads (IL), Code Compliance (CC), Design Stage (DS) and finally Best Design (BD) whose differences in input parameter groups are defined in Table 2.
All models used a consistent weather file over a full year. As expected, the accuracy of the Best Design model is highest given that model contains all known parameters just before occupancy commences and those parameters not known, are approximated. The variation in daily energy usage is down to under 10% when compared to the actual building. The Early Design model utilizes ideal loads for the HVAC load calculations and as such, the overhead in delivering comfort around the building is omitted. Ideal Loads also does not include parameters regarding the efficiency or control of the HVAC systems. Hence the low number for HVAC in the ED model compared to actual HVAC. The inclusion of the delivery overhead (pumps, fans, pipe losses, etc.) would make the ED even more accurate. Contrast that with the Code Compliance model which uses ASHRAE 90.1 recommended HVAC configuration and parameter values. The CC model is the least accurate of all five, exhibiting a 46% variance against the actual daily energy use figures. By all of the statistical measures used in the analysis, the Baseline Building model to verify code compliance is the worst performing for this building. While the CC model may not have been intended by ASHRAE to be accurate to enable its use in energy modeling for new buildings, it would seem to suggest that using the CC model for compliance purposes places a very low bar on passing the ASHRAE regulation (Table 4).
The P1 models were further examined to determine the effects of six parameter groups on the overall model accuracy. Parameter groups within building energy modeling systems are seldom truly independent and to add further complexity, are usually building specific. This implies that any change in a parameter group may affect other groups. For example, if T8 fluorescent tubes are used in an office building, their operation will affect the HVAC load. The occupancy pattern in this building will also affect the running times of the lights, and hence the knock-on effects are obvious. Figure 1 summarizes what has been done to show the broad effects of certain parameter groups changing from early stage building design information through the ASHRAE recommended values (minimum performance values) for building baseline and finally to the most accurate data available post-construction but pre-occupancy.
The Early Design (ED), Code Compliance (CC) and Best Design (BD) models were run with one parameter group changing at a time. The baseline model in this case is the BD or most accurate model (given the data available post-construction but pre-occupancy). The parameter groups were then stepped back from the data used in the BD model to reflect (Figure 2):
Figure 2:P1 Difference in ED and CC model accuracy compared to the BD Baseline model.
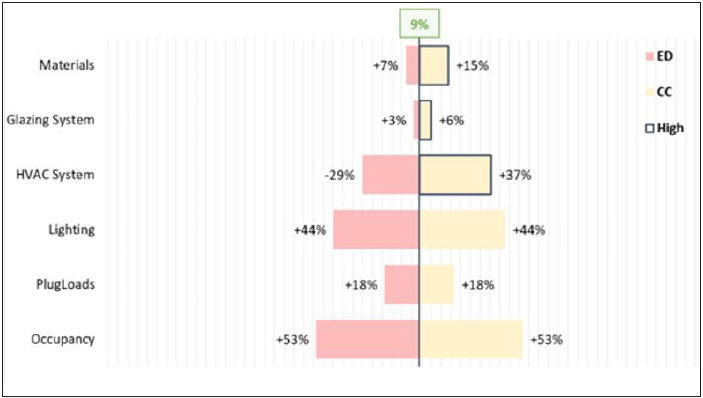
A. ASHRAE 90.1 values for code compliance and
B. Further back for early design parameters for the ED model as per Table 2.
Application of the methodology to the test buildings
The same five models were developed for the test buildings, using the data which would be available to the energy modeler at the various stages of design and construction. Again, the purpose of the segregation of models is to try to isolate the broad effect of adopting the ASHRAE 90.1 parameters in the baseline building model (CC) as recommended in the pursuit of compliance versus the data available to the modeler using either early stage design information and ideal loads for comfort provision or final HVAC, loads and occupancy data from the completed but as yet, unoccupied building. Table 5 summarizes the results for the three test buildings.
Table 5:Test buildings T1-T3 model accuracy comparison with actual energy usage (2015).
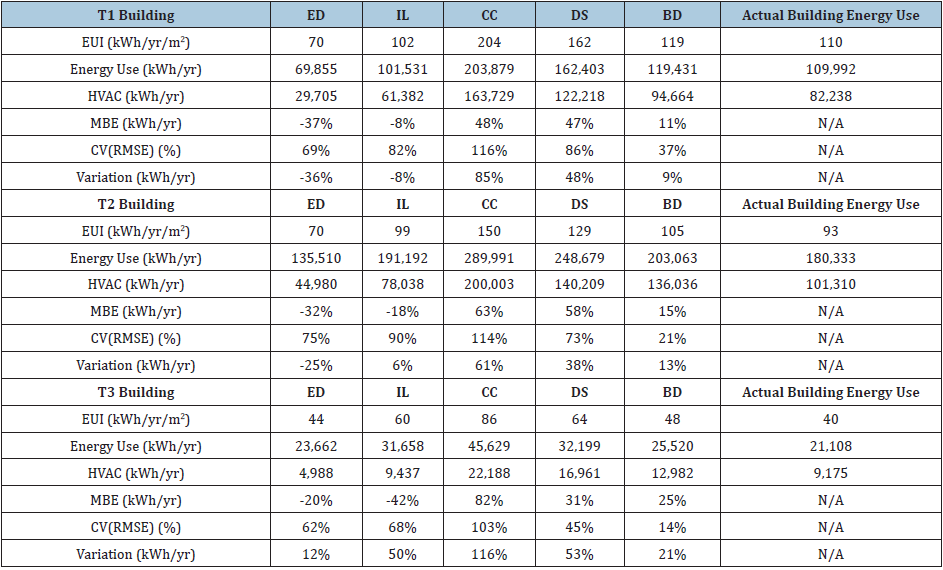
Across the five model types developed for the three test buildings, it is evident that the Best Design (BD) model is the most accurate compared to the actual energy usage in each building. It is also clear that the second most accurate model is the early stage design models using Ideal Loads (IL), even though no allowance has been made for delivery of comfort in the form of pumps, fans and ductwork, and system efficiency and controls. For each test building, the Code Compliance (CC) model highlights the larger difference from the actual building energy consumption postoccupancy given its low accuracy and high variation in assessing building performance. This is more easily viewed in Figure 3.
Figure 3:Variation in accuracy comparing the five models for four buildings with the actual energy usage.
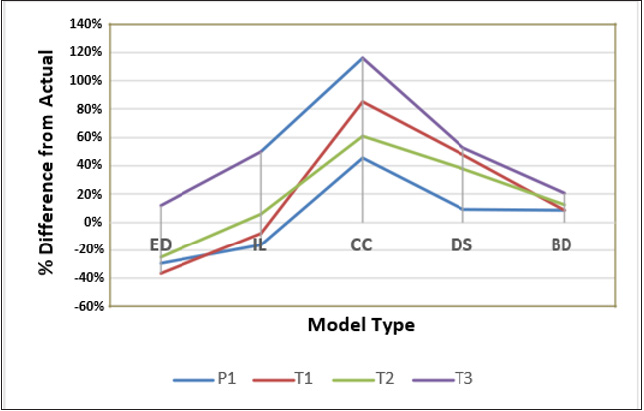
When plotting the variation in model forecasting error when compared to the actual building’s energy usage, the four buildings exhibit similar model accuracy characteristics. The Ideal Loads models show reasonable accuracy in all four cases, using ASHRAE 90.1 materials and Use parameters (lighting, occupancy, plugloads, etc.). Once the ASHRAE 90.1 HVAC option is implemented to verify compliance in the CC mode, the variation jumps significantly in all four buildings. Only on implementation of the actual HVAC system does variation fall off again. The results for T1 are shown in Figure 4, where only the materials, glazing and HVAC could be modelled as Early Design. In the cases of lighting, plug loads and occupancy, the 90.1 recommendations are used in both the ED and CC models.
Figure 4T1:Difference in ED and CC model accuracy compared to the BD Baseline model.
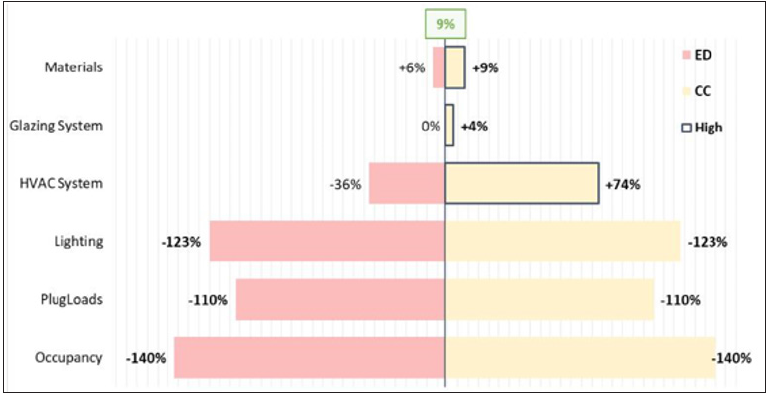
The data available for T2 allowed the variation of materials,
glazing along with the change from Ideal Loads to code compliance
ASHRAE suggested values for the HVAC system. Again, as shown
in Figure 4, the most prominent or influential parameter group is
the HVAC System and the widest variation is observed in the Code
Compliance model. The Ideal Loads model is lower in forecast
energy usage than the actual. As with all four buildings, this can be
somewhat explained in that the delivery of comfort by fans, pumps,
etc., and the inclusion of efficiency and system control shave not
been factored in.
The T2 and T3 buildings did not have sufficient data available
to vary the early stage design model with the materials, glazing, etc.
However, the HVAC system was configured as Ideal Loads in the
Early Design Model and with 90.1 suggested system configuration
and values in the Code Compliance model. As with the other
buildings and beside its inherent limitations, the Ideal Loads model
is significantly more accurate compared to the Code Compliance
model. Figure 5 & Figure 6 show the clear jump in variation due
to the implementation of ASHRAE 90.1 HVAC values and system
selection from the ED to the CC model. Values specified within
ASHRAE 90.1 for parameter groups, such as Lighting, Plug Loads
and Occupancy patterns have been used in the five design models
analyzed for T1 and T2. Both buildings exhibit high variation of
“Use” between building design and building post-occupancy. 123%,
110% and 140% in the case of T1, 86%, 88% and 120% for T2.
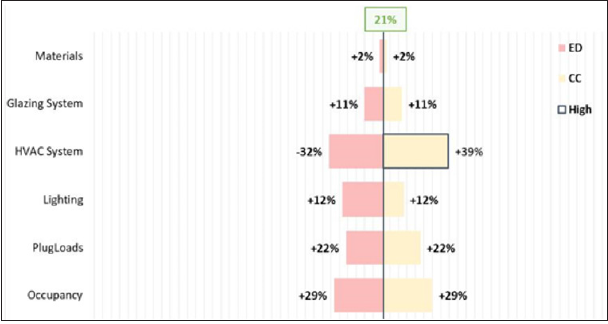
The T3 building instead shows the relatively minor impact of these
parameter groups on the building performance post-construction
but pre-occupancy. Low variability of building Use explains the
reliability of the assumptions made during design. ED and CC
models for T3 report absolute variations for each of Lighting, Plug
Loads and Occupancy, namely +12%, +22% and +29%.
Figure 5T2:Difference in ED and CC model accuracy compared to the BD Baseline model.
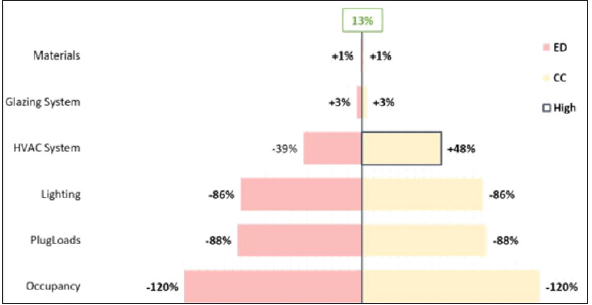
Figure 6T3:Difference in ED and CC model accuracy compared to the BD Baseline model.
Discussion
The accuracy of BEPS model prediction for the four buildings analyzed exhibits an analogous pattern following the implementation of evolving parameters, from early assumptions to approximations. This similarity in BEPS accuracy fluctuations has been highlighted through the adoption of CV(RMSE) and MBE statistics. By collecting data coming from Building Management System (BMS) for actual energy consumption and using results from energy simulation for the prediction of building energy use, CV(RMSE) values for each model and building were calculated. MBE values have been calculated and reported to highlight instances of under or over prediction, given the nature of the statistics. Both statistics have been compiled based on an hourly summation of the 15-minute BMS readings and BEPS results. Figure 7 & Figure 8 summarize the CV(RMSE) and the MBE for all four buildings. The ED model uses data usually available at the concept stage of a new building. For the IL model, ASHRAE recommended guidelines were introduced for thermal zones, materials, lighting, loads and occupancy. A result in this change from ED to IL models is a small reduction in accuracy. Both ED and IL models use Ideal Loads as their System or HVAC implementation, and account has not been taken of the additional loads required (such as pumps, fans, etc.) or for the HVAC system efficiency and controls to deliver that HVAC output to its place of use.
Figure 7:Difference in ED and CC model accuracy compared to the BD Baseline model.
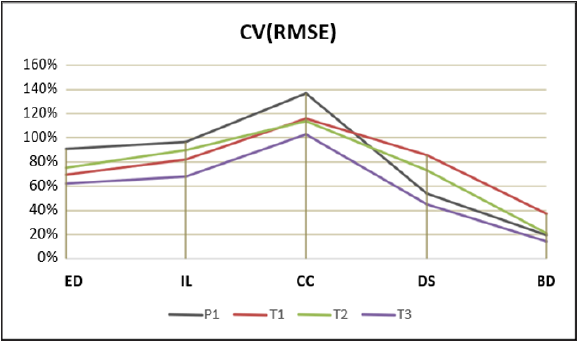
Figure 8:Comparison of MBE results for P1 and T1-T3 Whole Building energy usage.

The introduction of the 90.1 HVAC parameter values to the Code Compliance model caused a substantial increase in error. It is concerning that in all four building models, the CC model is predicting higher energy usage than any of the other model energy forecasts and highlights large variations in the assessed whole building energy performance. This would imply that in achieving ASHRAE 90.1 code compliance, the bar appears to be set very low, at least for these four sample buildings compared to the baseline model developed following ASHRAE 90.1 guidelines and values. The implementation of the actual HVAC system in the BD model increases model forecasting accuracy. Variation improving from 46% to 9% for P1, 85% to 9% for T1, 61% to 13% for T2 and 116% to 21% for T3 is evident. The onward development from the CC to the BD models, required the most effort (Figure 7).
The observed forecasting accuracy and effort required in going from Early Design to Best Design, with the Code Compliance model in between, at least for these four buildings, using standard Energy Plus methods, would suggest that deep understanding is required to implement complex HVAC. That said, the accuracy of the Ideal Loads models ED and IL would seem noteworthy when compared to the code compliance or CC mode. The effort required to implement a full code compliance model requires substantially more time, effort and cost, when the simpler ED or IL model seems better at predicting the actual energy signature and whole building energy use, at least for these four buildings.
Model development effort/cost
The vast majority of design stage BEPS models can be used to prove compliance with some national or international standard. Given the importance of ASHRAE 90.1 as a baseline in most of these models, it is very important to understand the effort required to create these models and the likely return on that investment or value for money. Many studies in the Literature show the wide discrepancy in model accuracy when comparing design stage models to the actual building, post-occupancy. The particular type of design stage model used in the comparison is seldom discussed and therefore the comparison might be prone to misinterpretation. If one of the primary purpose of a design stage BEPS model is to demonstrate compliance, there is little or no incentive for the owner and the design team to advance building architecture and engineering, and to develop the most accurate possible energy model, particularly given the cost and effort involved.
Table 6:Recorded development effort in creating the phased BEPS models for buildings P1 and T1-T3
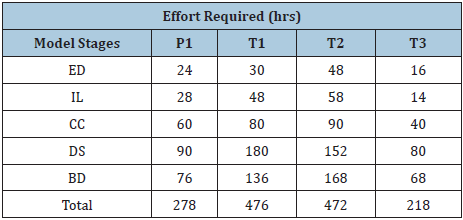
This study has produced 20 BEPS models for four buildings to attempt to represent the various types of compliance models and compare them against the early stage design and the best design model types. The effort involved in this process for the four buildings is outlined in Table 6. Attention is drawn to the obvious standout effort:
A. In the corrections required for T1 and T2 building’s geometry and
B. The implementation of the both 90.1 HVAC assumptions in the CC models and the accurate HVAC implementation in the DS and BD models. Both steps involved in HVAC implementation require detailed knowledge and advanced skills on the part of the modeler.
Figure 9:Effort required with related CV(RMSE) and Variation for each developed buildings P1 and T1-T3 model stages.

It is apparent from summary Figure 9, which shows the effort and the corresponding CV(RMSE) and the Variation for the model of each of the four buildings, that the largest effort is expended in the HVAC interpretation and implementation. T1 and T2 required substantial geometry corrections, while all four buildings exhibit large effort magnitude increases once the 90.1 HVAC or the actual HVAC is adapted into the model. The question arises: given the relative accuracy and the relatively low effort /cost of implementation, why is the Ideal Loads model not considered a reasonable representation of the building’s energy usage, if accuracy is an important performance metric of these models? From the CV(RMSE), Variation and Effort Required data presented in Figure 9, it is clear that reaching the most accurate type of BEPS model, the BD model, requires substantial effort. If the end-goal of the BEPS creation process is accuracy, then end-uses such as Performance Based Contracting may justify the cost of such accuracy. Providing the building design team with the ability to accurately test new advanced features is also a major attraction of the accurate models. However, the relative accuracy of the Ideal Loads models coupled with the low requirement for HVAC implementation may make this type of model a suitable and less effort intensive alternative to the DB model for such purposes. Overall, the Ideal Loads model provides more accuracy resulting in lower implementation cost when compared to a full Code Compliant model implementation. The results also suggest that an Ideal Loads model with the overhead of comfort delivery added, may prove the most accurate when considering the cost of implementation and usefulness in examination of design ideas.
Conclusion
Depending on the parameters used and their accuracy, a number of design stage BEPS models were developed. This study examines the accuracy and development effort involved in the creation of BEPS models at various design stage and how these models compare to the model developed to demonstrate code compliance.
Purpose and compliance
Given the cost and effort required to create a BEPS model for a modern commercial building, with all of its complex geometry, materials and HVAC, it makes sense that the majority of these models are created for one main purpose-demonstration of compliance. The early stage models are also used at times to allow the design team to try new geometries or materials to see the effect of such changes. Following the development of a compliance model, there appears to be no incentive to keep that model up to date with the evolving features of a building through the final construction and post-occupancy phases. This seems a wasted effort, given the time and cost involved in the creating the model to achieve compliance in the first place.
While the code compliance model may not have been intended by ASHRAE to be sufficiently accurate to enable its use in energy forecasting for new buildings, the analyses here presented suggest that using the CC model for compliance purposes places a very low bar on passing the ASHRAE regulation, at least for the buildings in this study. If the code compliance model is not intended for use in building energy forecasting, the requirement for a model to be created to demonstrate compliance on the Performance Path, seems to place a very costly and time-consuming burden on the building developer and the design team.Model accuracy
The step in going from the Ideal Loads (IL) model to the Code Compliance (CC) model is the largest in terms of effort, understanding and knowledge on the part of the modeler. HVAC, in particular, can be interpreted in many ways given how most modeling systems facilitate the description of such systems. This is also true for Energy Plus. This step in bringing the BEPS model one step closer to describing the reality of a building is the most substantial in terms of effort and cost as is evident from Figure 8 for these four buildings. This probably represents an obstacle to most design teams given they already have proven compliance and are not in any way encouraged to bring the modeling process to its most accurate point, especially after design completion or during post-occupancy.
Use of the ideal loads model
Examination of the five model’s relative accuracy across the four buildings would suggest that the complex steps involved in the interpretation and implementation of the code compliance ASHRAE HVAC guidance might not be necessary if code compliance is the end goal of the modeler’s efforts. The addition of the planned loads in pumps, fans and pipework/ductwork losses in addition to the Ideal Loads figures, may prove sufficiently accurate to both forecast actual energy use (post-occupancy) with an acceptable error and show code compliance with substantially less effort and cost.
Future Work
Given the study outcomes in highlighting the amount of effort and cost in developing best design BEPS models, it is planned to explore semi-automated methods to reduce the time, cost and effort required to produce accurate geometry for existing building’s BEPS models and their application in fields such as Performance Based Contracting and post-occupancy building performance optimization.
References
- Kirkwood RR (2010) ASHRAE takes on energy standard: The genesis of Standard 90. ASHRAE Journal 52(6): 34-39.
- American Society of Heating (2016) Refrigerating and Air-Conditioning Engineers, Inc., Ashrae standard 90.1. Atlanta, Georgia.
- Hydeman M (2006) A tale of two codes: Title 24 and standard 90.1. Ashrae Journal 48(4): 46-55.
- Goel S, Rosenberg M, Eley C, (2017) ANSI/ASHRAE/IES Standard 90.1-2016 Performance Rating Method Reference Manual. Pacific Northwest National Laboratories, United States.
- LEED (2017) v4 for Building Design and Construction.
- (2015) AIA 2030 Commitment Progress Report, AIA, Washington, USA.
- Tupper K, Franconi E, Chan C, Fluhrer C, Jenkins M, et al. (2019) Pre-read for BEM innovation summit. Rocky Mountain Institute, USA.
- Shiel P, Tarantino S, Fischer M (2018) Parametric analysis of design stage building energy performance simulation models. Energy and Buildings 172: 78-93.
- Norford LK (1994) Two-to-one discrepancy between measured and predicted performance of a ‘low-energy’ office building: Insights from a reconciliation based on the DOE-2 model. Energy Build. 21(2): 121-131.
- Reddy TA (2006) Literature review on calibration of building energy simulation programs: uses, problems, procedures, uncertainty, and tools. ASHRAE Trans, Chicago, USA, 112(1): 226-240.
- Menezes AC, Cripps A, Bouchlaghem D, Buswell R (2012) Predicted vs. actual energy performance of non-domestic buildings: Using post-occupancy evaluation data to reduce the performance gap. Applied Energy 97: 355-364.
- Carbon Trust (2011) Closing the gap-lessons learned on realising the potential of low carbon building design. Carbon Trust, London, UK.
- Dwyer T (2013) Knowledge is power: Benchmarking and prediction of building energy consumption. Building Services Engineering Research and Technology 34(1): 5-7.
- Coakley D, Raftery P, Keane M (2014) A review of methods to match building energy simulation models to measured data. Renewable and Sustainable Energy Reviews 37: 123-141.
- Mottillo M, Levermore G (2001) Sensitivity analysis of energy simulation by building type. ASHRAE Transactions 107(2): 722-732.
- Ourghi R, Al-Anzi A, Krarti M (2007) A simplified analysis method to predict the impact of shape on annual energy use for Office buildings. Energy Conversion and Management 48(1): 300-305.
- Lombard LP, Ortiz J, Pout C (2008) A review on buildings energy consumption information. Energy and Buildings 40(3): 394-398.
- Jentsch MF, Bahaj AS, James PAB (2008) Climate change future proofing of buildings-generation and assessment of building simulation weather files. Energy and Buildings 40(12): 2148-2168.
- Bazjanac V (2010) Space boundary requirements for modeling of building geometry for energy and other performance simulations. 27th International conference of CIB W78, Cairo, Egypt.
- Fokaides PA, Maxoulis CN, Panayiotou GP, Neophytou MA, Kalogirou SA (2011) Comparison between measured and calculated energy performance for dwellings in a summer dominant environment. Energy and Buildings 43(11): 3099- 3105.
- Zhang T, Siebers PO, Aickelin U (2011) Modeling electricity consumption in office buildings: An agent-based approach. Energy and Buildings 43(10): 2882-2892.
- Molin A, Rohdin P, Moshfegh B (2011) Investigation of energy performance of newly built low-energy buildings in Sweden. Energy and Buildings 43(10): 2822-2831.
- Heller J, Morgan H, Frankel M (2011) Sensitivity analysis: Comparing the impact of design, operation, and tenant behavior on building energy performance. Report of the New Building Institute, USA.
- Ryan E, Sanquist T (2012) Validation of building energy modeling tools under idealized and realistic conditions. Energy and Buildings 47: 375-382.
- Zhao HX, Magoules F (2011) New parallel support vector regression for predicting building energy consumption. IEEE Symposium on Computational Intelligence in Multicriteria Decision-Making (MCDM), Paris, France, pp.14-21.
- Wilde PD (2014) The gap between predicted and measured energy performance of buildings: A framework for investigation. Automation in Construction 41: 40-49.
- Jones R, Fuertes A, Wilde PD (2015) The gap between simulated and measured energy performance: A case study across six identical new-build flats in the UK, 14th Conference of International Building Performance Simulation Association, Hyderabad, India, pp. 7-9.
- Anderson JE, Wulfhorst G, Lang W (2015) Energy analysis of the built environment-A review and outlook. Renewable and Sustainable Energy Reviews 44: 149-158.
- Shiel P, West R (2016) Effects of building energy optimisation on the predictive accuracy of external temperature in forecasting models. Journal of Building Engineering 7: 281-291.
- Orca SD, Hong T, Langevin J (2018) The human dimensions of energy use in buildings: A review. Renewable and Sustainable Energy Reviews 81: 731-742.
- Yoshino H, Hong T, Nord N (2017) IEA EBC annex 53: Total energy use in buildings-Analysis and evaluation methods. Energy and Buildings 152: 124-136.
- Griffin T, Crutchfield D (2012) Understanding building energy models: Speaking your customer’s language. International District Energy Association, Fourth quarter, pp. 21-26.
- Maile T, Bazjanac V, Fischer M (2012) A method to compare simulated and measured data to assess building energy performance. Build and Env 56: 241-251.
- Neill ZO, Eisenhower B (2013) Leveraging the analysis of parametric uncertainty for building energy model calibration. Build Simul 6(4): 365-377.
- Energy Plus Documentation (2016) Input Output Reference Version 8.6.
© 2020 Sergio Tarantino. This is an open access article distributed under the terms of the Creative Commons Attribution License , which permits unrestricted use, distribution, and build upon your work non-commercially.
 a Creative Commons Attribution 4.0 International License. Based on a work at www.crimsonpublishers.com.
Best viewed in


.jpg)


 Editorial Board Registrations
 Submit your Article
 Refer a Friend
 Advertise With Us
.jpg)


.jpg)


.bmp)
.jpg)
.png)
.jpg)


.jpg)


.png)

.png)


.png)


