
- About Us
- Information
-

The Author ensures that the research has been conducted responsibly and ethically with adherence to all relevant regulations. read more..
- For Authors
- For Reviewer
- Manuscript Guidelines
- Membership
- Publication Ethics
-
- Journals
- Reprints
- e-Books
- Videos
- Policies
- Contact Us
 COVID-19
- Submissions


Full Text
Advancements in Civil Engineering & Technology
Numerical Analysis of Road Pavement Response
Omer JR* and Ben Eghan A
Kingston University, UK
*Corresponding author: Omer JR, Kingston University, London, UK
Submission: May 23, 2018;Published: August 24, 2018

ISSN: 2639-0574 Volume2 Issue2
Abstract
Nowadays powerful computer programs are available which can implement sophisticated mathematical models to analyze the response of a pavement structure under traffic loading. This paper describes a collection of test data from real pavements and analyses them using various numerical and analytical models to predict pavement deflections and compare against field measurements. A commercial program “KENLAYER”, which is based on multi-layer elastic systems, was used to predict pavement deflections for comparison with measurements from Falling Weight Deflectometer (FWD) methods. Six pavement sections were modelled with KENLAYER under various wheel load repetitions. For single loads, KENLAYER deflection predictions matched FWD values at pints of load application and at 60 inches away. Discrepancies in KENLAYER predictions were judged to arise from the inability of the program to model the interaction between base and subbase layers. Comparisons with Burmister’s solutions showed both FWD and KENLAYER predictions were up to 20% higher than those obtained from analytical equations. Using back-calculated material parameters, it was found that a multi-layer theory-based program “EVERCALC” produced the most accurate deflection predictions.
Keywords:Pavements; Dynamic loading; Finite element methods; Back-analysis; Numerical modelling
Introduction
The road pavement design process has in recent years, developed from a purely empirical approach, to more sophisticated methods requiring a detailed knowledge of the behaviour of materials and their changing characteristics under external loads [1]. Deflections serve as an early indication of potential deterioration that leads to structural defects in a pavement system. Never the less deflections alone may not account for eventual failure, but initiate deformation in combination with the accumulation of unrecoverable strains that develop when surfaces are subjected to traffic loads [2]. Excessive tensile strains at the bottom of an asphalt surfacing layer, as well as the compressive strains on the subgrade account for fatigue cracking and rutting of surfaces, which are the main failure modes in flexible pavements. The magnitude of these responses depends among other things, on the magnitude of loading, some environmental factors and individual layer properties [3]. Currently, deflection measurements are a reliable source of data that help assess the structural integrity and variability of highway pavements [4]. Close monitoring of pavement surface deflections during routine maintenance is a plausible way to delay, and possibly avoid the cost- intensive processes of reconstruction by early introduction of overlay designs.
The newly evolved mechanistic-empirical design process investigates the relationship between physical effects (wheel loading, material properties) and responses (stress, strains, deflections) and develops mathematical models to relate the physical effects to a failure mode [5]. The tendency of over-reliance on these computer programs capable of predicting pavement responses has increased since their introduction and application in highway and materials engineering. There is need to test these programs with existing classical analytical equations and field measurements to determine the level of accuracy of predicted results. The study investigates the accuracy of KENLAYER, a program based on the elastic layer analysis which model’s pavement responses given some loading and layer properties. Results are compared with field measurements obtained using the FWD, as well those calculated with analytical equations as proposed by Boussinesq [6] & Burmister [7].
Design Concepts and Structural Models
The main structural response models used in pavement analysis are the finite element and layered elastic analysis. The KENLAYER program is a software package that relies on mathematical models to predict road pavement structural responses by using the layered elastic theory. This theory is based on Burmister’s [7] equations for the solution of stresses, strains and deflections in layered systems under external loads. Using input parameters such as material properties, loading and layer thicknesses, predictions of surface deflections can be made and compared with field values. The layered elastic theory incorporates certain generalisations and assumptions including material isotropy and homogeneity. A result of these assumptions is manifest as differences between predicted structural responses of finite element programs such as MICH-PAVE and the KENLAYER program. In finite element analysis, materials are viewed as discrete bodies subjected to stresses and strains with some non-linear properties [8].
Deflections on the pavement surface are more practical to measure and are not considered a critical failure mode, although they may be used as a pavement design criterion [3]. Excessive tensile strains at the bottom of the asphalt surface layer, as well as the compressive strains on the subgrade account for fatigue cracking and rutting of surfaces, which are the main failure modes in flexible pavements. A subsequent study by Evdorides et al. [9] mention cracking as a principal distress occurrence, which results from continual surface loading or environmental factors. The deflected vertical distance, , of the of the pavement surface measured under static or dynamic loading, together with multiple radial deflection measurements forms the deflection basin. Generally, values are highest along the centre of the applied load, decreasing in magnitude the farther a measurement is taken away from the point of application of the load.
The FWD is the most commonly used method of determining field deflection values without affecting the structural integrity of the pavement structure. This non-destructive method also offers the opportunity to use field deflection data in the estimation of the elastic modulus of the material layers in a pavement. The FWD is able to simulate the effect of axle loading of a vehicle by producing a similar load intensity and duration [10]. Furthermore, the effect of vehicle speed is well accounted for by the FWD, although there is only an instantaneous drop load duration. Higher surface deflections are recorded at lower vehicle speeds. This inverse proportionality of surface deflection and vehicle speeds up to 15mph was also established from the WASHO field test in the United States [3]. To obtain results similar to that caused by moving vehicles, the FWD should have load levels in the region of 9000 lb (40kN) which is the design load used in field testing. The elastic modulus and Poisson’s ratio are two important material properties that affect deflection values with the former being considered as the most critical. Differences in measured and predicted deflection values occur when back-calculated or laboratory-obtained results of elastic modulus are used in the computation of surface deflections.
In an attempt to further understand the sources of differences between measured field data and predicted performance, Stoffels 2008 used a three-dimensional finite element analysis (3D FEA) and FWD data to evaluate pavement responses. The main strength properties of the Asphalt Concrete (AC) layer, the modulus, were back-calculated from the measured deflection basin obtained from FWD readings and on the assumption that the bituminous layer performed as a fully linear elastic material. Laboratory derived modulus values were adjusted for temperature and load duration. For the bituminous surface layers, the laboratory modulus values were consistently lower than those derived through backcalculation, usually about 70% of the back-calculated values. Conversely, the laboratory modulus values for the intermediate bituminous base layers were about 10% higher than the backcalculated values. Both sets of data were used to predict pavement responses (stresses, strains and deflections) with a 3D FE model and subsequently compared to measured field data. Results showed variations in measured and predicted deflections depending on the whether back-calculated or laboratory-derived moduli were used. On average, prediction errors for surface deflections using back-calculated and laboratory-derived moduli were 9% and 12% respectively.
Methodology of Analysis
In the context of this research, pavement deflections were considered as the main structural responses and were used in the comparison of different methods of surface deflection evaluation. Deflection data sourced from case studies formed the basis of assessment of the level of accuracy between field measurements and software-derived values. A third method of evaluation, using theoretical equations for the solution of surface deflections was also used in the comparison. The FWD device first developed in France to overcome the limitations of the Benkelman beam, works on the principle of the propagation of a response in the form of recoverable deformations in pavement layers on the application of a load [11]. The device is made up of a 300mm diameter steel plate through which a known load is applied [12]. Sensors fixed at radial distances from the loading plate record vertical deflections as a result of applied loads. The plot of the distances and recorded deflection forms the deflection basin of the pavement structure at that location. An analysis of the deflection basins gives an indication of the structural integrity of underlying pavement layers, as well as help in the determination of the elastic moduli of the material. Generally, higher deflection values are recorded at sensors closer to the loading plate with a gradual reduction observed farther away from the loading plate. Steep curves are indicative of weaker flexible pavements whereas shallower curves are associated with stiffer underlying layers [13].
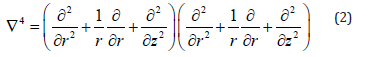
The KENLAYER program was developed at the University of Kentucky, USA and is comes packaged together with the second edition of the book “Pavement Analysis and Design” written by Huang [3]. The software, together with its data input interface LAYERINP and graphic program LGRAPH form part of the software suite KENPAVE. It also includes KENSLABS a similar program used for the analysis of rigid pavements. The program can analyze pavements consisting of up to 19 layers and provide outputs (stresses, strains, deflections) at 10 different radial coordinates or 19 different vertical coordinates. Account is also taken of tandem and tridem wheel configuration by using superposition and an x and y coordinate system of referencing [3]. A generalization of the layered systems as incorporated in the KENLAYER program for the solution of stresses, strains and deflections is based on a fourth order differential equation:
∇4φ = 0 (1)
where
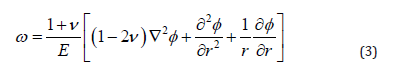
Although several equations have been developed for the resolution of strains and stresses, emphasis will be placed on those relating to deflections caused by a rigid plate as in the case of the FWD. Boussinesq [6] introduced a structural response model from which a set of equations was developed for calculating the stresses and strains in a homogenous mass due to loads applied at the surface or at depth. With these equations, stresses, strains and deflections may be calculated given certain material and loading parameters. At the time, this simple generalization was considered to be the most accurate way of representing a loaded pavement characterized by an elastic half-space.
It is known that road pavements are made up of layers of varying thicknesses and properties rather than a homogenous mass as represented in Boussinesq’s [6] generalization. To adapt Boussinesq’s [6] equations for pavement response calculation to the layered nature of road pavements, Burmister [7] developed equations for the solution of a flexible two-layer system. The strength parameters of the materials were an integral part of the magnitude of generated responses. In Burmister [7] two-layer theory, the stresses and deflections were dependent on the ratio of the elastic modulus of the two layers and height to area ratio of the contact surface [7]. Material properties used in these models were sub dived into three aspects; the stress-strain relationship, ability to recover strain after stress is removed and the temperature dependency of strain. Based on this, pavement materials can be labelled as linear or nonlinear, elastic or plastic, viscous or no viscous [2]. Only linear elastic characteristics of the pavement will be considered as part of this study. For the application of loads using rigid plates as in the case of the FWD;
For two-layer systems, vertical stress is determined by the ratio of / and thickness-radius ratio /a. The surface deflections are however determined in terms of a deflection factor . The graph in Figure 1 shows the deflection factor on the y-axis determined by matching the /a ratio (x-axis) to the curve corresponding to the / ratio. The complexity of multi-layered systems however led to the development of computer programs for the analysis of flexible pavements. Currently, the layered elastic theory forms the basis for most structural response programs [14].
figure 1:Vertical deflections for two-layer systems [7].

Result of Computer Analyses
To assess the accuracy of KENLAYER, various combinations of pavement layers were analysed using EVERCALC 5.0 and the backcalculated moduli obtained as shown in Table 1. The results in Table 1 show that the prediction of surface deflection by the KENLAYER program is dependent on a variety of factors, among which is the elastic modulus and its mode of generation. The compatibility of the KENLAYER program with some back-calculation programs shows that results correspond well with EVERCALC, which is also based on linear elastic analysis. Differences occurred especially from the 2nd to the 6th sensors in most cases. In Table 1 deflection values matched more closely directly under the loading plate (sensor 1), and at the outermost sensor (sensor 7) (Table 2). The MODULUS back-calculation program combined with a single load application produced curves similar to those for linear relationships with a consistent difference in KENLAYER and FWD deflection values. Comparison with analytical equations using deflection charts also showed a better agreement with KENLAYER deflection values directly under the loading plate. The best set of results were obtained with the repeated application of loads in the region of 6000 lb, 9000lb and 12000lb and modulus values back-calculated from EVERCALC (Table 3). In most cases, KENLAYER values were higher than those derived through the FWD field testing [15].
Table 1:Back-calculated moduli from EVERCALC 5.0.

Table 2:KENLAYER predictions for a 5-layer perpetual pavement system (Section 1).

Table 3:KENLAYER predictions for a 4-layer system, with E-values back-analyzed using from MODULUS program (Section 2 referred to).

Pavement section 1 for analysis
The pavement section (Figure 2) consisted of 1.5-inches of a 12.5mm stone mastic asphalt surface course, a 1.75-inch 19mm SUPERPAVE intermediate section, a 9-inch large stone mix asphalt base, a 4-inch large stone mix of fatigue resistant layer and a 6-inch densely graded aggregate base with under-drain. The FWD data taken at various locations on US Route 30 was used as the control conditions for this study. Using increasing load levels of approximately 6000lb (27kN), 9000lb (40kN) and 12000lb (54kN) at each test site, the vertical surface deflections were recorded using the FWD. A series of seven sensors were used positioned at 0, 8-inches, 12-inches, 18-inches, 24-inches, 36-inches and 60-inches from the line of action of the loading plate. A Poisson’s ratio of 0.35 was assumed for all the layers and a value of 0.4 assigned to the subgrade. The computed results are illustrated in Table 2. A good agreement is observed between both the FWD deflection readings and the KENLAYER values. Typical of deflection basins, highest values were recorded along the axis of symmetry of the drop load with a gradual reduction depicted by the lower values recorded by the outer sensors. Although the two results correspond well, the FWD readings are slightly higher than those predicted by KENLAYER. Between the second and last sensors however, the KENLAYER deflection values are observed to be higher.
figure 2:Pavement section 1 for present analysis.

Pavement section 2 for analysis
A single load application of approximately, 11000lb (50KN) was applied along various points on a 4-layer system. The pavement was made up of a 4.2-inch asphalt surface course, 8.4- inch base course and a 12-inch granular subbase (Figure 3). Table 3 shows the deflection basins produced for both the FWD and KENLAYER methods. The results reveal a general decrease with increasing distance from the center of the applied load. However, the shape of the deflection basins are steep almost similar to curves characteristic of linear relationships. Deflection values for both the FWD and KENLAYER although still consistently linear, increase with lighter load levels (Table 4).
figure 3:Pavement section 2 for present analysis.

Table 4:KENLAYER prediction accuracy in a 4-layer system with granular subbase (Section 3).

Pavement sections 3 & 4
Single load drops were also applied to 4-layer and 3-layer systems (Figure 4 & 5) to check for consistency of surface deflection values. Section 3 was made of a 5-inch thick asphalt concrete surface course, 8-inch crushed limestone base and an 8-inch cement stabilized subbase over a clay subgrade. Section 4 was made up of a similar composition, without the cement-stabilized subbase material. The subgrade in this case was a sandy clay material. A load level of approximately 9000lb was used in both instances and a Poisson’s ratio of 0.35, 0.4 and 0.45 was used for the respective layers. As seen in Figure 4 & 5, deflection values from the FWD and KENLAYER correspond well at the 1st and 7th sensors under both load levels. There is however less agreement of surface deflection values in-between the 1st and the last sensors in both cases Figure 4 & 5 show that the differences in deflection values between sensors 2 and 6 are much closer in the 4-layer system than under the 3-layer system although the deflection values predicted by KENLAYER are consistently higher for both load levels (Table 5).
figure 4:Pavement section 3 analysed.

figure 5:Pavement section 4 analysed

Table 5:KENLAYER prediction accuracy in a 3-layer system (Section 4).

Pavement section 5
The test site was in Texas, United States, along State Highway 152 in District 25. The pavement being a 3-layer system had a 1-inch hot mix asphalt surface, 16-inch crushed limestone base over a sandy gravel subgrade. A Poisson’s ratio of 0.35, 0.40 and 0.45 were assumed for the surface, base and subgrade layers respectively. For a thin surface course, the shape of the deflection basins is similar to that for a 4-layer and 3-layer system. The load levels used were approximately 8000lb. The computed results presented in Table 6 show that the FWD curves appear much steeper than that of the KENLAYER owing to the significant difference in deflection values between the first and second sensors (within 10 inches of the loading plate). FWD values are also observed to be higher than KENLAYER at sensor 0.
Table 6:KENLAYER prediction for a 2-layer system with a thin wearing course (section 5).

Correlation between FWD and KENLAYER derived parameters
figure 6:Pavement section 5 analysed.

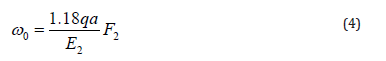
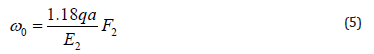
An approximation of the vertical surface deflection was undertaken using analytical equations to determine any correlation with FWD and KENLAYER-derived values for pavement section 5. Due to the relative thickness of the surface layer in comparison with the base layer, the former was removed from the analysis. This resulted in the analysis of a 2-layer system comprising of a 16-inch base material over a sandy gravel subgrade as shown in (Figure 6&7). In order to determine the vertical surface deflection, Burmister’s deflection curves for two layer systems were used to determine the deflection factor F2 and incorporated into equation (4). Both sets of values were observed to be higher than results calculated with Burmister’s equation by up to 20%.
figure 7:A 2-layer system for correlating parameters from FWD and KENLAYER.

Conclusion
From the case studies analyzed, the following are the conclusions may be drawn:
a) In order to accurately replicate FWD field results, KENLAYER requires the application of three load levels of increasing intensity. Ideally, this should be of a magnitude above, below and including the 9000 lb (40 kN) design load. In the evaluation carried out as part of this study, loads levels of approximately 6000 lb, 9000 lb and 12000 lb when applied to the pavement were observed to provide the best fit for FWD and KENLAYER- derived deflection basins.
b) EVERCALC was found to produce modulus values that closely matched FWD deflection basins when input into KENLAYER. EVERCALC is suggested to be the most compatible back-calculation program with KENLAYER, although both programs are based on the assumptions of the linear elastic theory.
c) For single load applications, KENLAYER shows good correlation with FWD deflections directly under the loading plate (sensor 1) and at the outermost sensor (sensor 7) although some marginal differences were observed. Significant differences were however observed between 12 and 18 inches (sensors 3 and 4) from the base of the loading plate. Predicted deflection values by KENLAYER are consistently higher than FWD values by up to 20-80%, between 8 and 36 inches from the loading plate.
A pavement section with a thin wearing course was transformed to a two-layer system for analysis with Burmister’s [7] deflection equations. An evaluation of deflection values directly under the load plate for varying load levels showed the FWD and KENLAYER values to be between 11-21% higher than values calculated using the deflection equations. However, KENLAYER values correspond somewhat better with values being between 12-18% higher than calculated results.
References
- Ekwulo EO, Eme DB (2009) Fatigue and rutting strain analysis of flexible pavements designed using CBR methods. African Journal of Environmental Science and Technology 3(12): 412-421.
- Yoder EJ, Witczak MW (1975) Principles of pavement design. (2nd edn) John Wiley and Sons, New York, USA.
- Huang, Yang H (2004) Pavement analysis and design. (2nd edn), Prentice Hall, New Jersey, USA.
- Applied Pavement Technology Inc (2010) Using Falling Weight Deflectometer with Mechanistic-Empirical Design and Analysis’, Final Report. Federal Highway Administration, New jersey, Washington DC, USA.
- Mathew TV, Rao KVK (2007) Introduction to transportation engineering. NPTEL Web Course, pp. 1-8.
- Boussinesq M J (1885) Application des potentiels a l’etude de l’equilibre et du movement des solides elastiques, principalement au calcul des deformations et des pressions que produisent, dans ces solides, des efforts quelconques exerces sur une petite partie de leur surface ou de leur interieur: Memoire suivi de notes etendues sur divers points de physique mathematique et d’analyse. Gauthier Villars, Paris, 1: 721.
- Burmister DM (1945) The general theory of stresses and displacement in layered soil systems. Journal of Applied Physics 16(2): 89.
- Akbulut H, Aslantas K (2004) Finite element analysis of stress distribution on bituminous pavement and failure mechanism. Materials and Design 26(4): 383-387.
- Evdorides HT, Snaith MS, Anyala M (2006) An analytical study of road pavement fatigue: Proceedings of the institution of civil engineers. Paper 12370: 93-100.
- Ullidtz P, Stubstad RN (1985) Analytical-empirical pavement evaluation using the falling weight deflectometer. Transportation Research Record 1022, TRB, Washington DC, USA.
- COST 336 (2005) Use of falling weight deflectometers in pavement evaluation. European Cooperation in the Field of Scientific and Technical Research.
- PCS/Law Engineering and Braun Intertec Pavement, Inc (1993) Manual for FWD testing in the long-tern pavement performance program. Strategic Highway Research Program, National Research Council, Washington DC, USA, pp. 1-175.
- Tutumluer E, Pekcan O, Ghaboussi J (2009) Nondestructive pavement evaluated using finite element analysis based soft computing models. USDOT Region V Regional University Transportation Center Final Report.
- Hveem FN (1955) Pavement deflections and fatigue failures. Highway Research Board Bulletin 114, Highway Research Board, Washington, DC, USA.
- Asphalt Institute (1982) Research and development of asphalt institute’s thickness design manual. (9th edn), Research Report, pp. 82-92.
© 2018 Omer JR. This is an open access article distributed under the terms of the Creative Commons Attribution License , which permits unrestricted use, distribution, and build upon your work non-commercially.
Editor In Chief


.jpg)


Signup for Newsletter

Quick Links
 Editorial Board Registrations
 Submit your Article
 Refer a Friend
 Advertise With Us
Our Recent Edition

.jpg)


Top Editors


.jpg)


.bmp)
.jpg)
.png)
.jpg)


.jpg)


.png)

.png)


.png)


Financial Support

Sponsors

Latest e-Books

Latest Video

 a Creative Commons Attribution 4.0 International License. Based on a work at www.crimsonpublishers.com.
Best viewed in
a Creative Commons Attribution 4.0 International License. Based on a work at www.crimsonpublishers.com.
Best viewed in