
- About Us
- Information
-

The Author ensures that the research has been conducted responsibly and ethically with adherence to all relevant regulations. read more..
- For Authors
- For Reviewer
- Manuscript Guidelines
- Membership
- Publication Ethics
-
- Journals
- Reprints
- e-Books
- Videos
- Policies
- Contact Us
 COVID-19
- Submissions


Full Text
Advancements in Civil Engineering & Technology
Experimental Calculation of the Damping Ratio In Buildings Hosting Permanent GPS Stations During the Recent Italian Earthquakes
Marco Gatti*
Department of Engineering, Italy
*Corresponding author: Marco Gatti, Department of Engineering, via Saragat 44123 Ferrara, Italy
Submission: May 19, 2018;Published: June 21, 2018

ISSN: 2639-0574 Volume1 Issue3
Abstract
During the recent earthquakes in Italy, the contemporary presence of about 40 permanent GPS and 40 accelerometric stations of the national seismic network made it possible to estimate the value of the damping ratio of the buildings hosting the GPS stations. This value was calculated as the minimum of a function (parabola) constructed step by step from the relations between the ordinates of the pseudo-acceleration spectra extracted from the GPS and accelerometric measurements. For both construction material and building geometry, the results indicate values that differ by at least two percentage points from the values imposed by the technical regulations.
Keywords:Damping ratio; GPS; Earthquakes emilia 2012; Central Italy 2016; Ischia 2017
Introduction
On the indication of the European standards [1], the Italian technical regulations on buildings [2] set the damping ratio (or damping factor) ζ at 0.05 (5%). However, this value appears to be restrictive as it is influenced by many factors such as the mass, stiffness, oscillation amplitude, geometry, construction material, ground geology, etc.; a minimum percentage deviation produces significant variations in the ordinates of the seismic response spectra and in the structural factors. Therefore, it seemed interesting to make an experimental evaluation of whether this damping value is acceptable for Italy, since it became possible to carry out such an assessment during the Italian earthquakes from 2012 to 2017. In the epicentral areas of the earthquakes of Emilia 2012, central Italy 2016 and Ischia 2017, there were ca. 40 permanent GPS stations [3,4] and the same number of accelerometer stations of the National Accelerometric Network (RAN) [5]. During the events of greatest magnitude, these stations recorded both the movements of the buildings (GPS stations) and the ground accelerations (RAN stations). From the instantaneous horizontal displacements measured by the buildings’ GPS antennas (rigidly fixed to one of the two walls either with steel brackets or directly to the roof with a purposely built reinforced concrete structure) and the instantaneous horizontal ground accelerations recorded directly by the accelerometer stations, two pseudo-acceleration spectra were obtained: that of the building and that of the ground (here called the spectra of the oscillator and of the external force, respectively). From each of these two spectra, the spectral ordinates corresponding to the value of the building’s elastic period of vibration To were extracted: this extraction was carried out for different values of ζ between zero and one. The relation between these spectral ordinates allowed us to draw parabolas for varying ζ values (an example of a parabola is reported in section 3); these parabolas present two extreme values of the relations in correspondence of ζ = 0 (free oscillation) and ζ = 1 (over damped oscillation), as well as values between 0 <ζ< 1 one of which being the minimum of the parabola. The latter value is the “experimental” damping ratio of the building hosting the permanent GPS station.
The buildings hosting the permanent GPS stations represent an experimental sample sufficiently significant for building type, geometry, height, material and use class (the latter for strategic importance, such as schools, universities, public offices, etc.), almost always built before the application of the most important national anti-seismic regulations. At the time of the study, improvements and seismic retrofit interventions had not yet been carried out; moreover, during the earthquakes the buildings did not suffer any deformations or failures sufficient to compromise their elastic functionality. These buildings were rapidly surveyed by teams of surveyors to acquire the following information:
1. Year of construction;
2. Building use class;
3. If the building was isolated or attached;
4. Prevalent vertical and horizontal structural type;
5. Direction of the floor joists;
6. Number of floors;
7. Height;
8. Planimetric dimensions;
9. Geographical orientation;
10. Planimetric regularity;
11. Height regularity;
12. Presence of stairwells/elevator shafts;
13. Distribution of loads and masses;
14. Damage and deformations caused by the tremors;
15. Presence or not of repair or seismic retrofit interventions.
The choice of the RAN accelerometric stations used in the study was based on closest proximity to the GPS station in order to assure geological similarity with the ground underlying the building. Finally, the magnitude of the earthquakes, the distances from the epicenters and the values of the inferred and recorded horizontal accelerations were more than adequate to guarantee the reliability of the results.
The work is divided as follows:
a. Definition of damping ratio ζ and discussion of the methods for its calculation reported in the literature;
b. Description of the manner of processing the GPS and accelerometric measurements and calculation of the spectra;
c. Estimation of the damping ratio values ζ;
d. Summary of the rapid structural geometrical survey of each building and a tabular summary of their characteristics;
e. Analysis of the results according to the geographical area, the year of construction, construction material and geometry of the building.
Background
In this article we refer to the damping ratio ζ in the dynamics equation of a simple oscillator (SDOF), also called damping factor, without making any distinction between its elastic component and hysteretic component. The reader is referred to specific texts [6,7] for a broader discussion.
The damping ratio is defined by the relation between the viscosity coefficient c (linked, by the oscillator velocity, to the viscous force) and the critical viscosity ct:
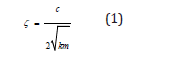
m is the mass and k the stiffness of the simple oscillator.
Different methods can be used to calculate its elastic component, the main one being estimation of the logarithmic decrease Δ between two successive peaks of the amplitude u of oscillation over time [3]

ζ is related to Δ by the following relation:

approximable to  for ζ values ≤ 0.3.
This method is based on the hypothesis that the decrease in amplitudes can be modulated by exponential functions, this hypothesis being strongly limiting if one wishes to identify Δ by means of in situ tests. Another method is based on the hypothesis that for oscillation frequencies close to those of resonance and for values of ζ<< 1 the damping ratio depends on the dynamic amplification factor D through:

Practical difficulties in estimating D suggest use of the bandwidth method [6], in which the damping ratio is calculated by the following expression:

Which is also approximable to  where ωo is the pulsation
of the oscillator while the pulsations ωf2 and ωf1 are calculated for amplitude values of
where ωo is the pulsation
of the oscillator while the pulsations ωf2 and ωf1 are calculated for amplitude values of
 being the peak displacement of
the external force.
being the peak displacement of
the external force.
It should be underlined that the numerical foundation of these methods is based on analytical equations expressed in the time domain.
Blandon & Priestley [45] give a broad discussion of calculation of the hysteretic component based on hysteretic models, levels of ductility of the materials and oscillation periods: the reader is referred to that paper for any clarifications.
Civil buildings are under damped dynamic systems: ζ is always less than 1 and the motion of the oscillator (building) is periodic oscillation with decreasing amplitude (under damped motion). For completeness it is necessary to point out the case of ζ=1, critical damping, while for ζ>1 (a condition that never occurs for buildings) the motion of the oscillator reaches the equilibrium position without oscillating (over damped motion).
Structural damping values are reported in ESDU [8] and Satake et al. [9] for various types of constructions and materials. Others are reported on the basis of the height of the buildings by Jeary [10], Fang et al. [11] and Lin et al. [12]. These values show strong variability, e.g. for towers between 0.1% and 2.5% and for buildings from 0.5% to 5%. Higher values have been associated with various sources of energy dissipation, including hyper stativity of the structure or the interaction between structural and non-structural components.
The Studied Buildings
The 40 buildings involved in the study are located in the epicentral areas of the earthquakes of Emilia 2012, central Italy 2016 and Ischia 2017. Figure 1 shows their geographical position and the position of the epicenters of the earthquakes. They host 40 permanent GPS stations that recorded the GPS signal during the earthquakes and were situated from 3 to 90km from the epicenters. The GPS measurements from these stations were memorized in double-frequency GPS receivers (Figure 2a) with a sampling rate between 5 and 20Hz [13-15] connected to choke ring antennas (Figure 2b) rigidly fixed to the buildings.
figure 1: GPS permanent stations and epicenters of the earthquakes of 20 and 29 May 2012, Mw 5.9 and Mw 5.8. GPS permanent stations and epicenters of the earthquakes of 24 August, 26 October and 30 October 2016, Mw 6.0, Mw 5.9 and Mw 6.5. GPS permanent station and RAN accelerometric station for the earthquake of 21 August 2017, Mw 3.9.

figure 2:GPS station: (a) receiver; (b) antenna.

Experimental Estimation of the Damping Ratio
The data from the permanent GPS stations and RAN accelerometric stations used in this study refer to the hourly recordings corresponding to the events of greatest magnitude, namely:
1. 20 May 2012 02:03:53 UTC Mw 5.9;
2. 29 May 2012 07:00:03 UTC Mw 5.8, earthquakes in Emilia;
3. 24 August 2016 01:36:32 UTC Mw 6.0;?
4. 26 October 2016 19:18:06 UTC Mw 5.9;
5. 30 October 2016 06:40:17 UTC Mw 6.5, earthquakes in central Italy;
6. 21 August 2017 18:57:51 UTC Mw 3.9, earthquake in Ischia.
Processing of the GPS measurements
The permanent GPS stations were set up to record data that could be used in scientific research fields related to global geodetic reference systems, geodynamic studies of the earth’s crust [16] or the more traditional sector of surveying and mapping with master/ virtual reference stations in RTKS (Real Time Kinematics Survey). In recent years, this has particularly regarded the precise point positioning (PPP) technique due to its ability to generate accurate instantaneous positioning to detect the dynamic characteristics of structures, especially suspension bridges, dams or buildings during particularly strong earthquakes [17-30].
From the data of the permanent stations we isolated the hourly files recorded during the aforesaid seismic events (identification of the hourly file including the time of the seismic event was carried out with simple editing codes from the files containing the GPS measurements). The GPS measurements consist of phase measurements and code measurements: they represent the input of the PPP calculation model [30-34]. To solve the PPP model we used GIPSY OASIS II developed by the Jet Propulsion Laboratory (JPL) as single-receiver ambiguity resolution in kinematic positioning (function of time) or PPP, RINEX 2.11 input file format, measurement types: dual frequency P code and phase; JPL’s precise orbit and clock products in the ITRF08 reference system, cut off 5°, average PDOP less than 2, IGS standards satellite antenna phase center offset, antenna type in RINEX input file, Tropospheric gradients, Second order ionospheric delay [35-37].
The output of the least squares solution of this model consists of the instantaneous coordinates of the phase center of the antenna in ECEF ITRF08. For convenience, we chose to express them in the North-East local system whose origin coincides with the antenna’s phase center and the axes coordinated respectively with the directions tangent to the meridian and to the parallel passing through the origin. In this way the instantaneous coordinates subsequent to time t=0 represent the instantaneous displacements of the antenna, i.e. the vibrations of the building to which it is rigidly fixed: based on the literature they can be considered affected by an error of 0.5cm/sec [38]. For a considerable number of the stations, it was necessary to rotate the North and East instantaneous coordinates along the directions parallel to the building’s external walls: the alignment was achieved with a simple rotation equal to the directional angle of one wall with respect to true North (values reported in Table 1). Finally, the second derivative with respect to time of the previous North and East coordinates-instantaneous displacements represented the input for calculation of the response spectra of the building.
Table 1:Summary of the information acquired during the rapid survey carried out for each permanent GPS station.

Processing of the accelerometric measurements
National Accelerometric Network (RAN) stations situated near each building (Figure 3) recorded the same seismic events indicated above with a sampling rate of 200Hz and in the North-South and East-West directions: also for these components it was necessary to perform an alignment in the direction of the nearby permanent GPS station. A third- or sixth-order Butterworth band-pass filter with a variable range of 0.1 to 50Hz was used for their processing [39-41].
figure 3:RAN accelerometric stations and epicenters of the earthquakes of 20 and 29 May 2012, Mw 5.9 and Mw 5.8. RAN accelerometric stations and epicenters of the earthquakes of 24 August, 26 October and 30 October 2016, Mw 6.0, Mw 5.9 and Mw 6.5.

Calculation of the damping ratio
We started with the following hypothesis: if, in the equation of the dynamics of a simple oscillator expressed in the frequency domain [6], its elastic period of vibration To is known, then the transfer function depends only on the damping ratio ζ: in this case the peak of the response spectrum corresponds to the damping value, which renders the function minimal.
Therefore, calculation of the damping ratio was performed in the following steps:
a) The horizontal displacements of each building hosting the GPS station calculated in section 3.1 and the accelerometric recordings of the nearby RAN station calculated in section 3.2 are used to construct pairs of pseudo-acceleration response spectra of the building (oscillator spectrum) and of the ground (external force spectrum) for damping ratio values ζ of 0, 0.01, 0.02, 0.03, 0.05, 0.055, 0.6, 0.8, 0.10, 0.15, 0.20, 0.25, 0.3, 0.5 and 1;
b) For each pair of calculated spectra, the corresponding spectral ordinates are extracted based on the value of the building’s elastic period of vibration To;
c) The relations between the pair of spectral ordinates previously extracted for each of the damping ratio values ζ indicated at point a) are reported in a plot whose extremes on the abscissa are 0 and 1;
d) The minimum interval between two consecutive values of ζ indicated at point a) is identified on this plot, which has a parabolic shape;
e) The lower end of this interval is increased by a few decimal points (for example 0.005) up to the upper value of the interval. The search for the minimum takes place in this interval, repeating steps a & b.
This last value represents the damping ratio ζ of the building hosting the permanent GPS station: it has an indetermination equal to the value of the increase. The described processing steps were conducted with a dedicated code developed in the MATLAB environment.
Figure 4 reports an example of pseudo-acceleration spectra calculated from the horizontal GPS displacements recorded at the Concordia station (CONC) and from the accelerometric recordings at the RAN station of Moglia (MOG0), the latter only a few kilometers from the former, during the earthquake of 29 May 2012 07:00:03 UTC Mw 5.8. In this case, the Concordia GPS station has an elastic period of oscillation To of 0.26 seconds [42]. The parabola constructed from the relation of the spectral ordinates obtained from the previous spectra as the damping ratio varies, for To = 0.26, is reported in Figure 5.
figure 4:Pseudo-acceleration spectra obtained from the GPS measurements of the Concordia station (CONC) and from the accelerometric records of the RAN station of Moglia (MOG0).

figure 5:Parabola constructed from the relation of the spectral ordinates obtained from the previous spectra as the damping ratio varies, for To=0.26 (To=0.25; To=0.27).

As can be seen from the figure, the parabola has two extremes in correspondence to the values ζ = 0 (free oscillation) and ζ = 1 (over damped oscillation) and a minimum (approximated) between 0.10 and 0.12.
Figure 6 shows the shape of the parabola in the approximated minimum interval for increases of 0.005: the minimum point is seen at 0.110. This value is taken as the “experimental” damping ratio of the permanent GPS station of Concordia (CONC) during the earthquake of 29 May 2012 07:00:03 UTC Mw 5.8, calculated from data of the Moglia accelerometric station (MOG0).
figure 6:Parabolic shape in the approximated minimum interval for increases of 0.005. Minimum point at ζ = 0.110.

It should be underlined that the calculation was verified also for To values near to that of the structure, with the same results (Figure 5, parabolas constructed for To = 0.25 and 0.27). The elastic period of vibration To of each GPS station was calculated by means of a procedure described by Gatti [42].
Moreover, since for each GPS station it was possible to have recordings from several seismic events and recordings from several nearby accelerometric stations, the damping ratio calculation was repeated several times. The exception is Ischia where there was only one seismic event and only a single accelerometric station (ISCH). Table 2 reports the estimated mean values for each site with their mean squared error (MSE) and elastic period of vibration [43,44].
Table 2:Elastic period of vibration and damping ratio zwith MSE for each permanent GPS station.

Rapid Structural Geometric Survey
The minimal geometric and structural characteristics of the investigated buildings necessary to verify the test results were collected with a rapid survey consisting of an inspection and compilation of a technical-numerical and informational questionnaire. No particularly complex or detailed geometrical surveys were carried out, except for measurement of the height of the building and the linear planimetric dimensions of the external perimeter; on-site inspections or tests of materials were not performed, nor were complex structural modeling. During the survey, a visual examination was conducted to check for structural or plant failures, repair or seismic retrofit interventions, as well as deformations, failures or relative movements between structural elements at the foundation level induced by the earthquake.
In particular, the following information was acquired during the survey:
1. Year of construction;
2. Building use class;
3. If the building was isolated or attached;
4. Prevalent vertical and horizontal structural type;
5. Direction of the floor joists;
6. Number of floors;
7. Height (prevalent min - max);
8. Planimetric dimensions (prevalent min - max);
9. Geographical orientation;
10. Planimetric regularity;
11. Height regularity;
12. Presence of stairwells/elevator shafts;
13. Distribution of loads and masses.
A summary of the survey is given in Table 1. Two geographical areas are distinguished:
a) Emilia: The prevalent structural type is reinforced concrete frame with either concrete or brick vertical infill walls. The joists of the floor assemblies (in hollow-core concrete for the floors or in concrete for the roof) are always arranged parallel to the direction of the shorter planimetric length of the building, almost never staggered; the prevailing roof cover is flat. There are some masonry buildings with floors in hollowcore concrete and pitched roofs. The heights vary from a minimum of 4 to a maximum of 20 meters, with a maximum of five floors (inter-floor heights ranging from 3 to 5 meters). The prevailing planimetric geometry is rectangular with an equal incidence on both the planimetric and height regularity. In all buildings, except single-story ones, there are stairwells and elevator shafts, almost never in a central position, and the distribution of permanent-incidental loads and masses is generally uniform. Finally, up to the date of the earthquakes, there had been no repair or seismic retrofit interventions but only quantitative vulnerability analyses, and most of the buildings had not suffered damage such to render them wholly or partly unusable. There was the same number of so-called strategic buildings (Class III) and residential buildings (Class II);
b) Central Italy-Islands: The prevalent structural type is masonry. The joists (in wood or in concrete, both for the floor and the roof) are arranged parallel to the direction of the shorter planimetric length of the building. The prevailing roof cover is pitched. The heights vary from a minimum of 4 to a maximum of 23 meters, with a maximum of six floors (interfloor heights ranging from 3 to 3.5 meters). The prevailing planimetric geometry is rectangular with greater incidence on both the planimetric and height regularity. There are stairwells and elevator shafts, almost never in a central position, and the distribution of permanent-incidental loads and masses is generally uniform. The investigation revealed that there had been no repair or seismic retrofit interventions to the buildings and that three of the ten had suffered damages such to render them temporarily unusable. In these cases, the predominant use class is III.
Analysis of the Results
First, the sample mean of the estimated ζ values is 0.072 with MSE = 0.002. We then repeated this calculation dividing the buildings by geographical area: for those (29) in the Emilia area, the mean value is ζ = 0.066 with MSE = 0.006; for those (11) in central Italy-Islands, the mean damping ratio has a slightly higher value (ζ = 0.081±0.009), probably due to the presence of buildings with greater stiffness. We then verified the percentage of the sample’s ζ values within four significant intervals: 0-0.05, 0.05 to 0.10, 0.10- 0.15 and 0.15-0.20: more than 70% of the ζ values are in the range 0 to 0.1, while less than 10% are in the range 0.15 to 0.20 (Figure 7).
figure 7:Percentage of the sample’s damping ratio values within four significant ranges.

Finally, the damping ratio ζ was compared on the basis of:
a. Year of construction. Considering the time periods present in the sample, we chose time intervals characterized by particularly serious seismic events that prompted the Italian government to pass laws and technical regulations for buildings:
b. Between 1900 and 1935 (earthquakes of Messina 1909 and Avezzano 1915);
c. Between 1950 and 1975 (earthquake of Belice 1968);
d. Between 1978 and 1996 (earthquakes in Friuli 1976 and Irpinia 1980);
e. Between 1996 and 2002 (earthquake of Umbria and Marche 1997);
f. Between 2002 and 2004 (earthquake of Molise 2004);
g. After 2004 (earthquakes of L’Aquila 2009, Emilia- Romagna 2012 and central Italy 2016) (Figure 8);
figure 8:Comparison based on year of construction.

h. Construction material (reinforced concrete frames with various infills, solid masonry, stonework, etc.) (Figure 9);
i. Geometry (height-number of floors - Figure 10, planimetric regularity - Table 3, height regularity - Table 4);
figure 9:Comparison based on construction material: full masonry, regular stonework, reinforced concrete frames and various infills, etc.

figure 10:Comparison based on height-number of floors.

Table 3:Comparison based on planimetric regularity.

Table 4:Comparison based on height regularity.

Conclusion
A first aspect to be emphasized is the contribution of GPS measurements to the study of structural dynamics of buildings, particularly definition of the parameters of the oscillator equations (period, damping and amplitude).
The estimated damping ratio values are at least two percentage points higher than those imposed by the technical regulations, with a more plausible value of 7%. More specifically, the masonry buildings and those in reinforced concrete with brick or concrete in fills have values close to 0.065, which increase to 0.08 when the infill is made of stiffer material such as glass. With regard to year of construction, the variability is minimal, with a maximum near 0.09 for buildings built after 2004. Concerning the number of floors, the damping value decreases from 0.08 for single-story buildings to 0.045 for those with five floors. The mean values are identical (0.07) for buildings with and without planimetric regularity and height regularity.
Therefore, the use of conventional damping could lead to incorrect results. The limitations of the study lie in the impossibility to choose a priori the geometry and/or structural type of the building hosting the permanent GPS station.
Acknowledgement
Heartfelt thanks to the Presidency of the Council of Ministers - Department of Civil Protection and to the National Institute of Geophysics and Volcanology for providing the data from the RAN stations and permanent GPS stations.
References
- (2004) CEN-Comite European de Normalisation European. Prestandard ENV 1998-1-4 Eurocode 8-Design of structures for earthquake resistance, Part 1-4: Strengthening and repair of buildings. Brussels, Belgium.
- (2018) NTC-Update of the technical regulations for buildings. Rome: Official document of the Italian Government n° 42 20 Febbraio 2018.
- Avallone A, Anastasio E, Serpelloni E, Latorre D, Cavaliere A, et al. (2012) High-rate (1 to 20Hz) GPS co-seismic dynamic displacements carried out during the 2012 Emilia seismic sequence. Ann Geophys 55(4): 773-779.
- Avallone A, Latorre D, Serpelloni E, Cavaliere A, Herrero A, et al. (2016) Coseismic displacement waveforms for the 2016 August 24 Mw 6.0 Amatrice earthquake (central Italy) carried out from High-Rate GPS data. Ann Geophys 59(5): 1-11.
- INGV - National Institute of Geophysics and Volcanology (2016) Summary Report on the 30 October, 2016 Earthquake in Central Italy Mw 6.5. Rome D.P 200: 1-49.
- Chopra AK (1995) Dynamics of Structures: Theory and Applications to Earthquake Engineering. Prentice-Hall Inc. Upper Saddle River, New York, USA.
- Elnashai AS, Di Sarno L (2008) Fundamentals of Earthquake Engineering. Chichester UK: John Wiley & Sons, Southern Gate, UK, pp. 1-374.
- ESDU - Engineering Sciences Data Unit Structural Parameters Used in Response Calculations (Estimation of Numerical Values) (1991) London UK: ESDU International Item N. 91001.
- Satake N, Suda K, Arakawa T, Sasaki A, Tamura Y (2003) Damping evaluation using full scale data of buildings in Japan. J Struct Eng 129(4): 470-477.
- Jeary AP (1986) Damping in tall buildings. A mechanism and a predictor. Earthquake Eng Struct Dyn 14(5): 733-750.
- Fang JQ, Li QS, Jeary AP, Liu DK (1999) Damping of tall buildings: Its evaluation and probabilistic characteristics. Struct Design Tall Spec Build 8(2): 145-153
- Lin YY, Miranda E, Chang KC (2005) Evaluation of damping reduction factors for estimating elastic response of structures with high damping. Earthquake Eng Struct Dyn 34(11): 1427-1443.
- Moschas F, Stiros SC (2015) Dynamic deflections of a stiff footbridge using 100Hz GNSS and accelerometer data. J Surv Eng 141(4): ID 04015003.
- Moschas F, Stiros SC (2015) PLL bandwidth and noise in 100 Hz GPS measurements. GPS Solutions 19(2): 173-185.
- Yi TH, Li HN, Gu M (2013) Experimental assessment of high-rate GPS receivers for deformation monitoring of bridge. Meas 46(1): 420-432.
- Gurtner W (1995) Guidelines for a Permanent EUREF GPS Network. In: Gubler E, Hornik H (Eds.), Proceedings of EUREF Symposium, EUREF Publication No. 4, Helsinki, Finland.
- Yigit CO, Gurlek E (2017) Experimental testing of high-rate GNSS precise point positioning (PPP) method for detecting dynamic vertical displacement response of engineering structures. Geomat Nat Haz Risk 1: 893-904.
- Yigit CO (2016) Experimental assessment of post-processed kinematic Precise Point Positioning method for structural health monitoring. Geomat Nat Haz Risk 7(1): 360-383.
- Yi TH, Li HN, Gu M (2013) Recent research and applications of GPS based monitoring technology for high-rise structures. Struct Control Health Monit 20(5): 649-670.
- Yi TH, Li HN, Gu M (2013) Wavelet based multi-step filtering method for bridge health monitoring using GPS and accelerometer. Smart Struct Syst 11(4): 331-348.
- Moschas F, Avallone A, Saltogianni V, Stiros SC (2014) Strong motion displacement waveforms using 10-Hz precise point positioning GPS: an assessment based on free oscillation experiments. Earthquake Eng Struct Dyn 43(12): 1853-1866.
- Breuer P, Chmielewski T, Górski P, Konopka E, Tarczyński L (2015) Monitoring horizontal displacements in a vertical profile of a tall industrial chimney using Global Positioning System technology for detecting dynamic characteristics. Struct Control Health Monit 22(7): 1002-1023.
- Moschas F, Stiros SC (2011) Measurement of the dynamic displacements and of the modal frequencies of a short-span pedestrian bridge using GPS and an accelerometer. Eng Struct 33(1): 10-17.
- Yi TH, Li HN, Gu M (2009) Ambient vibration study for real time monitoring of suspension bridge using GPS. Zurich, Switzerland Proceedings of the 4th International Conference on Structural Health Monitoring on Intelligent Infrastructure (SHMII-4).
- Yi TH, Li HN, Gu M (2010) Recent research and applications of GPS based technology for bridge health monitoring. Sci China Technol Sci 53(10): 2597-2610.
- Yi TH, Li HN, Gu M (2010) Full scale measurement of dynamic response of a suspension bridge subjected to environmental loads using GPS technology. Sci China Technol Sci 53(2): 469-479.
- Kobori T, Yamaguchi Y, Nakashima S, Shimizu N (2015) Continuous displacement monitoring of rockfill dam during earthquakes by using global positioning system. J Jpn Soc Dam Eng 25(1): 6-15.
- Hong L, Hwang W (2000) Empirical formula for fundamental vibration periods of reinforced concrete buildings in Taiwan. Earthquake Eng Struct Dyn 29(3): 327-333.
- Shi C, Lou Y, Zhang H, Zhao Q, Geng J, et al. (2010) Seismic deformation of the Mw 8.0 Wenchuan earthquake from high-rate GPS observations. Adv Space Res 46(2): 228-235.
- Gatti M (2018) Peak horizontal vibrations from GPS response spectra in the epicentral areas of the 2016 earthquake in central Italy. Geomat Nat Haz Risk 9(1): 403-415.
- Zumberge J, Heflin M, Jefferson D, Watkins M, Webb F (1997) Precise point positioning for the efficient and robust analysis of GPS data from large networks. J Geophys Res 102(3): 5005-5017.
- Bertiger W, Desai SD, Haines B, Harvey N, Moore AW, et al. (2010) Single receiver phase ambiguity resolution with GPS data. J Geod 84(5): 327- 337.
- Xu P, Shi C, Fang R, Liu J, Niu X, et al. (2013) High-rate precise point positioning (PPP) to measure seismic wave motions: an experimental comparison of GPS PPP with inertial measurement units. J Geod 87(4): 361-372.
- Psimoulis P, Houlie N, Meindl M, Rothacher M (2015) Consistency of PPP GPS and strong-motion records: case study of Mw 9.0 Tohoku-Oki 2011 earthquake. Smart Struct Syst 16(2): 347-366.
- Webb FH, Zumberge JF (1996) An introduction to GIPSY/OASIS-II: precision software for the analysis of data from the Global Positioning System. Ed. JPL D-11088 July.
- Bar-Sever YE, Kroger PM, Borjesson JA (1998) Estimating horizontal gradients of tropospheric path delay with a single GPS receiver. J Geophys Res 103(3): 5019-5035.
- Kedar S, Hajj GA, Wilson BD, Heflin MB (2003) The effect of the second order GPS ionospheric correction on receiver positions. Geophys Res Lett 30(16): 1829.
- Psimoulis P, Pytharouli S, Karambalis D, Stiros SC (2008) Potential of Global Positioning System (GPS) to measure frequencies of oscillations of engineering structures. J Sound Vib 318(3): 606-623.
- Stearns S, David R (1996) Signal Processing Algorithms. Prentice-Hall, USA.
- Lynn PA, Fuerst W (1998) Introductory Digital Signal Processing with Computer Applications. Wiley & Sons.
- Boore DM, Akkar S (2003) Effects of causal and acausal filters on elastic and inelastic response spectra. Earthquake Eng Struct Dyn 32(11): 1729-1748.
- Gatti M (2018) Forthcoming Elastic period of vibration calculated experimentally in buildings hosting permanent GPS stations. Earthquake Eng Eng Vib.
- Bachmann H, Ammann WJ, Deischl F, Eisenmann J, Floegl I, et al. (1995) Vibration Problems in Structures. Practical Guidelines. Basel Switzerland: Birkhauser Verlag, Switzerland, p. 234.
- Schaal RE, Larocca APC (2009) Measuring dynamic oscillations of a small span cable-stayed footbridge: Case study using L1 GPS receivers. J Surv Eng 135(1): 33-37.
- Blandon CA, Priestley MJN (2005) Equivalent viscous damping equations for direct displacement based design. Journal of Earthquake Engineering 9(2): 257-278.
© 2018 Marco Gatti. This is an open access article distributed under the terms of the Creative Commons Attribution License , which permits unrestricted use, distribution, and build upon your work non-commercially.
Editor In Chief


.jpg)


Signup for Newsletter

Quick Links
 Editorial Board Registrations
 Submit your Article
 Refer a Friend
 Advertise With Us
Our Recent Edition

.jpg)


Top Editors


.jpg)


.bmp)
.jpg)
.png)
.jpg)


.jpg)


.png)

.png)


.png)


Financial Support

Sponsors

Latest e-Books

Latest Video

 a Creative Commons Attribution 4.0 International License. Based on a work at www.crimsonpublishers.com.
Best viewed in
a Creative Commons Attribution 4.0 International License. Based on a work at www.crimsonpublishers.com.
Best viewed in